| Param | Original file | Final file |
|---|---|---|
| Filename | modeM0/AS1A09_002T01_9000005322_37451cztM0_level2.evt | modeM0/AS1A09_002T01_9000005322_37451cztM0_level2_quad_clean.evt |
| Size (bytes) | 528,258,240 | 94,478,400 |
| Size | 503.8 MB | 90.1 MB |
| Events in quadrant A | 2,887,561 | 656,637 |
| Events in quadrant B | 4,198,408 | 632,650 |
| Events in quadrant C | 4,388,394 | 595,071 |
| Events in quadrant D | 4,174,515 | 614,996 |
| Mode M0 | |||
|---|---|---|---|
| Quadrant | BADHDUFLAG | Total packets | Discarded packets |
| A | 0 | 11575 | 3 |
| B | 0 | 15805 | 2 |
| C | 0 | 16176 | 2 |
| D | 0 | 15808 | 2 |
| Mode M9 | |||
|---|---|---|---|
| Quadrant | BADHDUFLAG | Total packets | Discarded packets |
| A | 0 | 27 | 0 |
| B | 0 | 27 | 0 |
| C | 0 | 27 | 0 |
| D | 0 | 28 | 0 |
| Mode SS | |||
|---|---|---|---|
| Quadrant | BADHDUFLAG | Total packets | Discarded packets |
| A | 0 | 104 | 0 |
| B | 0 | 104 | 0 |
| C | 0 | 104 | 0 |
| D | 0 | 104 | 0 |
| Quadrant | Total seconds | Saturated seconds | Saturation percentage |
|---|---|---|---|
| A | 5159 | 16 | 0.310138% |
| B | 5159 | 560 | 10.854817% |
| C | 5159 | 843 | 16.340376% |
| D | 5159 | 403 | 7.811591% |
Noise dominated data is calculated using 1-second bins in cleaned event files. If a bin has >2000 counts, and if more than 50% of those come from <1% of pixels, then it is considered to be noise-dominated and hence unusable.
| Quadrant | # 1 sec bins | Bins with >0 counts | Bins with >2000 counts | High rate bins dominated by noise | Noise dominated (total time) | Noise dominated (detector-on time) | Marked lightcurve |
|---|---|---|---|---|---|---|---|
| A | 7073 | 5160 | 8 | 8 | 0.11% | 0.16% | 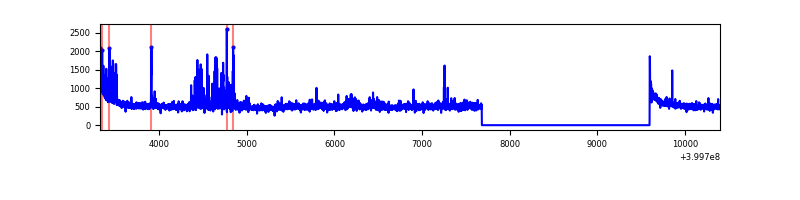 |
| B | 7073 | 5160 | 488 | 488 | 6.90% | 9.46% | 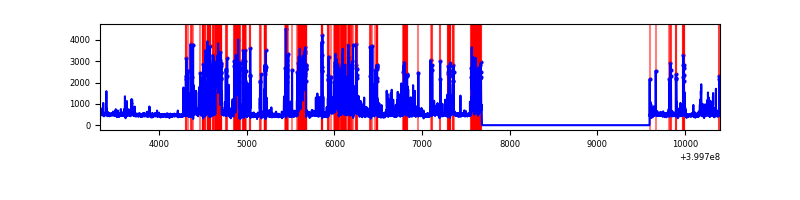 |
| C | 7073 | 5160 | 612 | 612 | 8.65% | 11.86% | 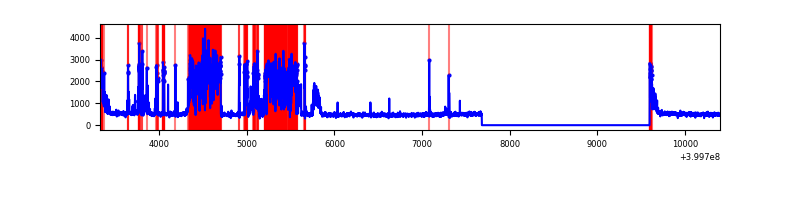 |
| D | 7073 | 5160 | 345 | 345 | 4.88% | 6.69% | 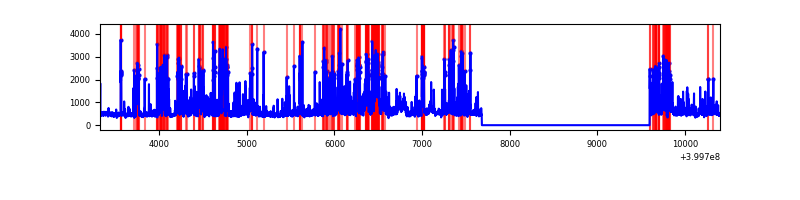 |
Top three noisy pixels from each quadrant. If the there are fewer than three noisy pixels in the level2.evt file, extra rows are filled as -1
| Pixel properties | Quadrant properties | ||||||
|---|---|---|---|---|---|---|---|
| Quadrant | DetID | PixID | Counts | Sigma | Mean | Median | Sigma |
| A | 10 | 83 | 276620 | 2311.26 | 594 | 583 | 119.4 |
| A | 13 | 248 | 217355 | 1815.03 | 594 | 583 | 119.4 |
| A | 15 | 222 | 47116 | 389.62 | 594 | 583 | 119.4 |
| B | 15 | 35 | 1576244 | 14795.46 | 562 | 549 | 106.5 |
| B | 4 | 171 | 276574 | 2591.82 | 562 | 549 | 106.5 |
| B | 0 | 213 | 21906 | 200.54 | 562 | 549 | 106.5 |
| C | 14 | 254 | 1954872 | 16245.19 | 523 | 528 | 120.3 |
| C | 15 | 214 | 205703 | 1705.48 | 523 | 528 | 120.3 |
| C | 0 | 10 | 178282 | 1477.55 | 523 | 528 | 120.3 |
| D | 13 | 249 | 802850 | 5830.57 | 566 | 551 | 137.6 |
| D | 10 | 199 | 314419 | 2280.98 | 566 | 551 | 137.6 |
| D | 2 | 249 | 246955 | 1790.7 | 566 | 551 | 137.6 |
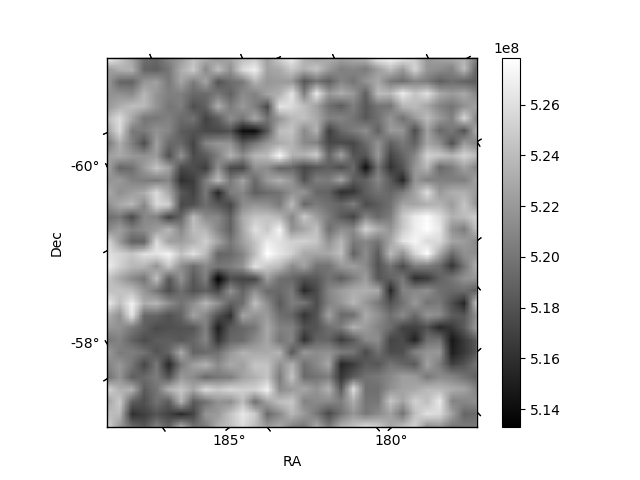
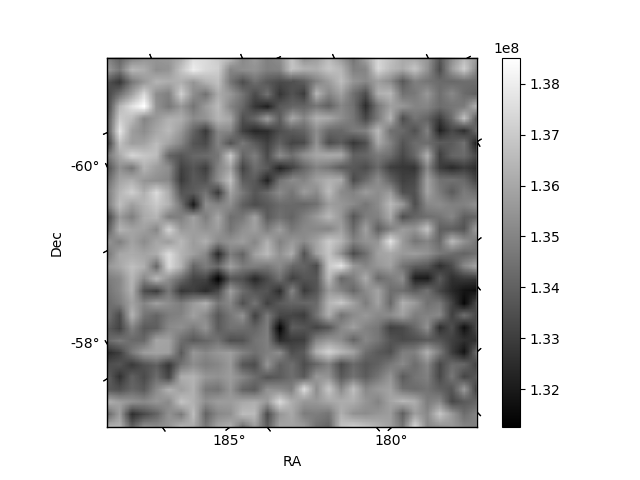
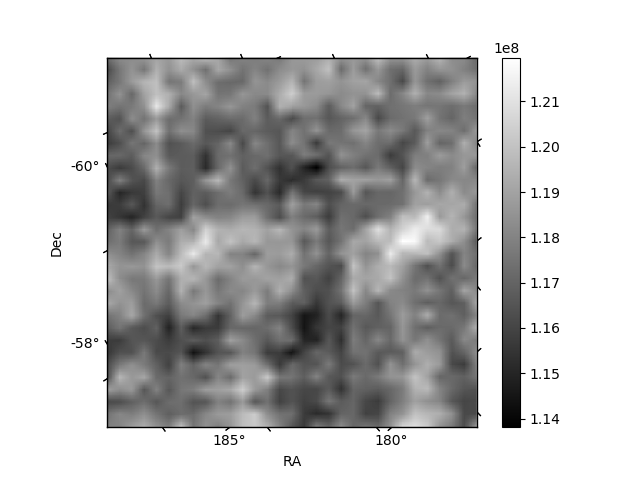
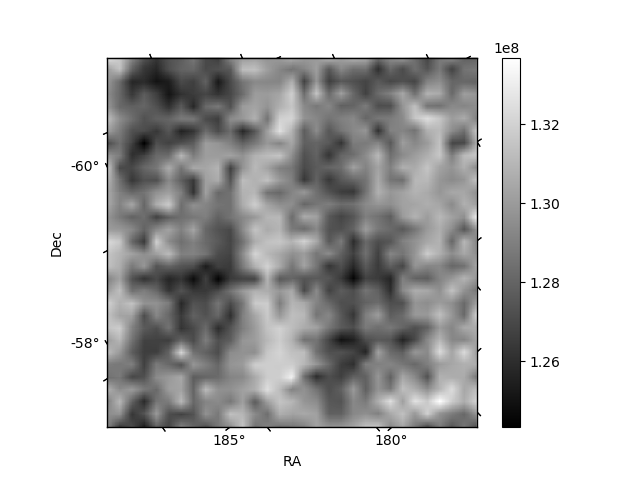
Histogram calculated using DETX and DETY for each event in the final _common_clean file
| Quadrant A | 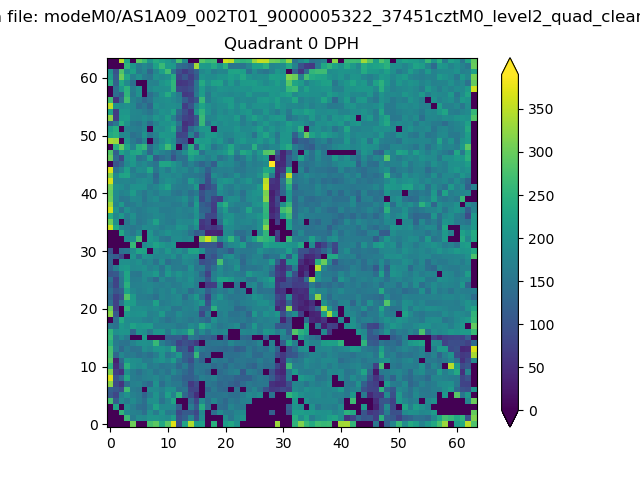 |
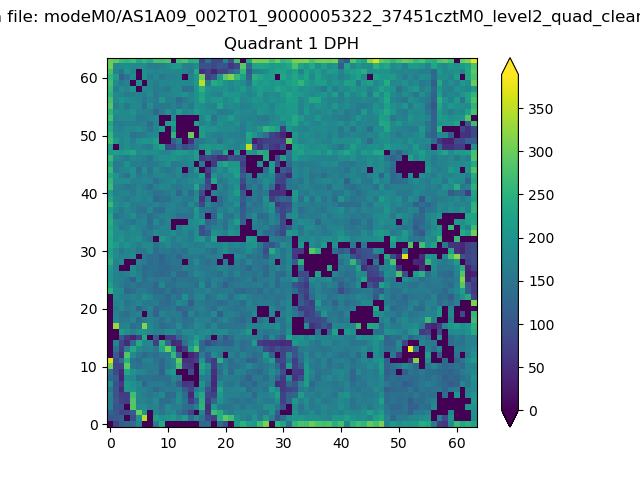 |
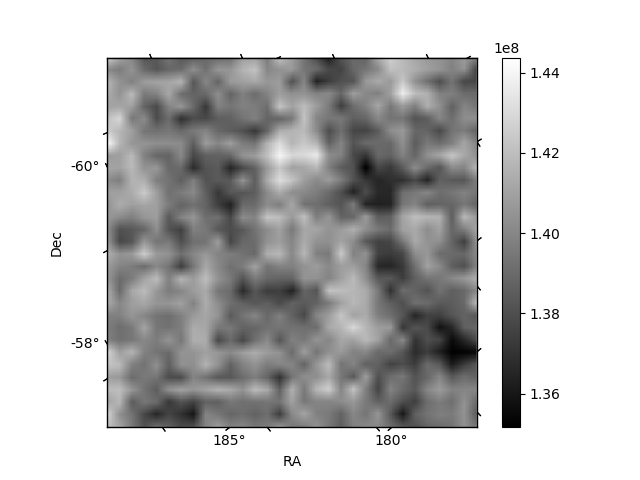
Quadrant B |
|---|---|---|---|
| Quadrant D | 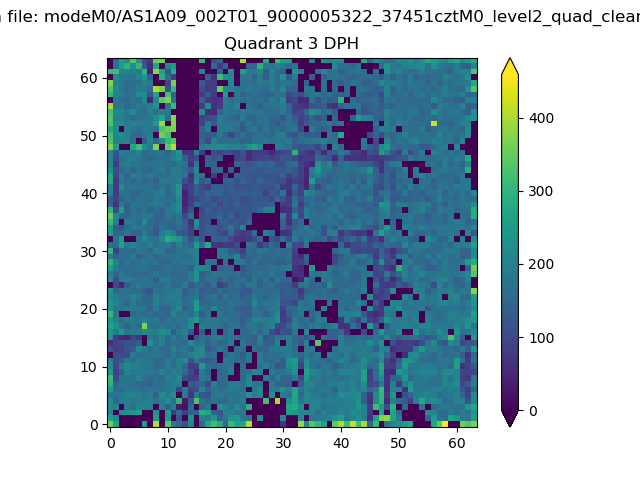 |
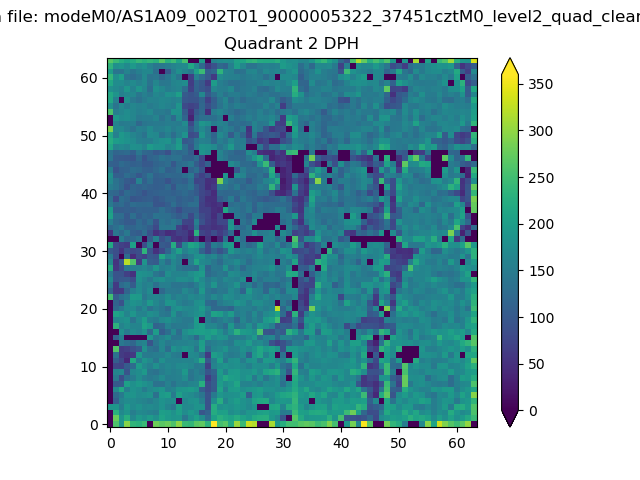 |
Quadrant C |
| Plot type | Count rate plots | Images |
|---|---|---|
| Comparison with Poisson distribution Blue bars denote a histogram of data divided into 1 sec bins. Red curve is a Poisson curve with rate = median count rate of data. |
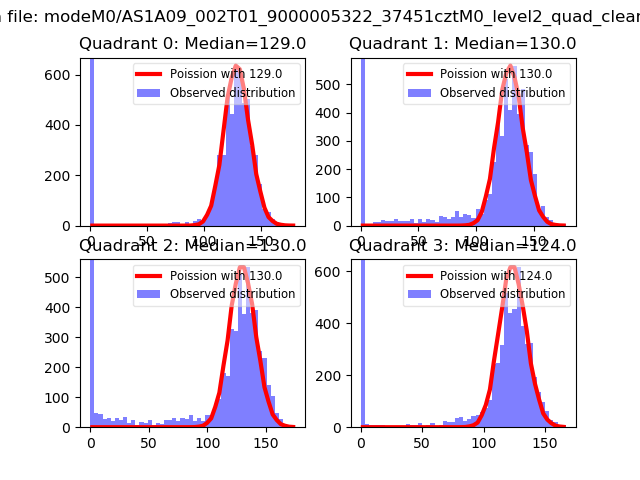 |
 |
| Quadrant-wise count rates Data is divided into 100 sec bins |
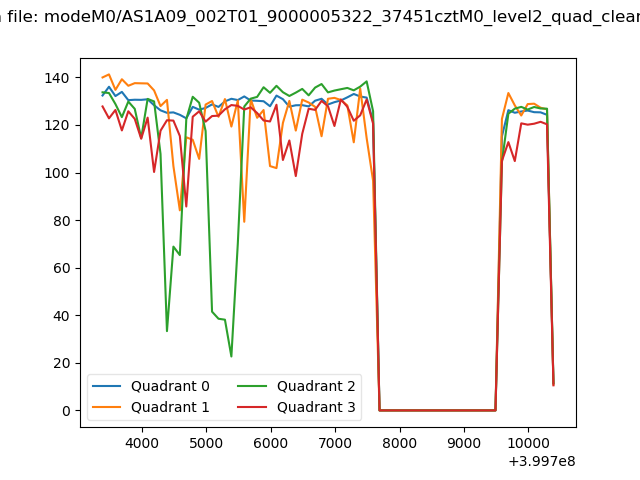 |
|
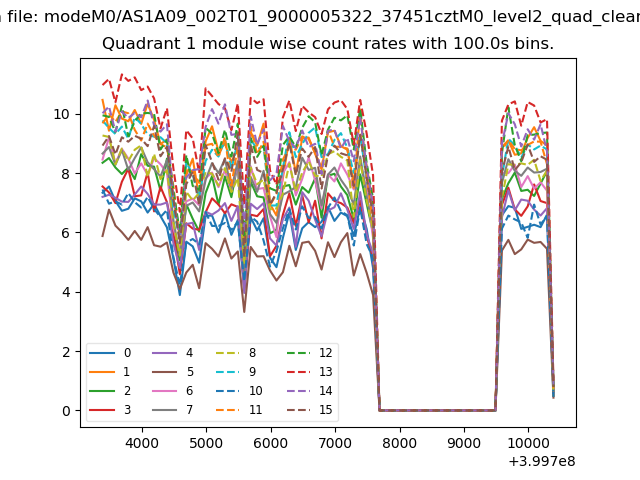
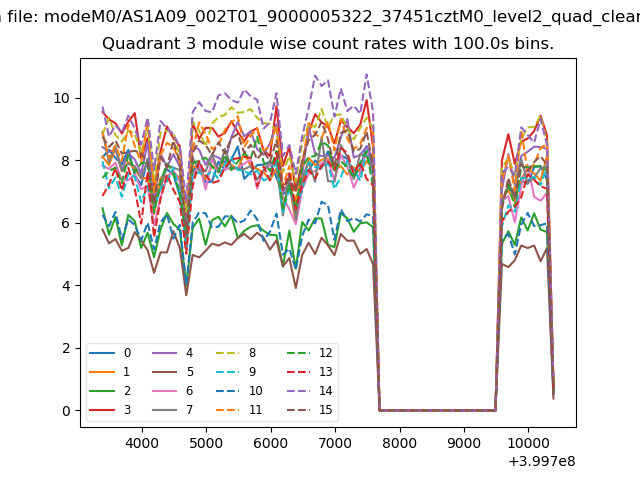
| Module-wise count rates for Quadrant A Data is divided into 100 sec bins |
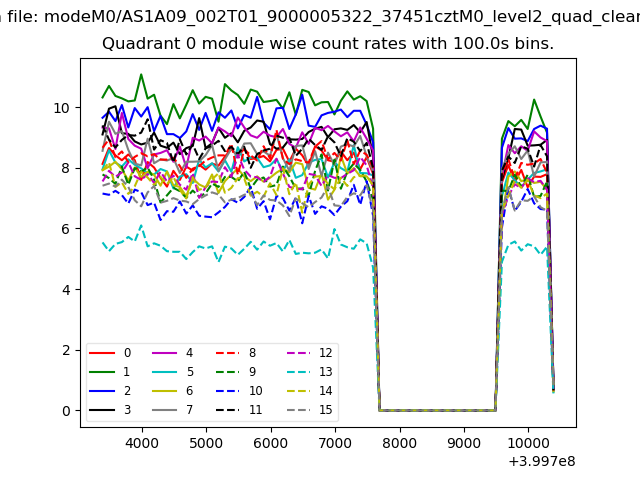 |
 |
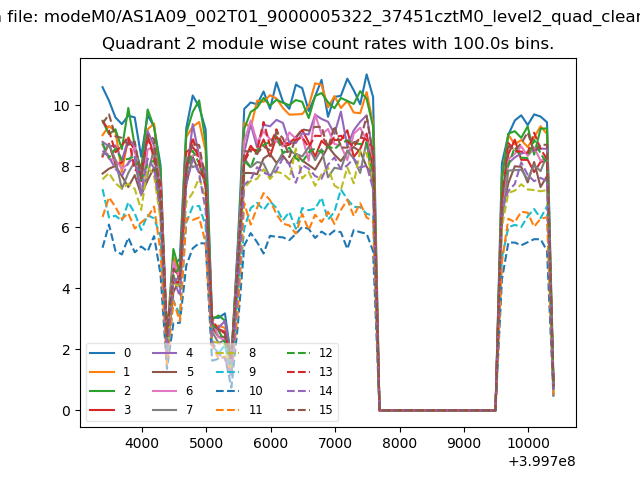
| Module-wise count rates for Quadrant B Data is divided into 100 sec bins |
 |
 |
| Module-wise count rates for Quadrant C Data is divided into 100 sec bins |
 |
 |
| Module-wise count rates for Quadrant D Data is divided into 100 sec bins |
 |
 |
| Parameter | Plot |
|---|---|
| CZT HV Monitor | 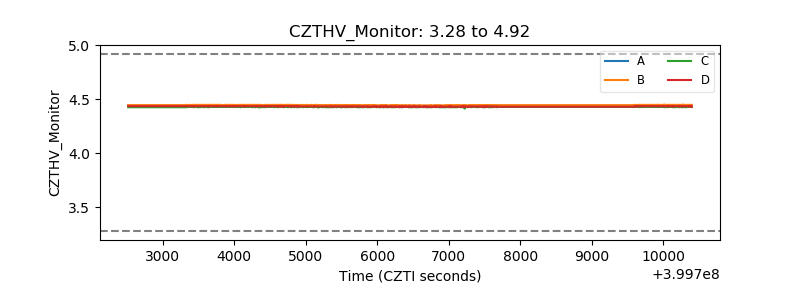 |
| D_VDD | 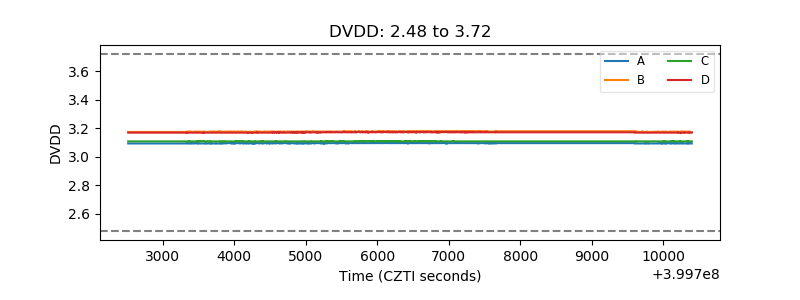 |
| Temperature 1 | 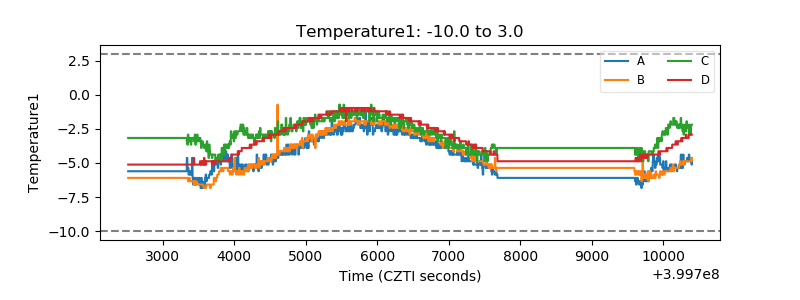 |
| Veto HV Monitor | 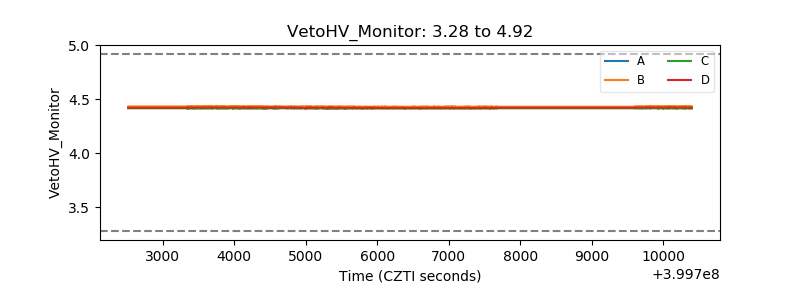 |
| Veto LLD | 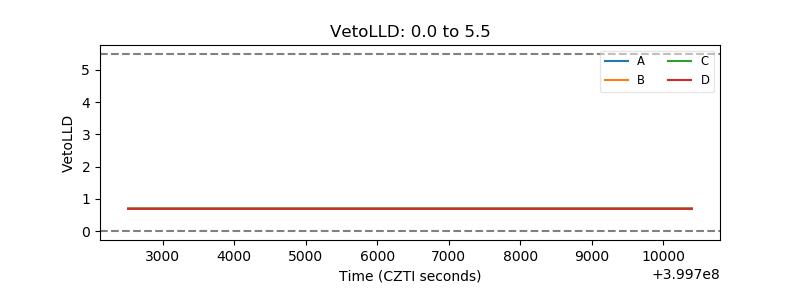 |
| Alpha Counter | 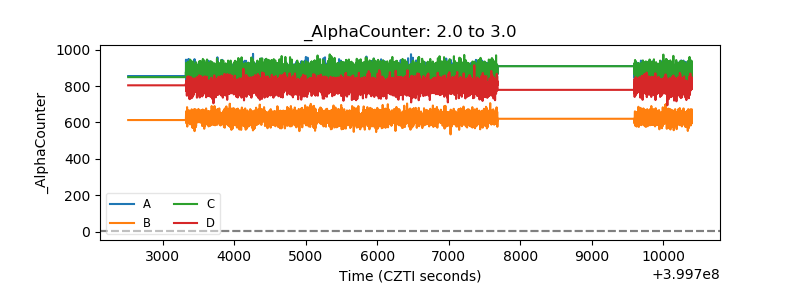 |
| _CPM_Rate | 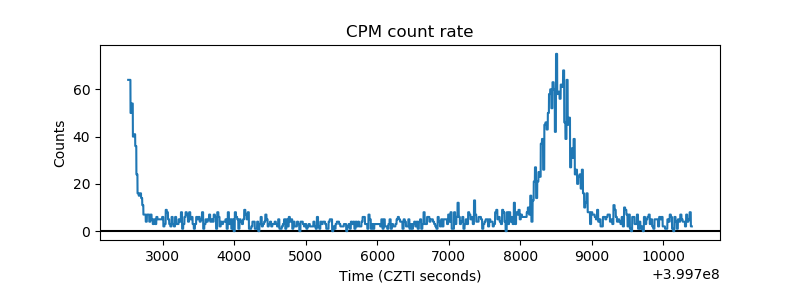 |
| CZT Counter | 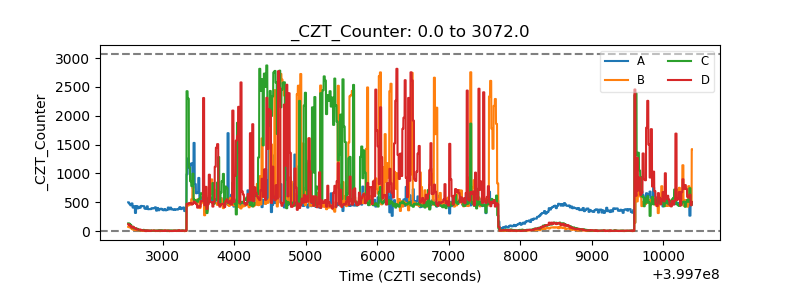 |
| +2.5 Volts monitor | 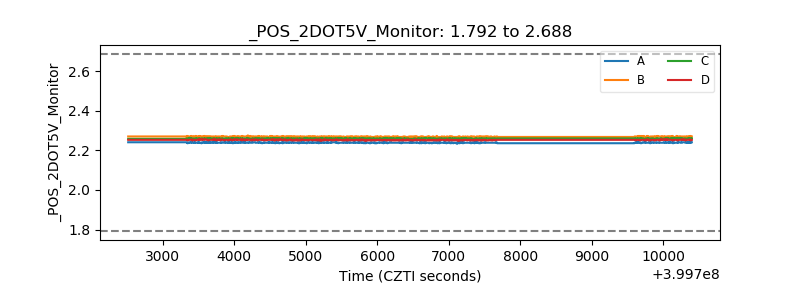 |
| +5 Volts monitor | 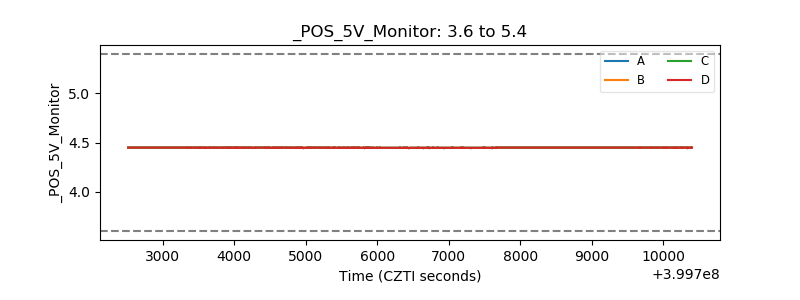 |
| _ROLL_ROT | 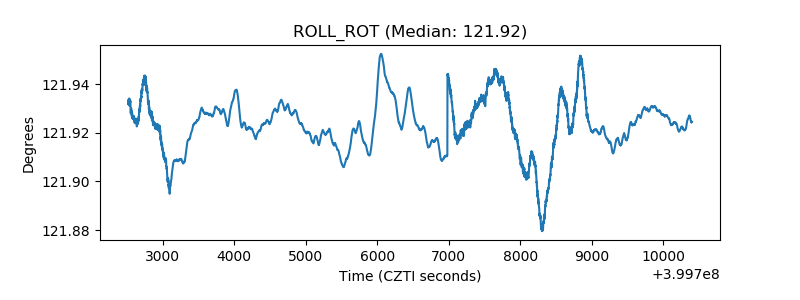 |
| _Roll_DEC | 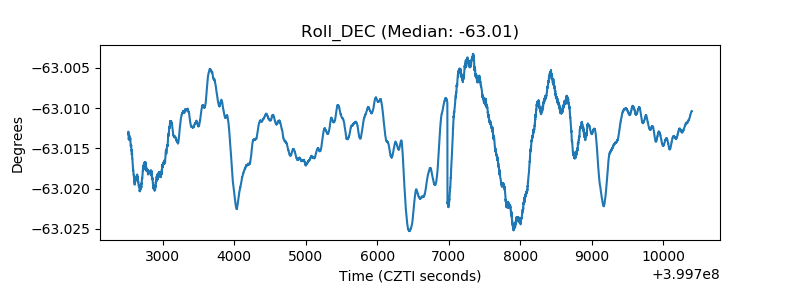 |
| _Roll_RA | 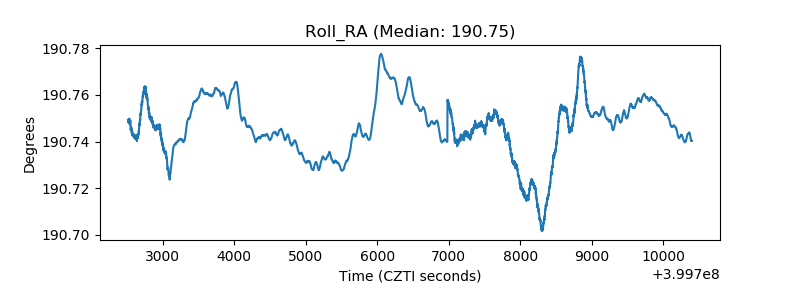 |
| Veto Counter | 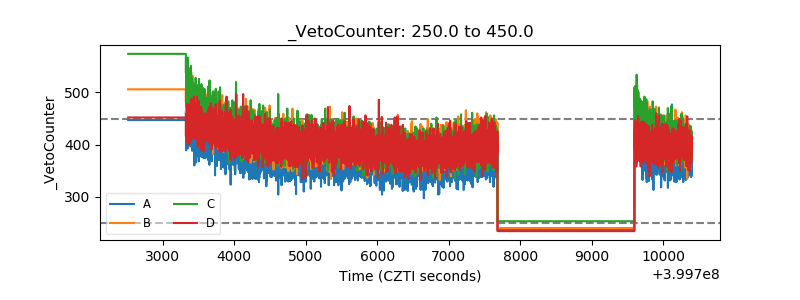 |