| Param | Original file | Final file |
|---|---|---|
| Filename | modeM0/AS1A09_002T01_9000005322_37452cztM0_level2.evt | modeM0/AS1A09_002T01_9000005322_37452cztM0_level2_quad_clean.evt |
| Size (bytes) | 551,511,360 | 89,049,600 |
| Size | 526.0 MB | 84.9 MB |
| Events in quadrant A | 3,647,930 | 598,072 |
| Events in quadrant B | 5,531,943 | 516,630 |
| Events in quadrant C | 2,804,352 | 620,025 |
| Events in quadrant D | 4,340,206 | 571,043 |
| Mode M0 | |||
|---|---|---|---|
| Quadrant | BADHDUFLAG | Total packets | Discarded packets |
| A | 0 | 14272 | 3 |
| B | 0 | 20061 | 2 |
| C | 0 | 11678 | 2 |
| D | 0 | 16643 | 2 |
| Mode M9 | |||
|---|---|---|---|
| Quadrant | BADHDUFLAG | Total packets | Discarded packets |
| A | 0 | 16 | 0 |
| B | 0 | 16 | 0 |
| C | 0 | 16 | 0 |
| D | 0 | 16 | 0 |
| Mode SS | |||
|---|---|---|---|
| Quadrant | BADHDUFLAG | Total packets | Discarded packets |
| A | 0 | 114 | 0 |
| B | 0 | 114 | 0 |
| C | 0 | 114 | 0 |
| D | 0 | 114 | 0 |
| Quadrant | Total seconds | Saturated seconds | Saturation percentage |
|---|---|---|---|
| A | 5579 | 34 | 0.609428% |
| B | 5579 | 1126 | 20.182828% |
| C | 5579 | 33 | 0.591504% |
| D | 5580 | 292 | 5.232975% |
Noise dominated data is calculated using 1-second bins in cleaned event files. If a bin has >2000 counts, and if more than 50% of those come from <1% of pixels, then it is considered to be noise-dominated and hence unusable.
| Quadrant | # 1 sec bins | Bins with >0 counts | Bins with >2000 counts | High rate bins dominated by noise | Noise dominated (total time) | Noise dominated (detector-on time) | Marked lightcurve |
|---|---|---|---|---|---|---|---|
| A | 7132 | 5580 | 8 | 8 | 0.11% | 0.14% | 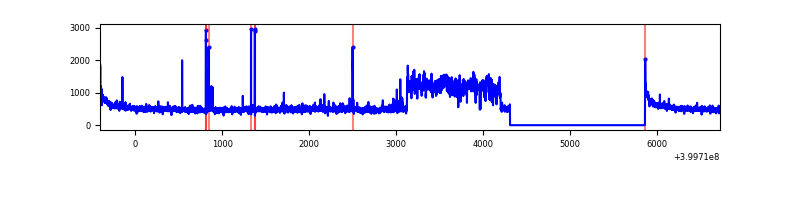 |
| B | 7132 | 5580 | 1054 | 1054 | 14.78% | 18.89% | 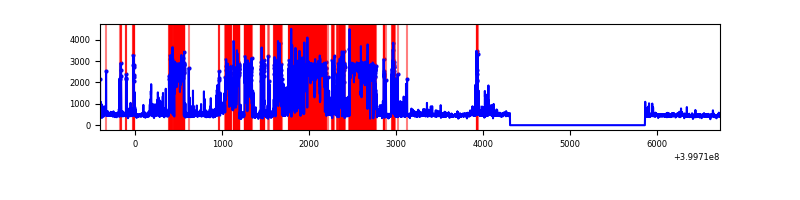 |
| C | 7132 | 5580 | 21 | 21 | 0.29% | 0.38% | 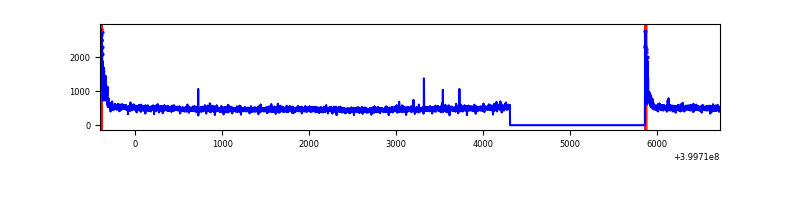 |
| D | 7133 | 5581 | 252 | 252 | 3.53% | 4.52% | 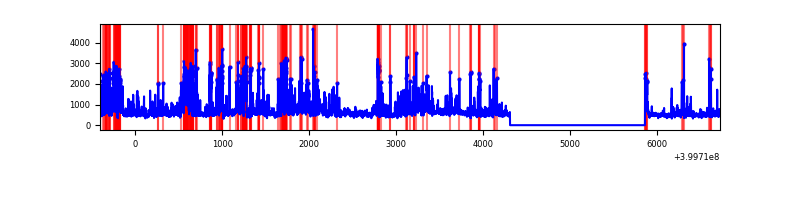 |
Top three noisy pixels from each quadrant. If the there are fewer than three noisy pixels in the level2.evt file, extra rows are filled as -1
| Pixel properties | Quadrant properties | ||||||
|---|---|---|---|---|---|---|---|
| Quadrant | DetID | PixID | Counts | Sigma | Mean | Median | Sigma |
| A | 6 | 10 | 796723 | 6292.52 | 630 | 617 | 126.5 |
| A | 10 | 83 | 287011 | 2263.69 | 630 | 617 | 126.5 |
| A | 15 | 222 | 44164 | 344.2 | 630 | 617 | 126.5 |
| B | 15 | 35 | 2986596 | 27962.88 | 555 | 540 | 106.8 |
| B | 4 | 171 | 184856 | 1726.02 | 555 | 540 | 106.8 |
| B | 5 | 172 | 88366 | 822.45 | 555 | 540 | 106.8 |
| C | 15 | 214 | 240018 | 1658.71 | 620 | 623 | 144.3 |
| C | 0 | 10 | 135534 | 934.76 | 620 | 623 | 144.3 |
| C | 15 | 159 | 5743 | 35.48 | 620 | 623 | 144.3 |
| D | 13 | 249 | 612588 | 4123.82 | 610 | 593 | 148.4 |
| D | 12 | 227 | 451210 | 3036.4 | 610 | 593 | 148.4 |
| D | 2 | 249 | 244945 | 1646.52 | 610 | 593 | 148.4 |
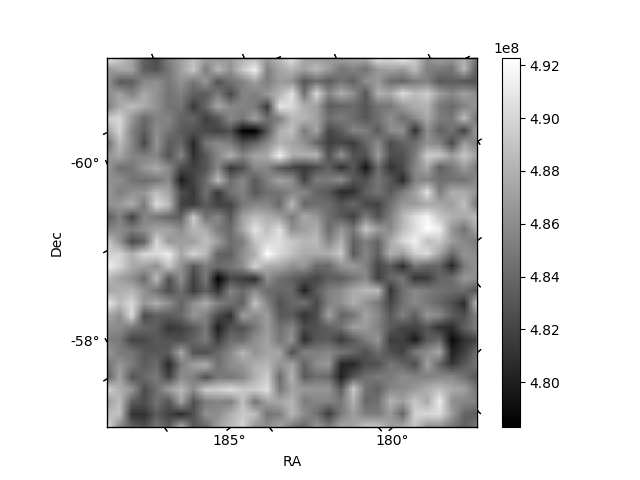
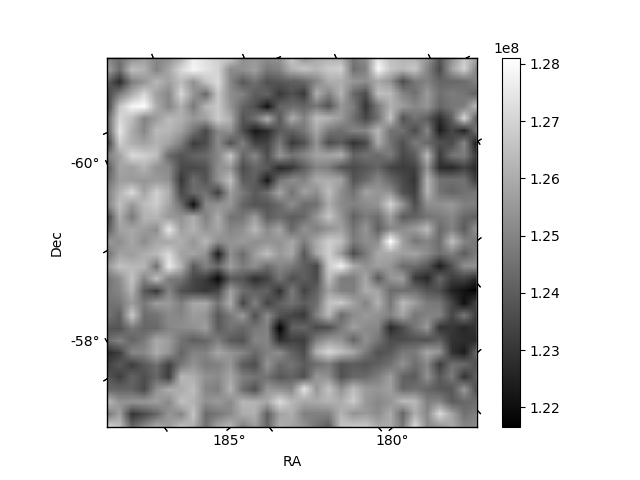
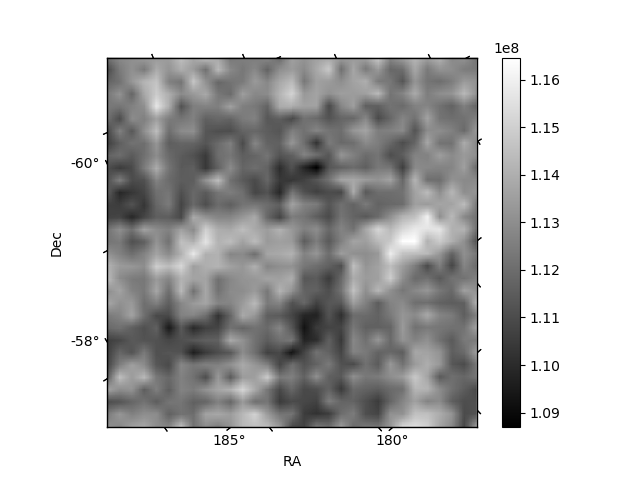
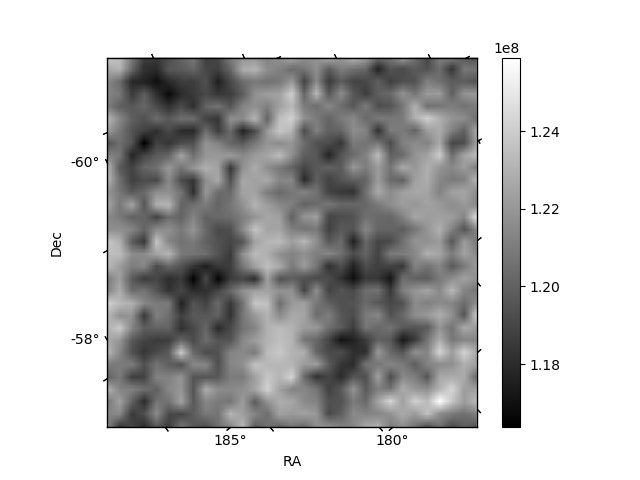
Histogram calculated using DETX and DETY for each event in the final _common_clean file
| Quadrant A | 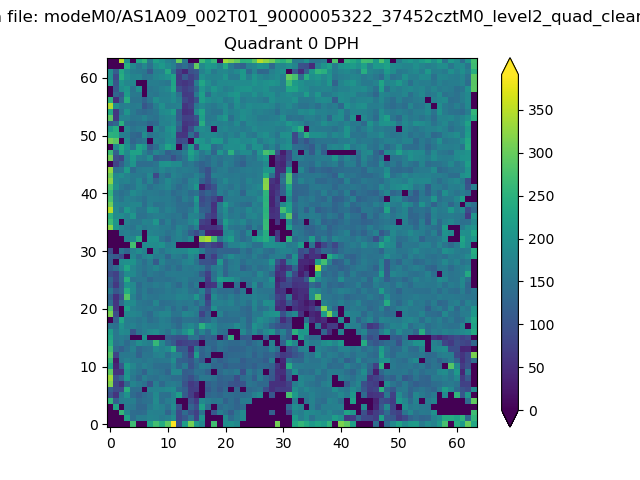 |
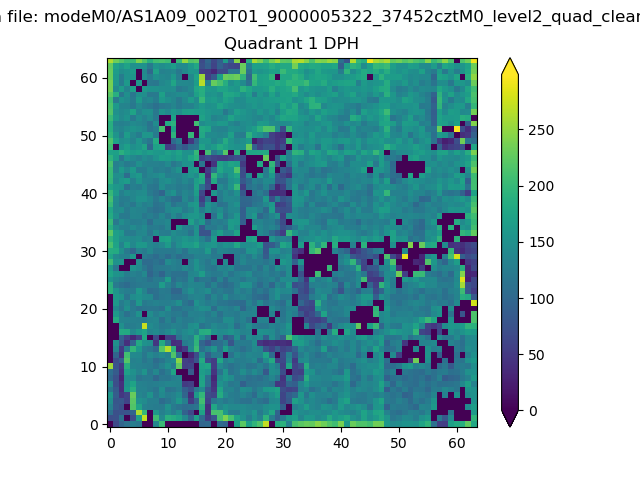 |
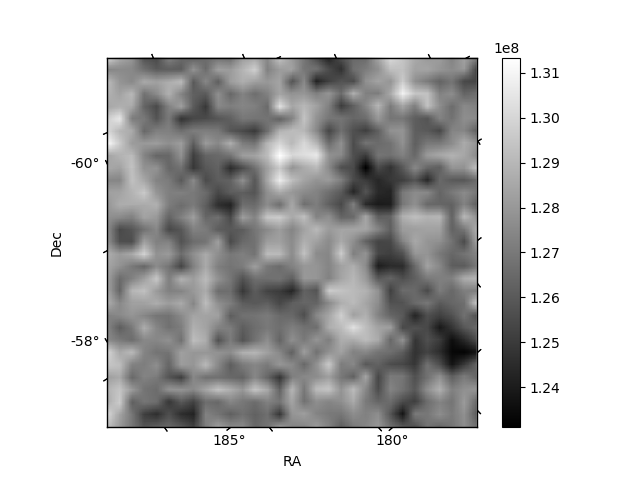
Quadrant B |
|---|---|---|---|
| Quadrant D | 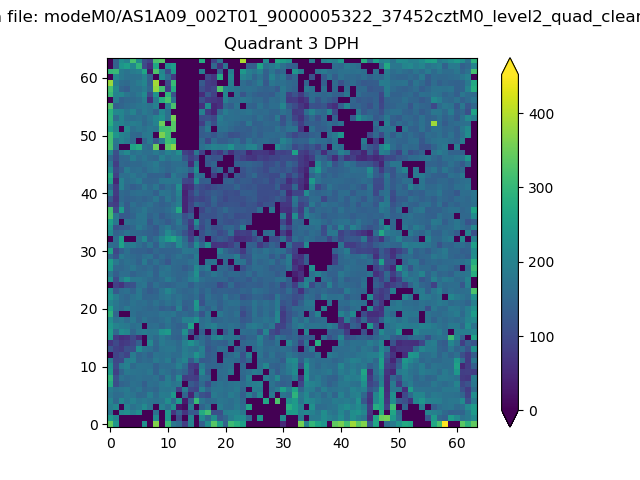 |
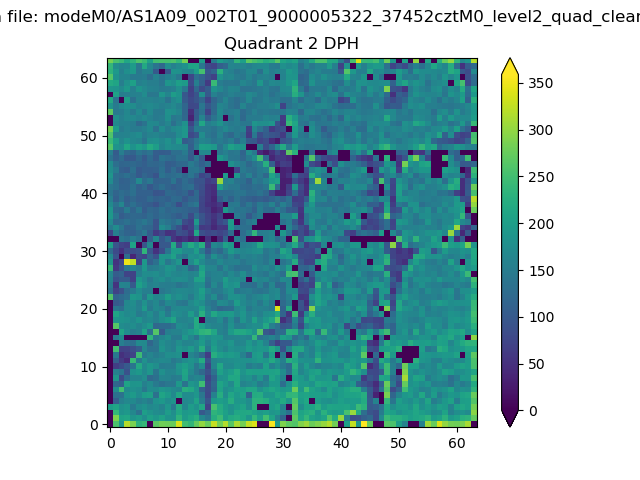 |
Quadrant C |
| Plot type | Count rate plots | Images |
|---|---|---|
| Comparison with Poisson distribution Blue bars denote a histogram of data divided into 1 sec bins. Red curve is a Poisson curve with rate = median count rate of data. |
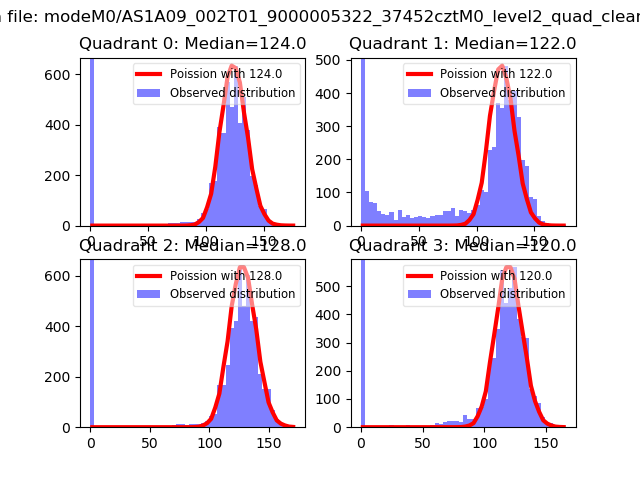 |
 |
| Quadrant-wise count rates Data is divided into 100 sec bins |
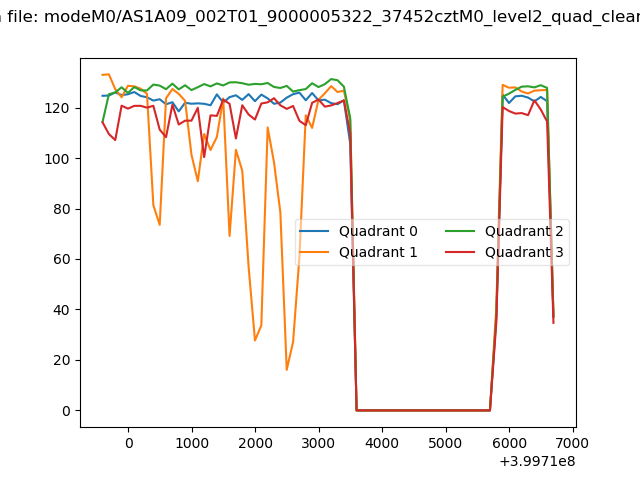 |
|
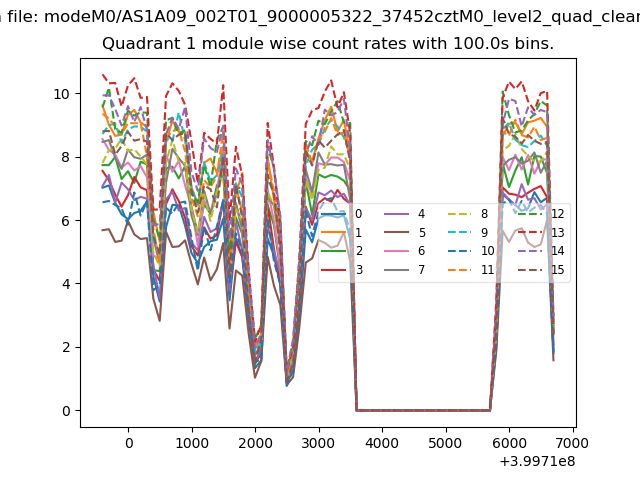
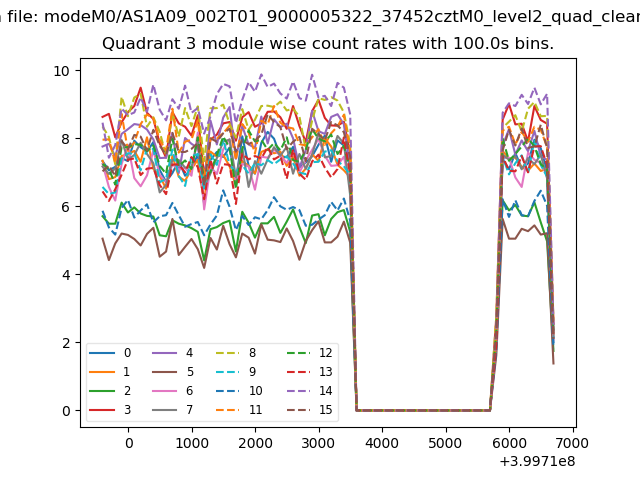
| Module-wise count rates for Quadrant A Data is divided into 100 sec bins |
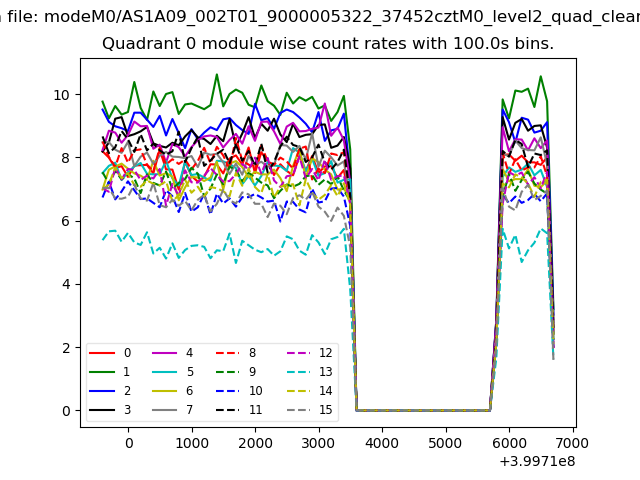 |
 |
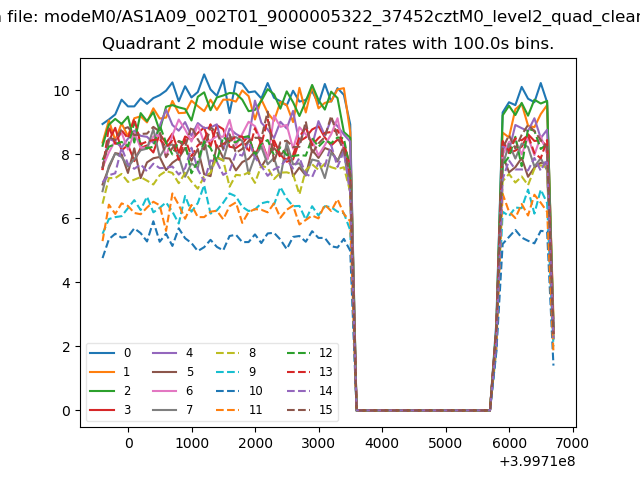
| Module-wise count rates for Quadrant B Data is divided into 100 sec bins |
 |
 |
| Module-wise count rates for Quadrant C Data is divided into 100 sec bins |
 |
 |
| Module-wise count rates for Quadrant D Data is divided into 100 sec bins |
 |
 |
| Parameter | Plot |
|---|---|
| CZT HV Monitor | 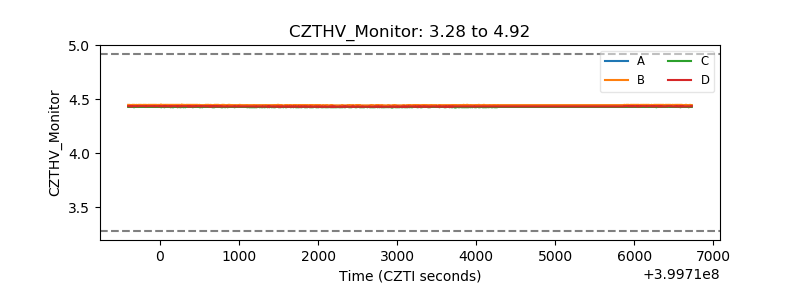 |
| D_VDD | 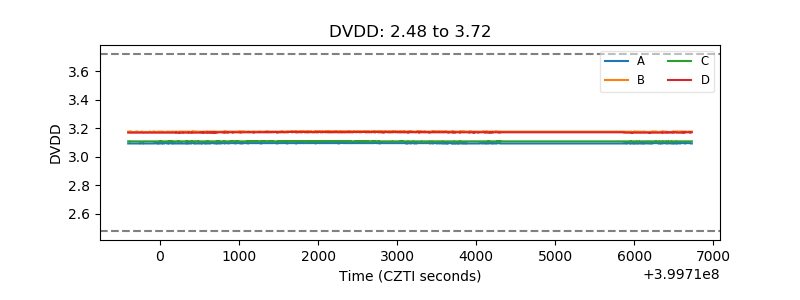 |
| Temperature 1 | 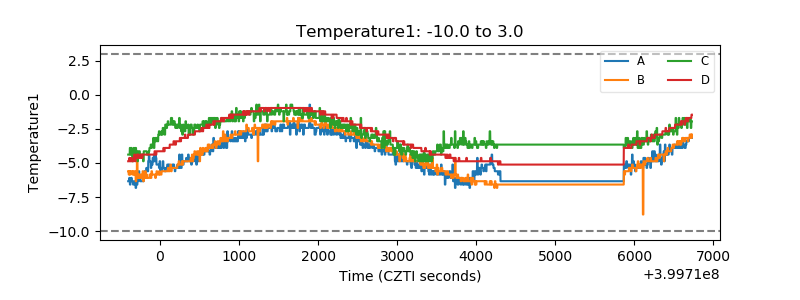 |
| Veto HV Monitor | 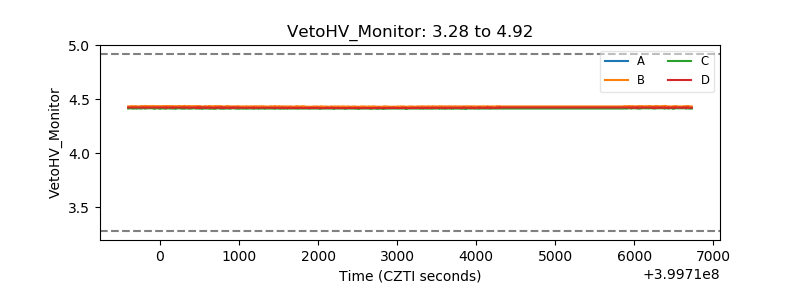 |
| Veto LLD | 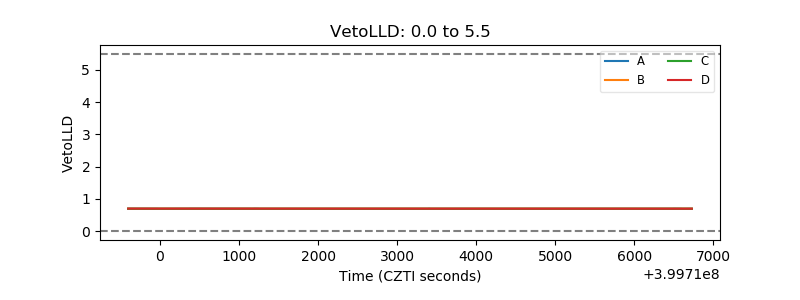 |
| Alpha Counter | 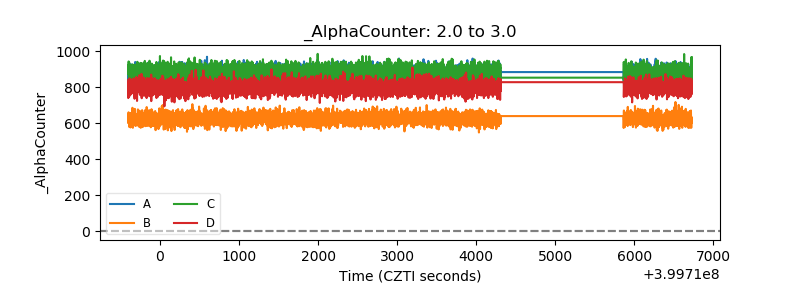 |
| _CPM_Rate | 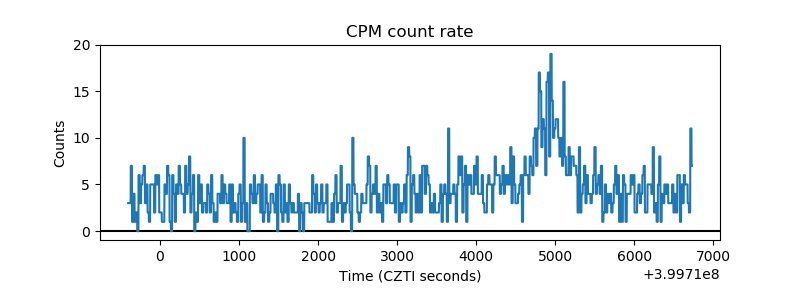 |
| CZT Counter | 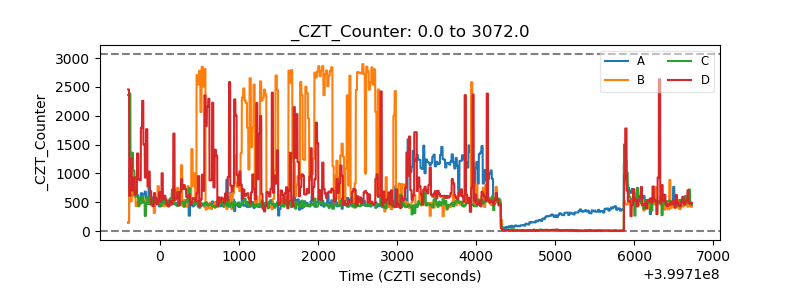 |
| +2.5 Volts monitor | 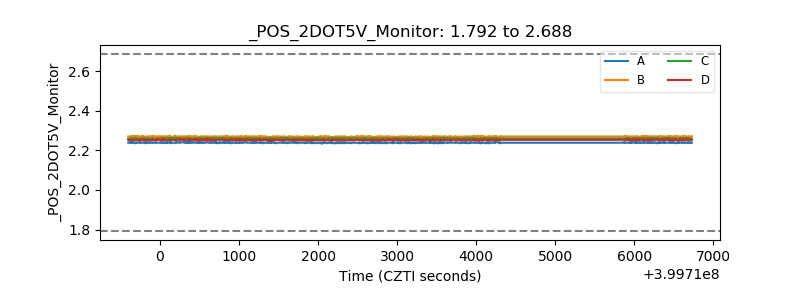 |
| +5 Volts monitor | 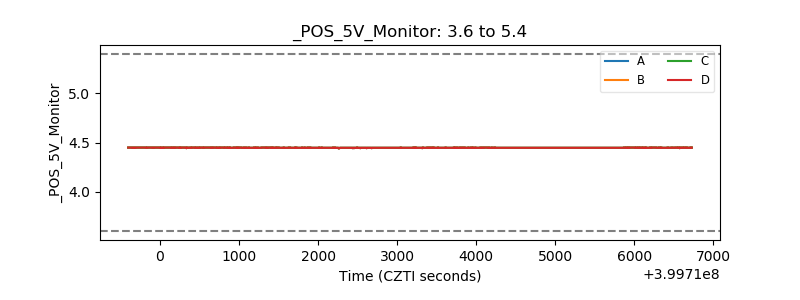 |
| _ROLL_ROT | 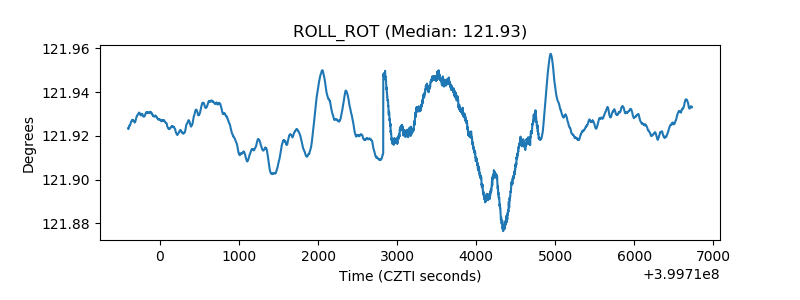 |
| _Roll_DEC | 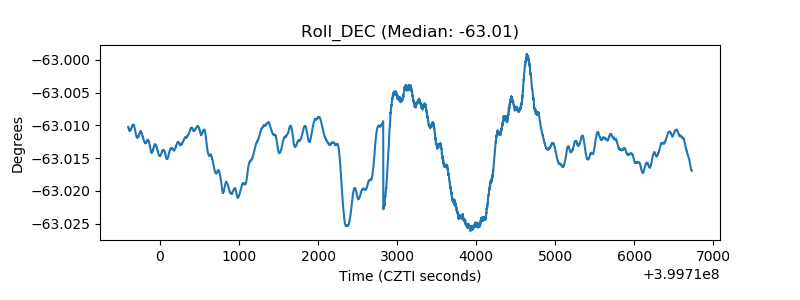 |
| _Roll_RA | 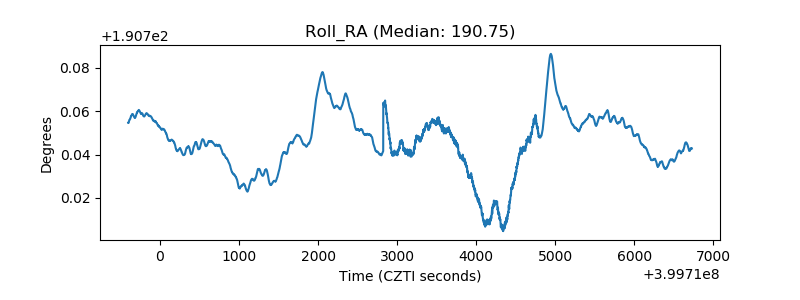 |
| Veto Counter | 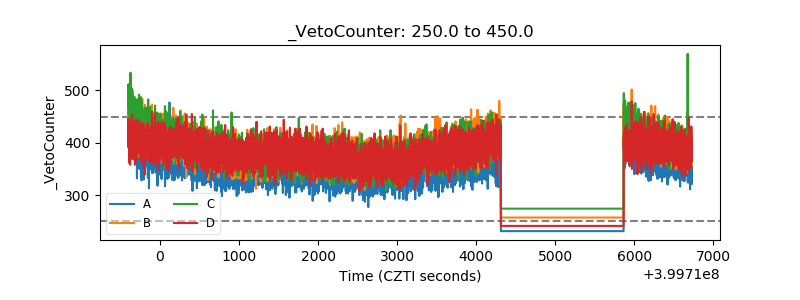 |