| Param | Original file | Final file |
|---|---|---|
| Filename | modeM0/AS1A09_002T01_9000005322_37454cztM0_level2.evt | modeM0/AS1A09_002T01_9000005322_37454cztM0_level2_quad_clean.evt |
| Size (bytes) | 555,834,240 | 84,346,560 |
| Size | 530.1 MB | 80.4 MB |
| Events in quadrant A | 3,148,571 | 538,785 |
| Events in quadrant B | 4,018,155 | 536,764 |
| Events in quadrant C | 3,010,232 | 556,866 |
| Events in quadrant D | 6,254,468 | 506,562 |
| Mode M0 | |||
|---|---|---|---|
| Quadrant | BADHDUFLAG | Total packets | Discarded packets |
| A | 0 | 12997 | 3 |
| B | 0 | 15870 | 2 |
| C | 0 | 12595 | 3 |
| D | 0 | 22694 | 2 |
| Mode M9 | |||
|---|---|---|---|
| Quadrant | BADHDUFLAG | Total packets | Discarded packets |
| A | 0 | 16 | 0 |
| B | 0 | 16 | 0 |
| C | 0 | 16 | 0 |
| D | 0 | 17 | 0 |
| Mode SS | |||
|---|---|---|---|
| Quadrant | BADHDUFLAG | Total packets | Discarded packets |
| A | 0 | 120 | 0 |
| B | 0 | 120 | 0 |
| C | 0 | 120 | 0 |
| D | 0 | 120 | 0 |
| Quadrant | Total seconds | Saturated seconds | Saturation percentage |
|---|---|---|---|
| A | 5945 | 30 | 0.504626% |
| B | 5945 | 261 | 4.390244% |
| C | 5944 | 40 | 0.672948% |
| D | 5945 | 435 | 7.317073% |
Noise dominated data is calculated using 1-second bins in cleaned event files. If a bin has >2000 counts, and if more than 50% of those come from <1% of pixels, then it is considered to be noise-dominated and hence unusable.
| Quadrant | # 1 sec bins | Bins with >0 counts | Bins with >2000 counts | High rate bins dominated by noise | Noise dominated (total time) | Noise dominated (detector-on time) | Marked lightcurve |
|---|---|---|---|---|---|---|---|
| A | 7259 | 5945 | 23 | 23 | 0.32% | 0.39% | 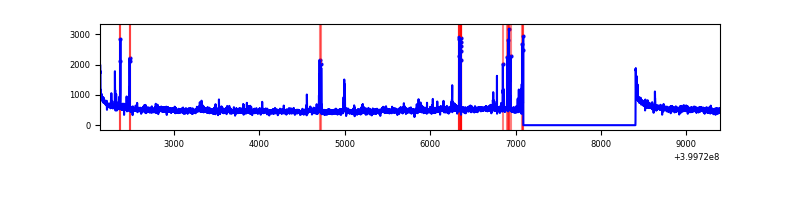 |
| B | 7259 | 5946 | 152 | 152 | 2.09% | 2.56% | 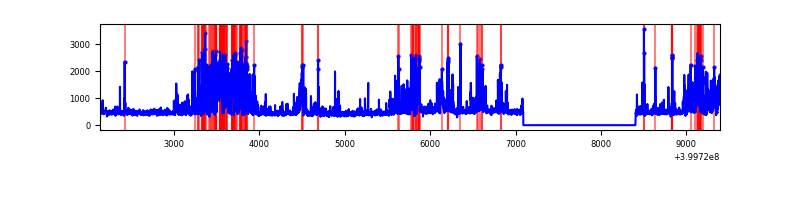 |
| C | 7259 | 5946 | 37 | 37 | 0.51% | 0.62% | 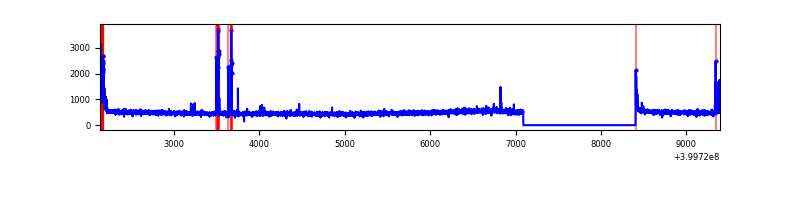 |
| D | 7259 | 5946 | 420 | 420 | 5.79% | 7.06% |  |
Top three noisy pixels from each quadrant. If the there are fewer than three noisy pixels in the level2.evt file, extra rows are filled as -1
| Pixel properties | Quadrant properties | ||||||
|---|---|---|---|---|---|---|---|
| Quadrant | DetID | PixID | Counts | Sigma | Mean | Median | Sigma |
| A | 10 | 83 | 304570 | 2227.67 | 671 | 657 | 136.4 |
| A | 13 | 248 | 135537 | 988.66 | 671 | 657 | 136.4 |
| A | 12 | 189 | 38281 | 275.78 | 671 | 657 | 136.4 |
| B | 4 | 171 | 991643 | 7871.21 | 658 | 640 | 125.9 |
| B | 0 | 189 | 180443 | 1428.12 | 658 | 640 | 125.9 |
| B | 4 | 232 | 71191 | 560.36 | 658 | 640 | 125.9 |
| C | 15 | 214 | 252194 | 1643.41 | 657 | 661 | 153.1 |
| C | 0 | 10 | 101020 | 655.7 | 657 | 661 | 153.1 |
| C | 14 | 254 | 93361 | 605.66 | 657 | 661 | 153.1 |
| D | 12 | 227 | 2106042 | 13472.46 | 641 | 623 | 156.3 |
| D | 2 | 249 | 457939 | 2926.34 | 641 | 623 | 156.3 |
| D | 13 | 249 | 404969 | 2587.39 | 641 | 623 | 156.3 |
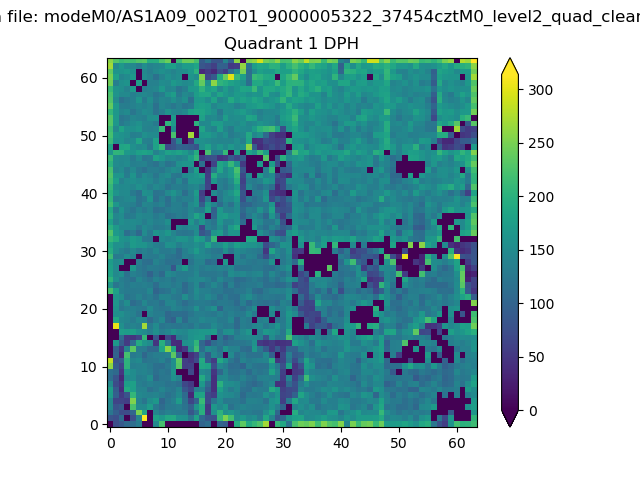
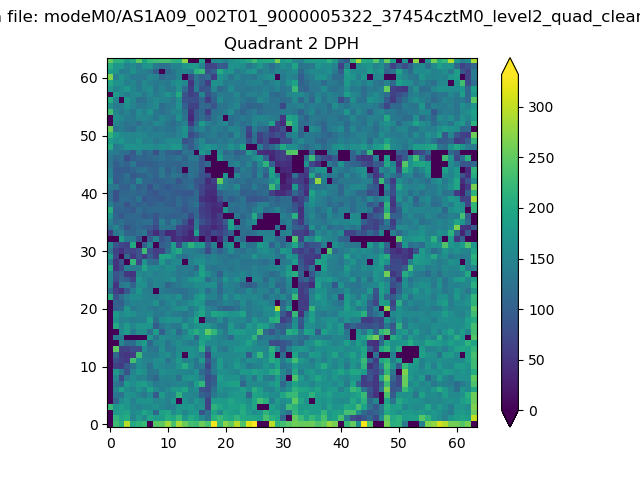
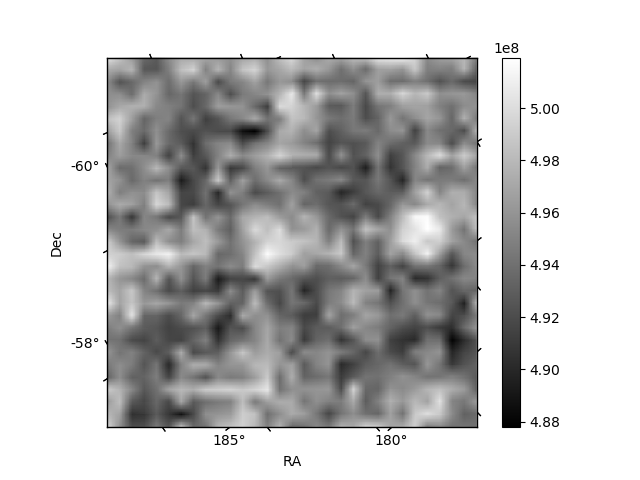
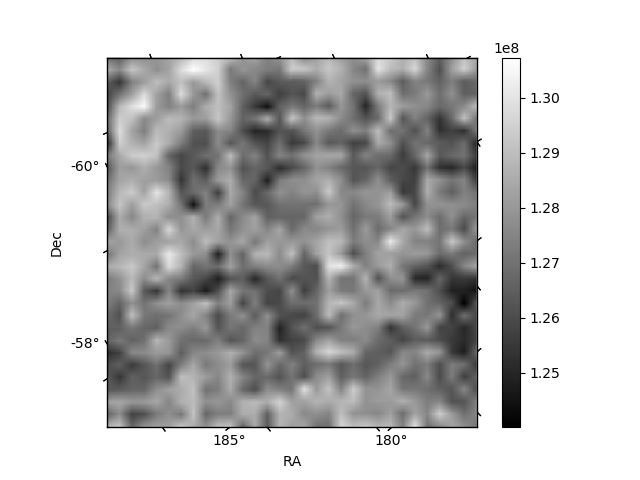
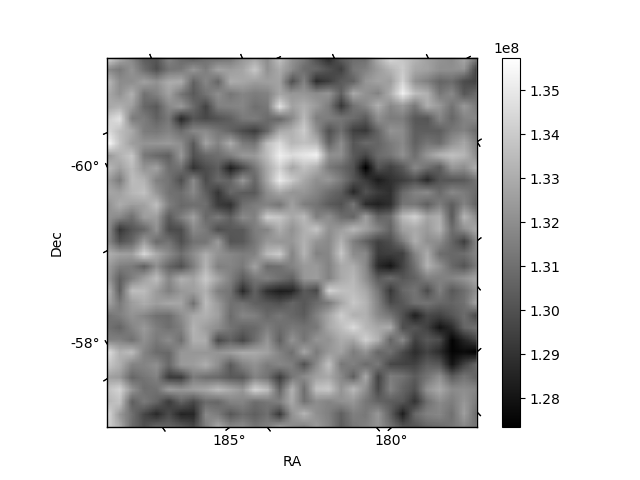
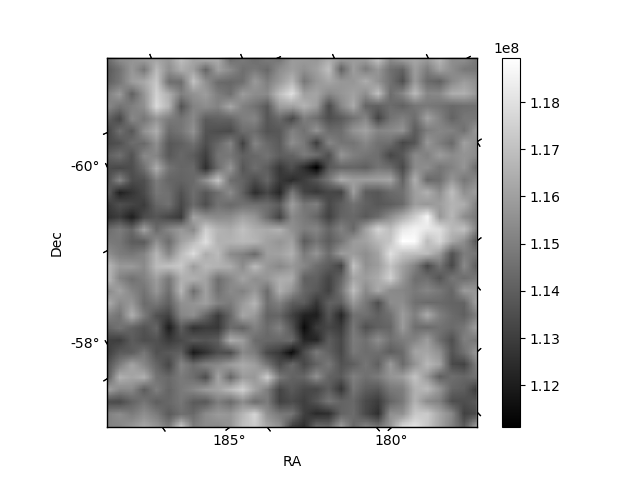
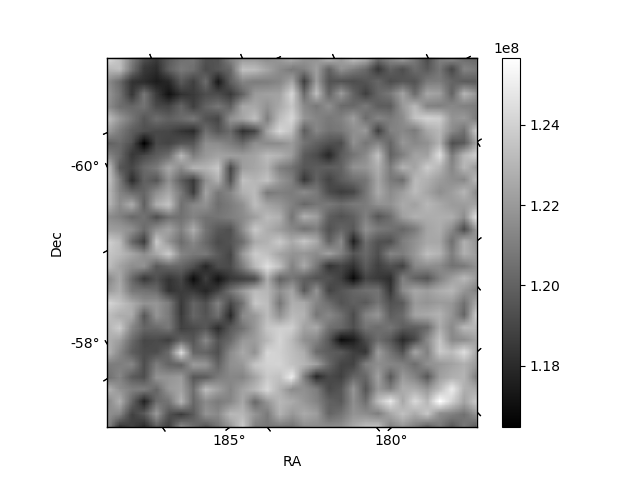
Histogram calculated using DETX and DETY for each event in the final _common_clean file
| Quadrant A | 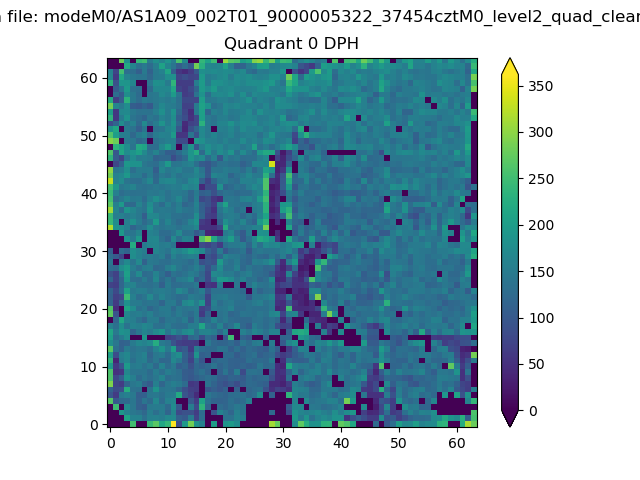 |
 |
Quadrant B |
|---|---|---|---|
| Quadrant D | 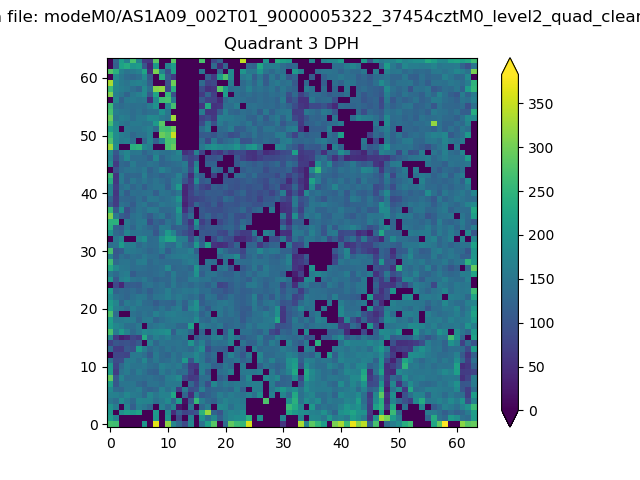 |
 |
Quadrant C |
| Plot type | Count rate plots | Images |
|---|---|---|
| Comparison with Poisson distribution Blue bars denote a histogram of data divided into 1 sec bins. Red curve is a Poisson curve with rate = median count rate of data. |
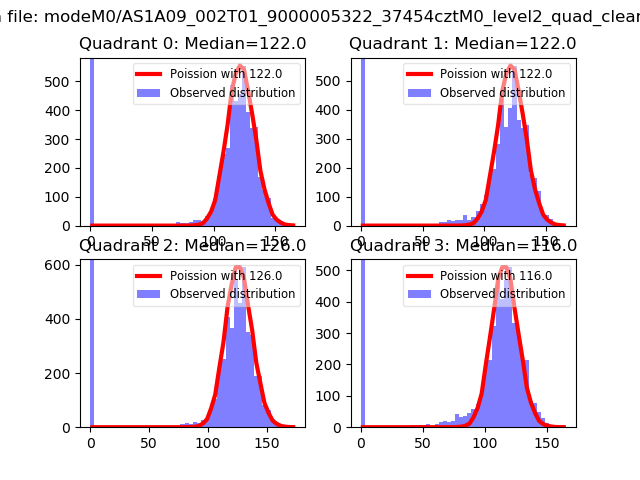 |
 |
| Quadrant-wise count rates Data is divided into 100 sec bins |
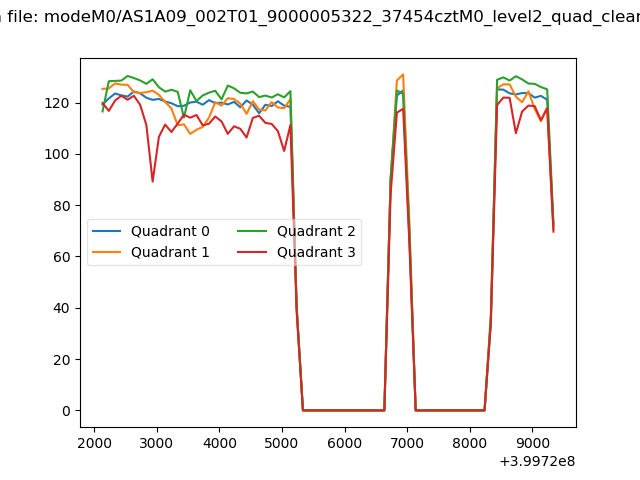 |
|
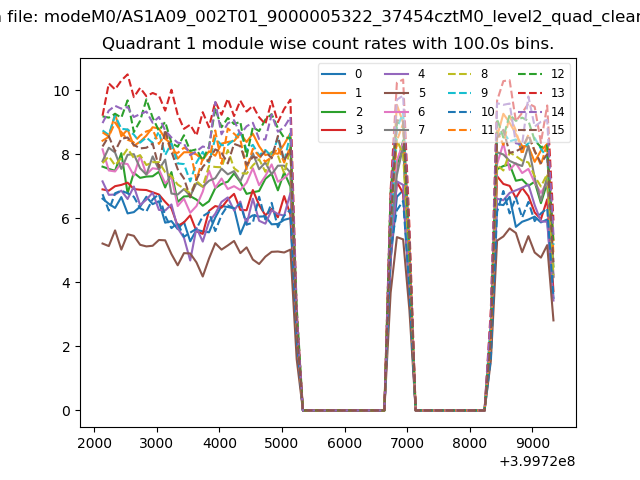
| Module-wise count rates for Quadrant A Data is divided into 100 sec bins |
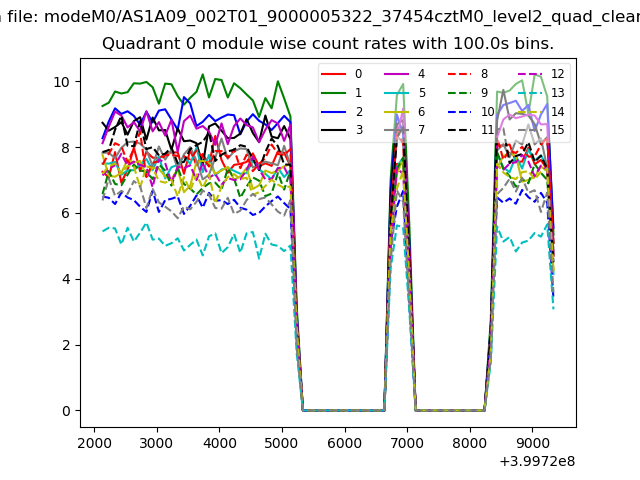 |
 |
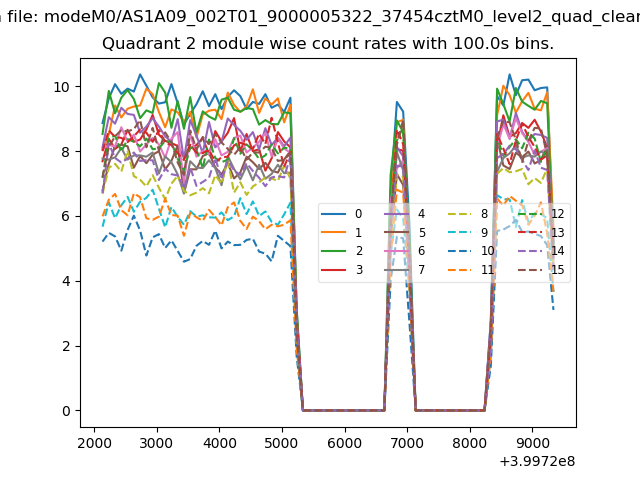
| Module-wise count rates for Quadrant B Data is divided into 100 sec bins |
 |
 |
| Module-wise count rates for Quadrant C Data is divided into 100 sec bins |
 |
 |
| Module-wise count rates for Quadrant D Data is divided into 100 sec bins |
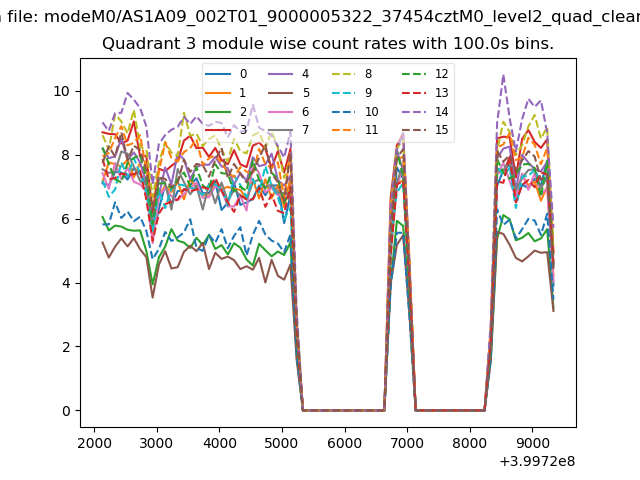 |
 |
| Parameter | Plot |
|---|---|
| CZT HV Monitor |  |
| D_VDD | 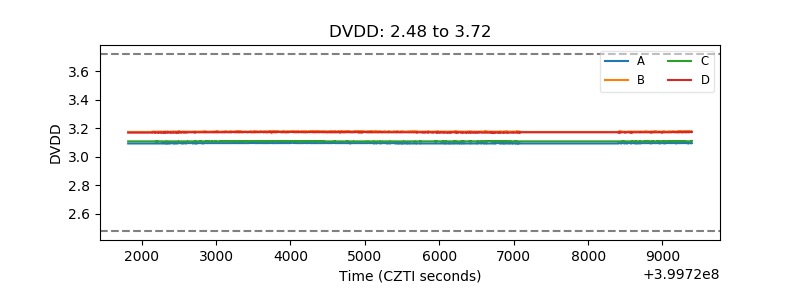 |
| Temperature 1 | 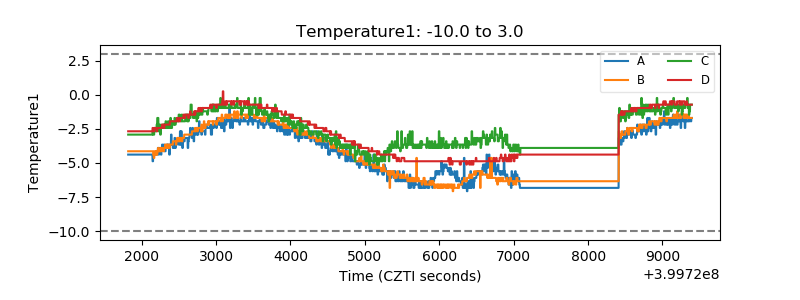 |
| Veto HV Monitor | 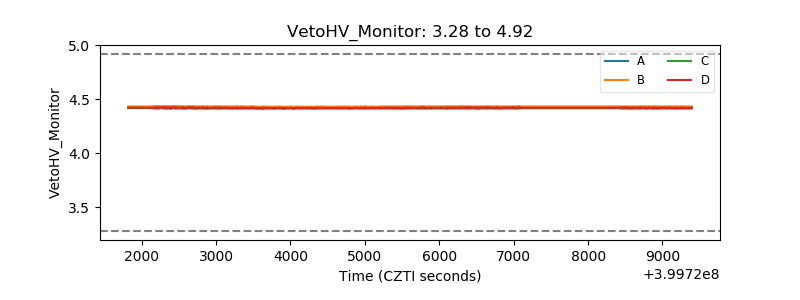 |
| Veto LLD | 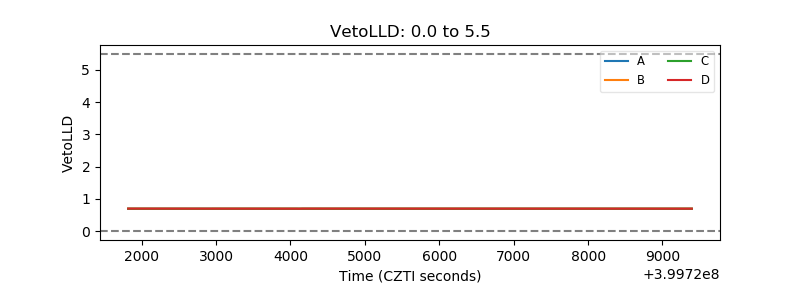 |
| Alpha Counter | 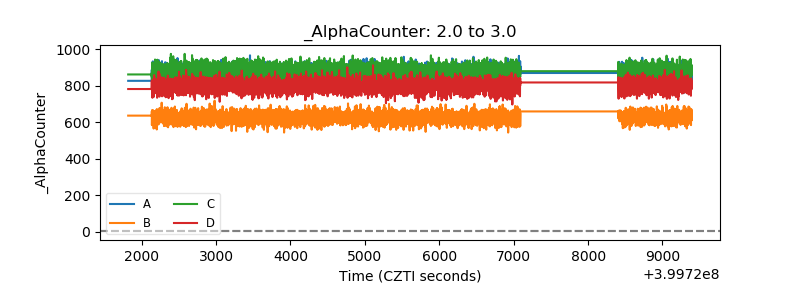 |
| _CPM_Rate | 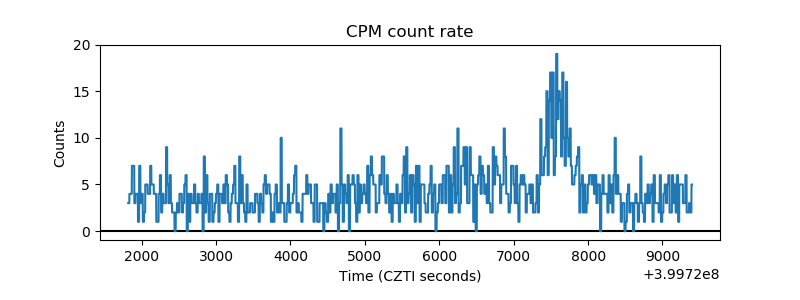 |
| CZT Counter | 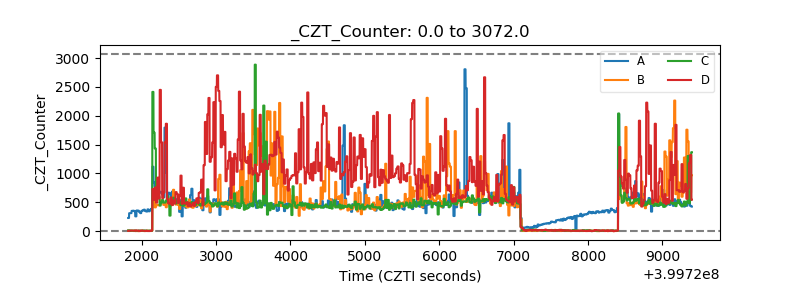 |
| +2.5 Volts monitor | 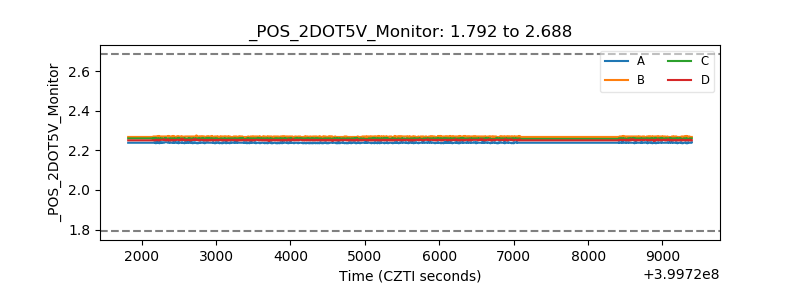 |
| +5 Volts monitor | 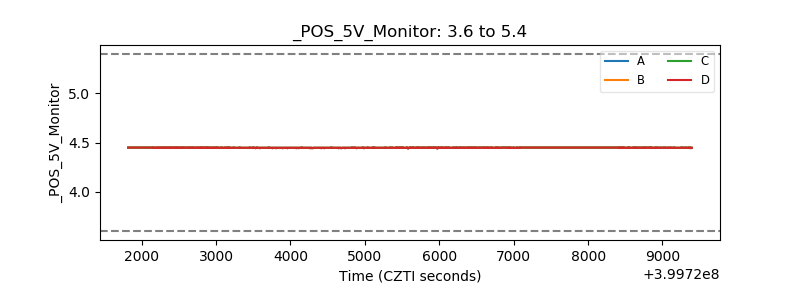 |
| _ROLL_ROT | 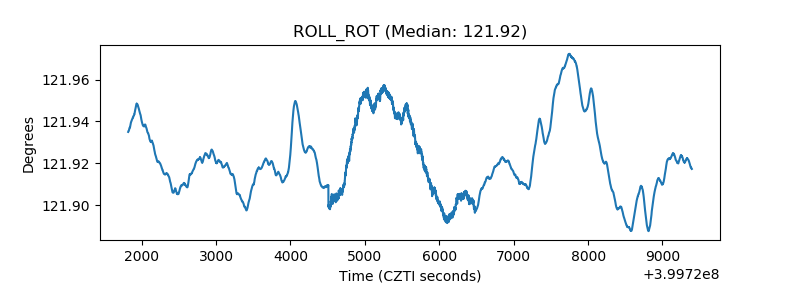 |
| _Roll_DEC | 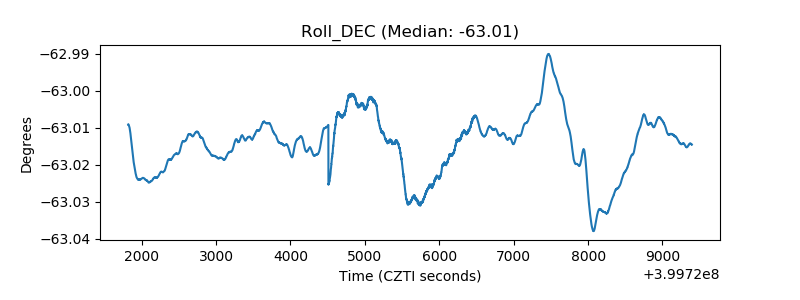 |
| _Roll_RA | 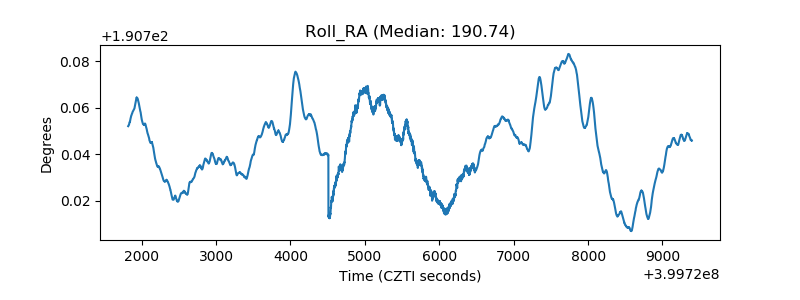 |
| Veto Counter | 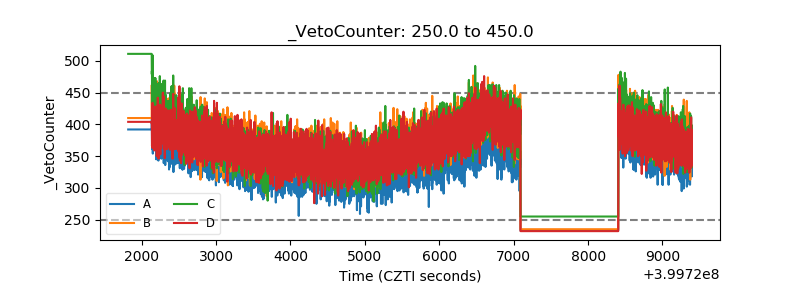 |