| Param | Original file | Final file |
|---|---|---|
| Filename | modeM0/AS1A09_002T01_9000005322_37456cztM0_level2.evt | modeM0/AS1A09_002T01_9000005322_37456cztM0_level2_quad_clean.evt |
| Size (bytes) | 393,471,360 | 57,456,000 |
| Size | 375.2 MB | 54.8 MB |
| Events in quadrant A | 2,471,259 | 360,320 |
| Events in quadrant B | 2,961,783 | 357,657 |
| Events in quadrant C | 2,414,674 | 370,543 |
| Events in quadrant D | 3,762,883 | 334,915 |
| Mode M0 | |||
|---|---|---|---|
| Quadrant | BADHDUFLAG | Total packets | Discarded packets |
| A | 0 | 10187 | 1 |
| B | 0 | 11856 | 1 |
| C | 0 | 10024 | 1 |
| D | 0 | 14316 | 1 |
| Mode SS | |||
|---|---|---|---|
| Quadrant | BADHDUFLAG | Total packets | Discarded packets |
| A | 0 | 90 | 0 |
| B | 0 | 90 | 0 |
| C | 0 | 90 | 0 |
| D | 0 | 90 | 0 |
| Quadrant | Total seconds | Saturated seconds | Saturation percentage |
|---|---|---|---|
| A | 4493 | 67 | 1.491209% |
| B | 4493 | 143 | 3.182729% |
| C | 4493 | 47 | 1.046072% |
| D | 4494 | 375 | 8.344459% |
Noise dominated data is calculated using 1-second bins in cleaned event files. If a bin has >2000 counts, and if more than 50% of those come from <1% of pixels, then it is considered to be noise-dominated and hence unusable.
| Quadrant | # 1 sec bins | Bins with >0 counts | Bins with >2000 counts | High rate bins dominated by noise | Noise dominated (total time) | Noise dominated (detector-on time) | Marked lightcurve |
|---|---|---|---|---|---|---|---|
| A | 4493 | 4493 | 55 | 55 | 1.22% | 1.22% | 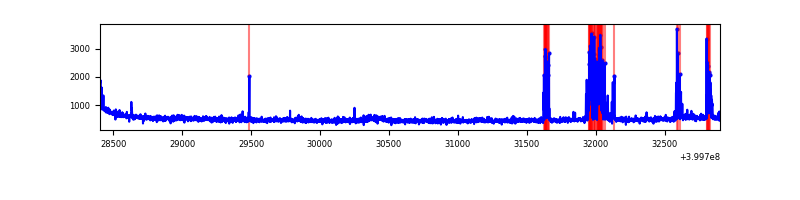 |
| B | 4493 | 4493 | 79 | 79 | 1.76% | 1.76% | 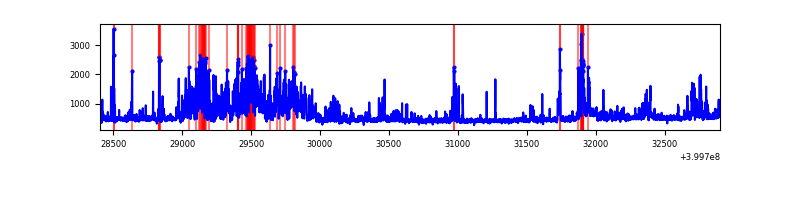 |
| C | 4493 | 4493 | 32 | 32 | 0.71% | 0.71% | 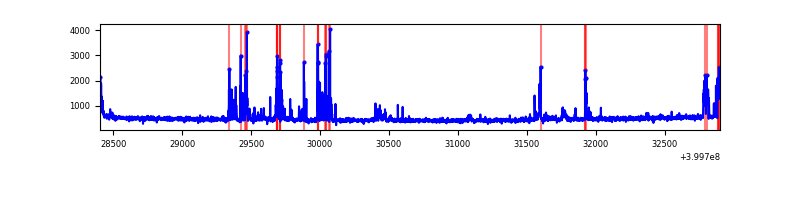 |
| D | 4494 | 4494 | 330 | 330 | 7.34% | 7.34% | 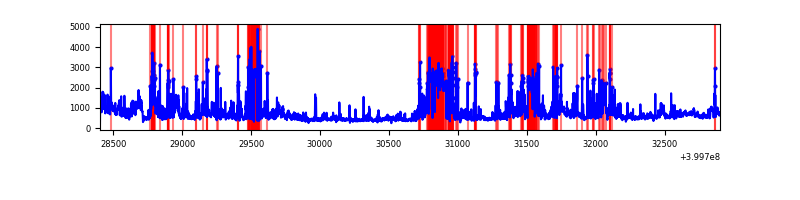 |
Top three noisy pixels from each quadrant. If the there are fewer than three noisy pixels in the level2.evt file, extra rows are filled as -1
| Pixel properties | Quadrant properties | ||||||
|---|---|---|---|---|---|---|---|
| Quadrant | DetID | PixID | Counts | Sigma | Mean | Median | Sigma |
| A | 13 | 248 | 275645 | 2719.42 | 496 | 487 | 101.2 |
| A | 10 | 83 | 201476 | 1986.4 | 496 | 487 | 101.2 |
| A | 12 | 189 | 26407 | 256.17 | 496 | 487 | 101.2 |
| B | 4 | 171 | 719229 | 7528.76 | 491 | 478 | 95.5 |
| B | 0 | 189 | 115053 | 1200.15 | 491 | 478 | 95.5 |
| B | 5 | 172 | 43600 | 451.69 | 491 | 478 | 95.5 |
| C | 14 | 254 | 298063 | 2630.29 | 484 | 488 | 113.1 |
| C | 15 | 214 | 189423 | 1670.01 | 484 | 488 | 113.1 |
| C | 0 | 10 | 20356 | 175.61 | 484 | 488 | 113.1 |
| D | 2 | 152 | 499020 | 4406.35 | 464 | 452 | 113.1 |
| D | 12 | 227 | 461201 | 4072.11 | 464 | 452 | 113.1 |
| D | 2 | 249 | 416239 | 3674.73 | 464 | 452 | 113.1 |
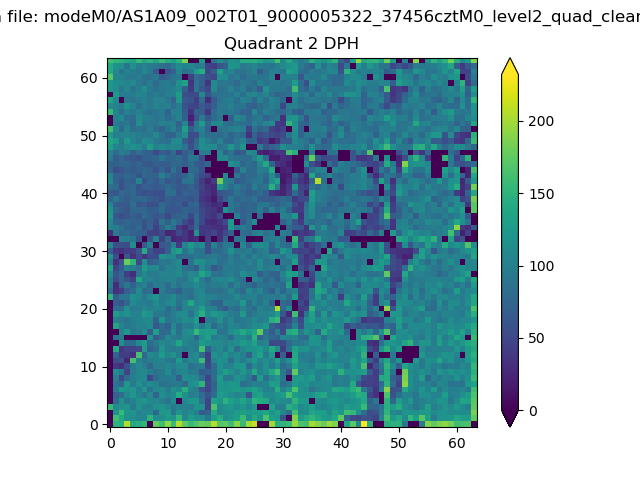
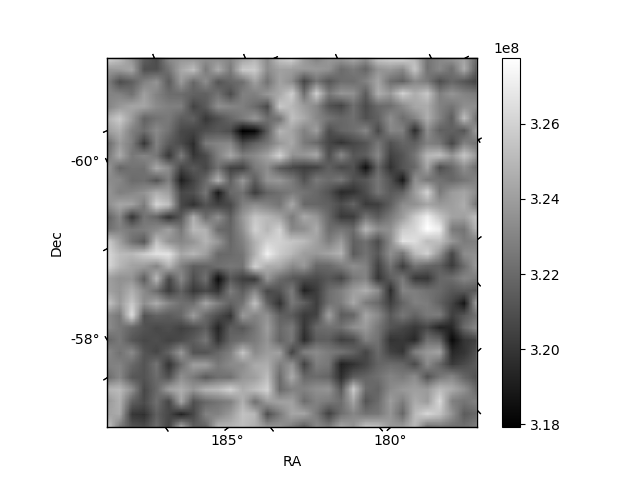
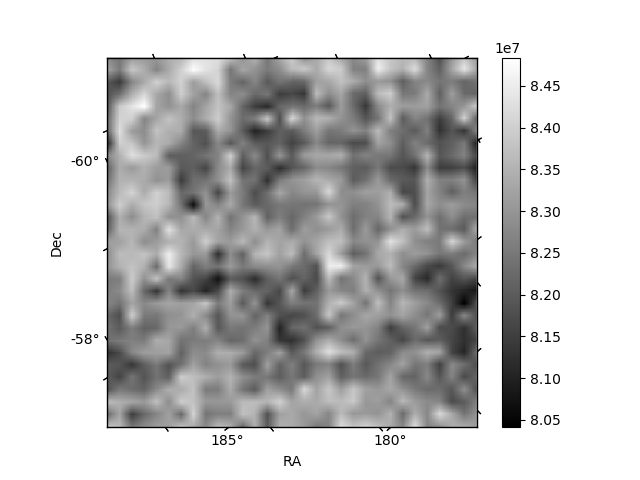
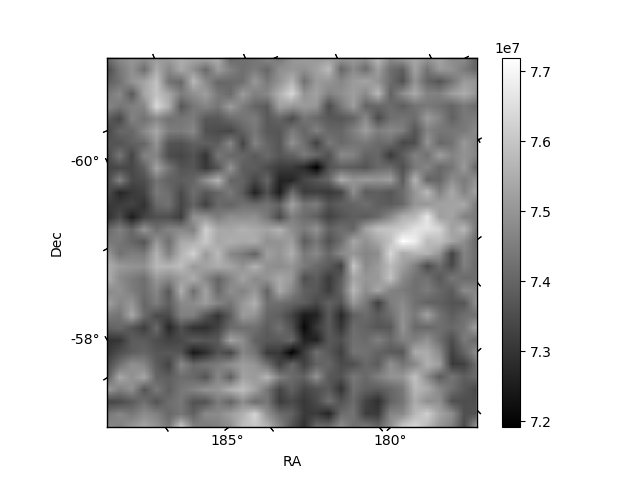
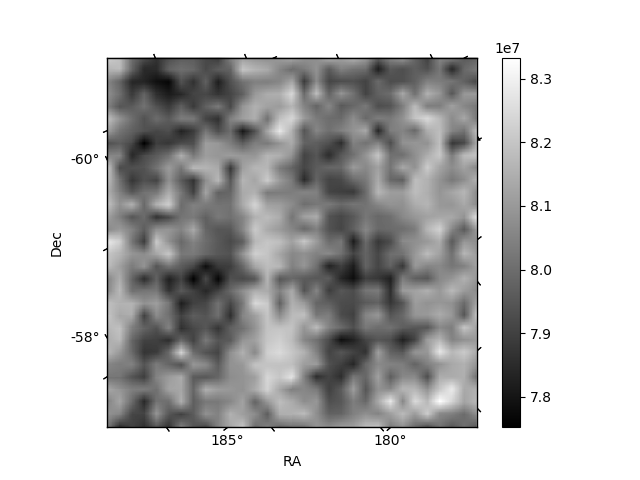
Histogram calculated using DETX and DETY for each event in the final _common_clean file
| Quadrant A | 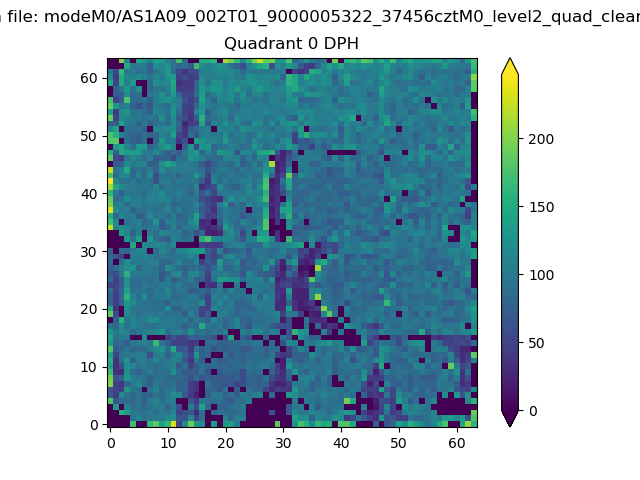 |
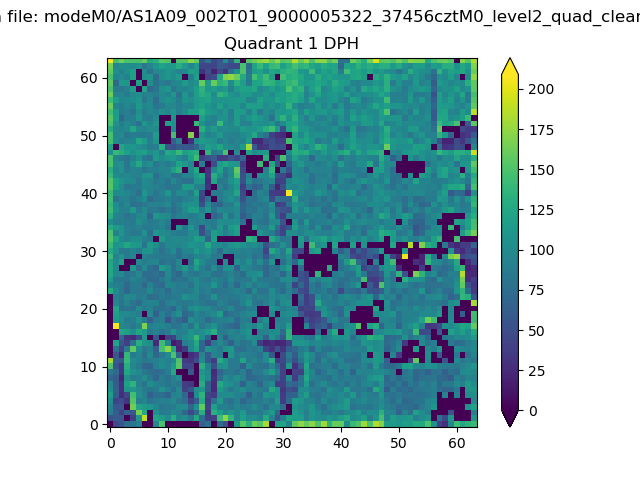 |
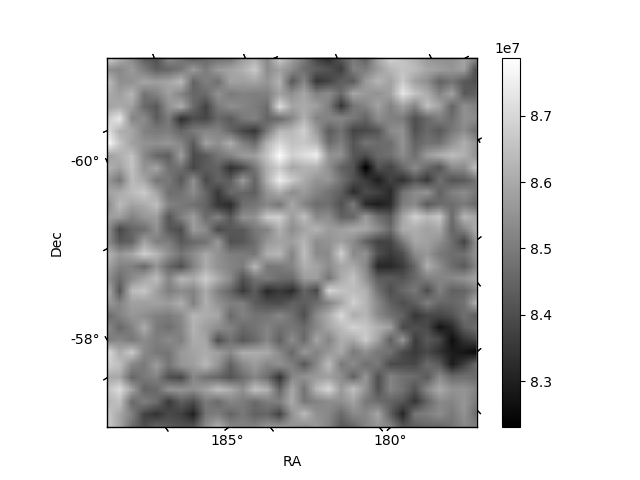
Quadrant B |
|---|---|---|---|
| Quadrant D | 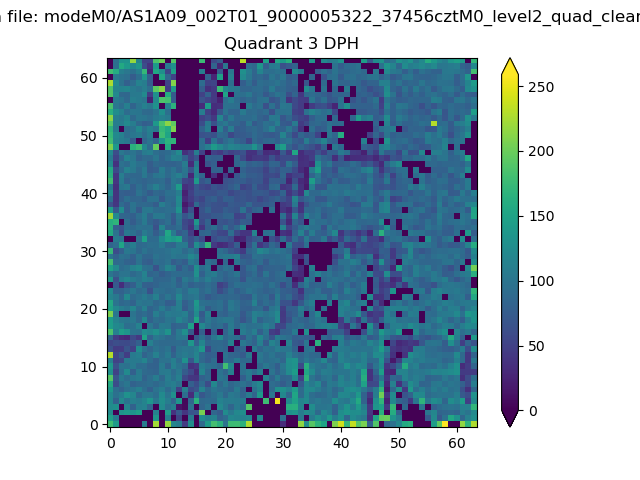 |
 |
Quadrant C |
| Plot type | Count rate plots | Images |
|---|---|---|
| Comparison with Poisson distribution Blue bars denote a histogram of data divided into 1 sec bins. Red curve is a Poisson curve with rate = median count rate of data. |
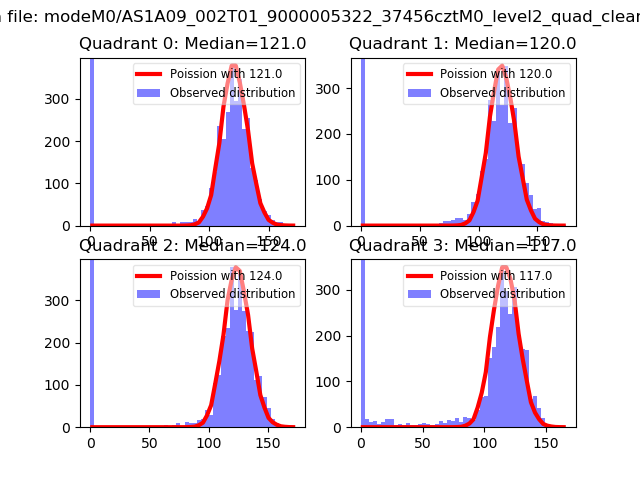 |
 |
| Quadrant-wise count rates Data is divided into 100 sec bins |
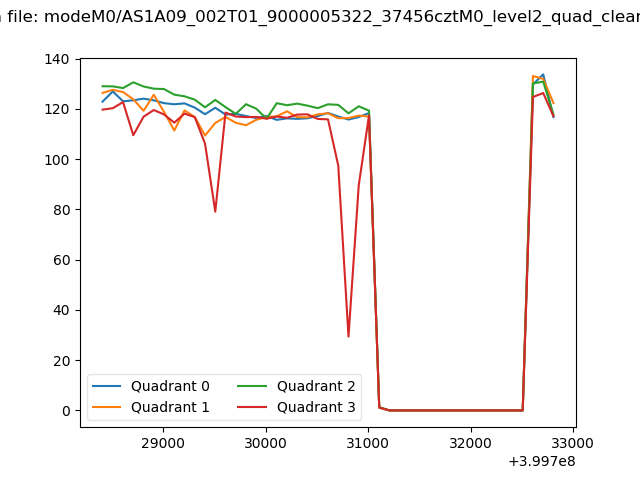 |
|
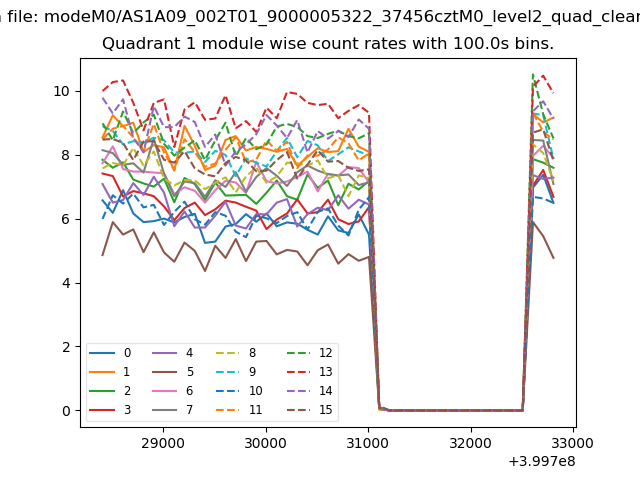
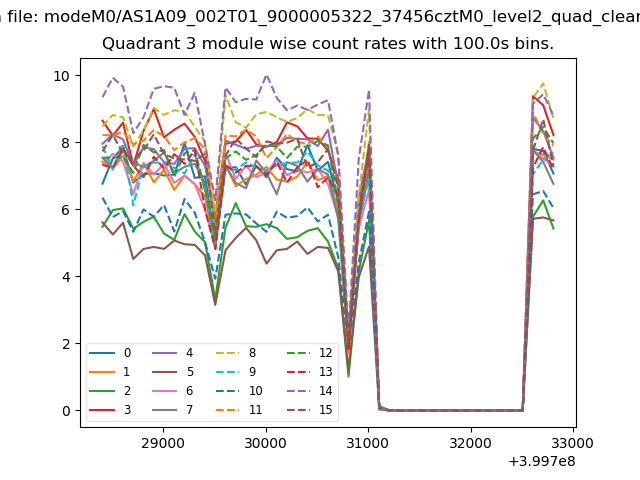
| Module-wise count rates for Quadrant A Data is divided into 100 sec bins |
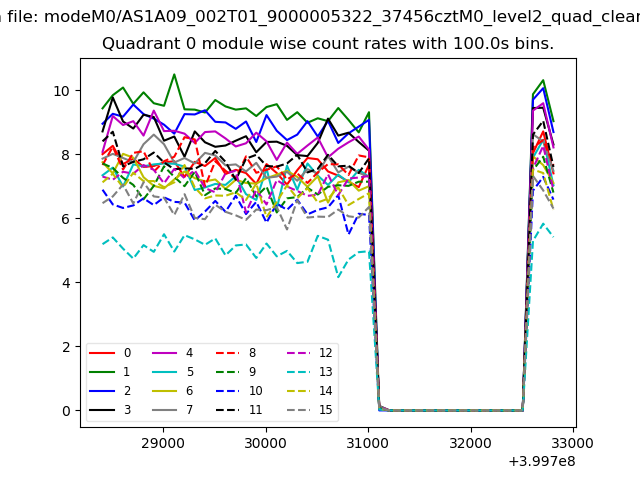 |
 |
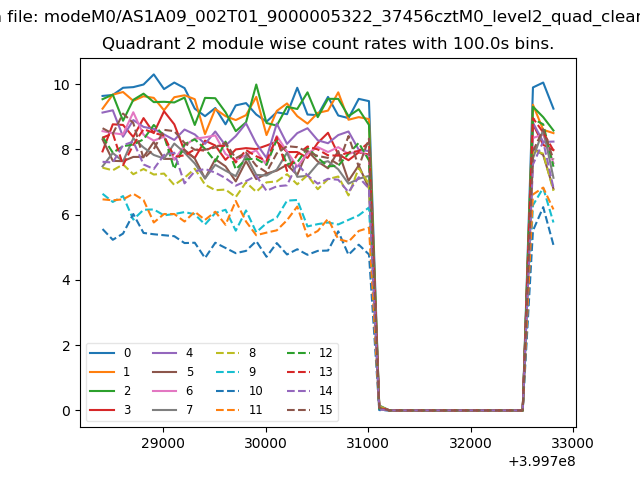
| Module-wise count rates for Quadrant B Data is divided into 100 sec bins |
 |
 |
| Module-wise count rates for Quadrant C Data is divided into 100 sec bins |
 |
 |
| Module-wise count rates for Quadrant D Data is divided into 100 sec bins |
 |
 |
| Parameter | Plot |
|---|---|
| CZT HV Monitor | 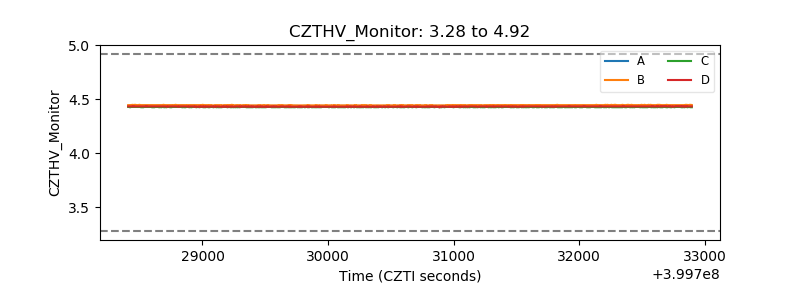 |
| D_VDD | 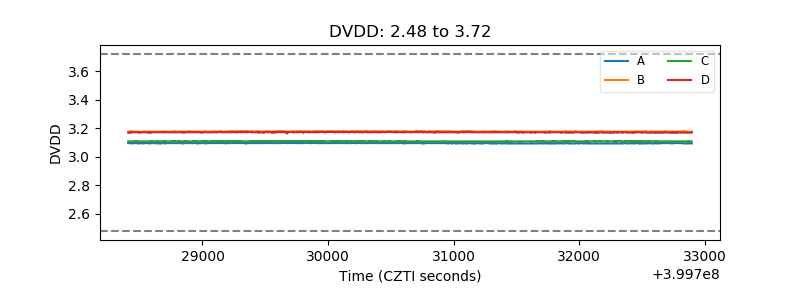 |
| Temperature 1 | 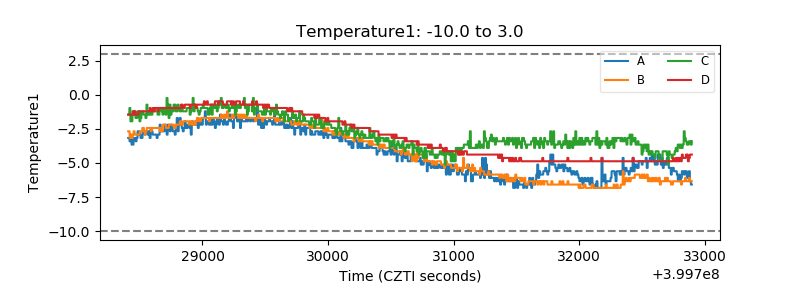 |
| Veto HV Monitor | 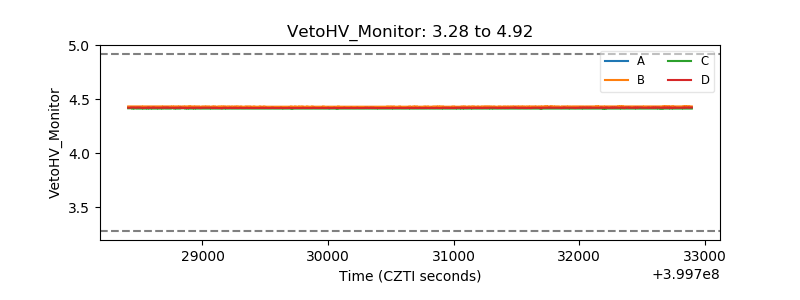 |
| Veto LLD | 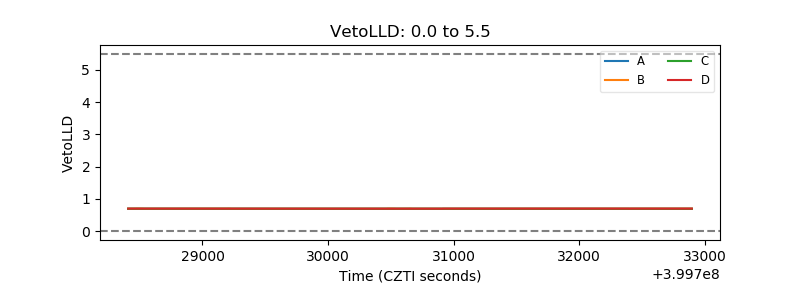 |
| Alpha Counter | 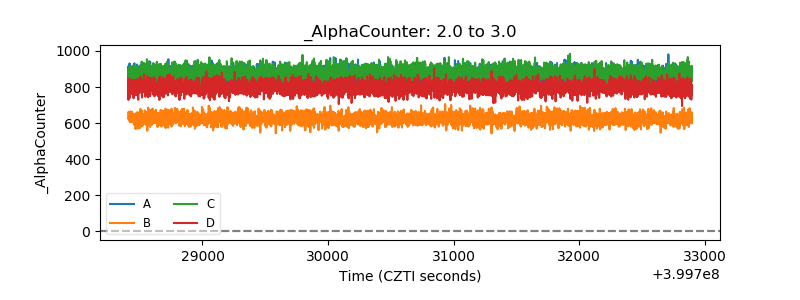 |
| _CPM_Rate | 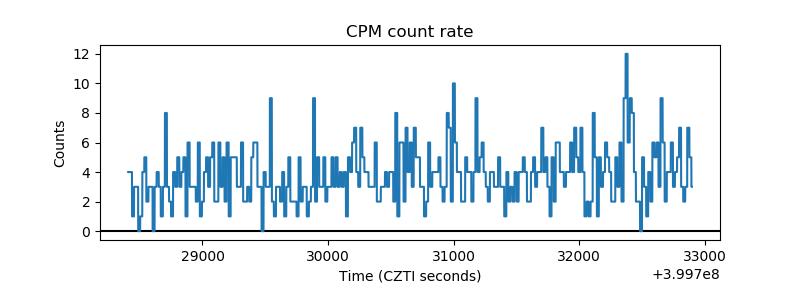 |
| CZT Counter | 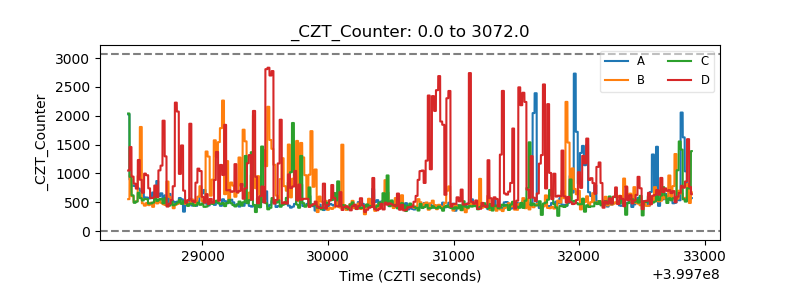 |
| +2.5 Volts monitor | 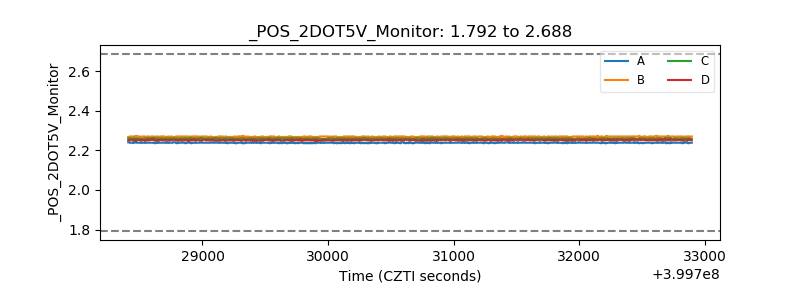 |
| +5 Volts monitor | 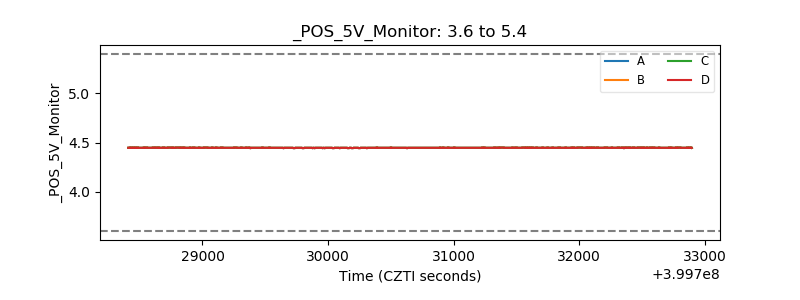 |
| _ROLL_ROT | 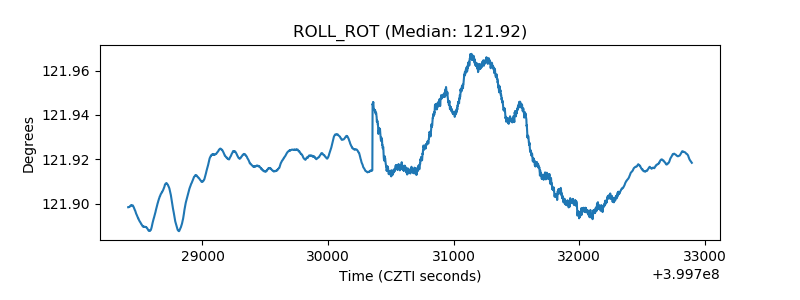 |
| _Roll_DEC | 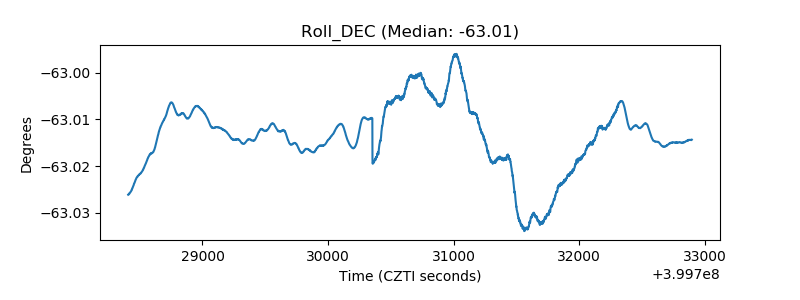 |
| _Roll_RA | 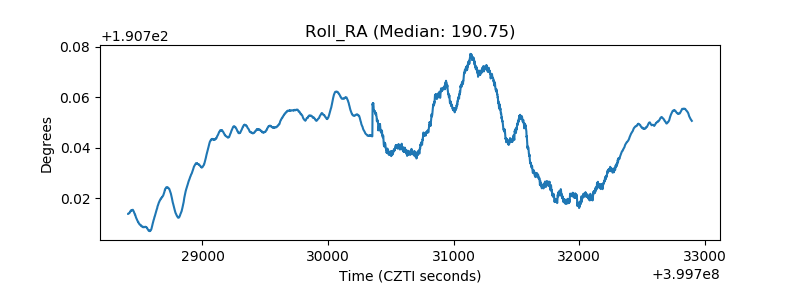 |
| Veto Counter | 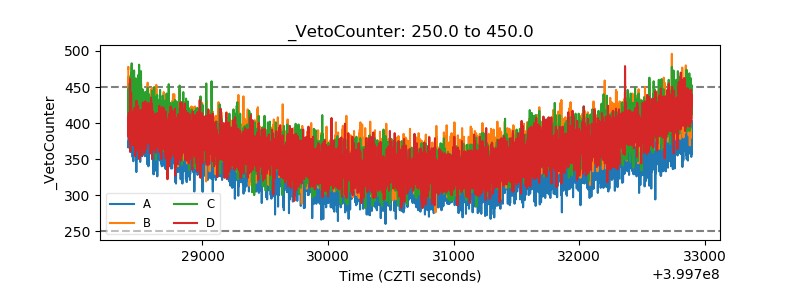 |