| Param | Original file | Final file |
|---|---|---|
| Filename | modeM0/AS1A11_027T01_9000005324cztM0_level2.fits | modeM0/AS1A11_027T01_9000005324cztM0_level2_quad_clean.evt |
| Size (bytes) | 860,633,280 | 1,262,767,680 |
| Size | 820.8 MB | 1.2 GB |
| Events in quadrant A | 5,164,190 | 8,265,694 |
| Events in quadrant B | 5,024,148 | 8,408,081 |
| Events in quadrant C | 5,155,538 | 8,126,053 |
| Events in quadrant D | 4,335,534 | 7,066,971 |
| Mode SS | |||
|---|---|---|---|
| Quadrant | BADHDUFLAG | Total packets | Discarded packets |
| A | 0 | 1902 | 0 |
| B | 0 | 1902 | 0 |
| C | 0 | 1902 | 0 |
| D | 0 | 1902 | 0 |
| Mode M9 | |||
|---|---|---|---|
| Quadrant | BADHDUFLAG | Total packets | Discarded packets |
| A | 0 | 359 | 0 |
| B | 0 | 359 | 0 |
| C | 0 | 359 | 0 |
| D | 0 | 359 | 0 |
| Mode M0 | |||
|---|---|---|---|
| Quadrant | BADHDUFLAG | Total packets | Discarded packets |
| A | 0 | 236143 | 0 |
| B | 0 | 208140 | 0 |
| C | 0 | 209485 | 0 |
| D | 0 | 271320 | 0 |
| Quadrant | Total seconds | Saturated seconds | Saturation percentage |
|---|---|---|---|
| A | 93110 | 563 | 0.604661% |
| B | 93110 | 1281 | 1.375792% |
| C | 93110 | 1645 | 1.766728% |
| D | 93110 | 6075 | 6.524541% |
Noise dominated data is calculated using 1-second bins in cleaned event files. If a bin has >2000 counts, and if more than 50% of those come from <1% of pixels, then it is considered to be noise-dominated and hence unusable.
| Quadrant | # 1 sec bins | Bins with >0 counts | Bins with >2000 counts | High rate bins dominated by noise | Noise dominated (total time) | Noise dominated (detector-on time) | Marked lightcurve |
|---|---|---|---|---|---|---|---|
| A | 127823 | 93108 | 0 | 0 | 0.00% | 0.00% |  |
| B | 127823 | 93085 | 0 | 0 | 0.00% | 0.00% |  |
| C | 127823 | 93073 | 0 | 0 | 0.00% | 0.00% |  |
| D | 127823 | 92833 | 0 | 0 | 0.00% | 0.00% | 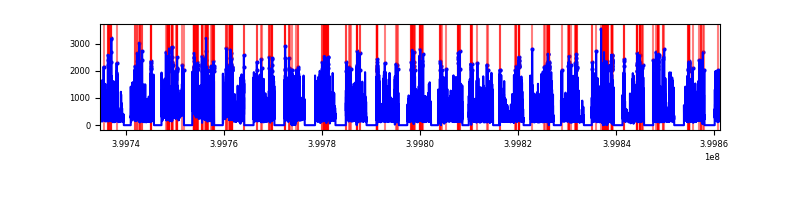 |
Top three noisy pixels from each quadrant. If the there are fewer than three noisy pixels in the level2.evt file, extra rows are filled as -1
| Pixel properties | Quadrant properties | ||||||
|---|---|---|---|---|---|---|---|
| Quadrant | DetID | PixID | Counts | Sigma | Mean | Median | Sigma |
| A | 9 | 19 | 4285 | 9.04 | 1353 | 1277 | 332.9 |
| A | 7 | 110 | 4226 | 8.86 | 1353 | 1277 | 332.9 |
| A | 0 | 29 | 4153 | 8.64 | 1353 | 1277 | 332.9 |
| B | 2 | 9 | 4331 | 12.04 | 1333 | 1280 | 253.3 |
| B | 3 | 80 | 4053 | 10.95 | 1333 | 1280 | 253.3 |
| B | 5 | 128 | 3580 | 9.08 | 1333 | 1280 | 253.3 |
| C | 1 | 81 | 4408 | 9.02 | 1366 | 1291 | 345.4 |
| C | 1 | 80 | 4231 | 8.51 | 1366 | 1291 | 345.4 |
| C | 3 | 187 | 3598 | 6.68 | 1366 | 1291 | 345.4 |
| D | 7 | 3 | 3238 | 6.26 | 1242 | 1134 | 336.3 |
| D | 10 | 189 | 3193 | 6.12 | 1242 | 1134 | 336.3 |
| D | 6 | 62 | 3179 | 6.08 | 1242 | 1134 | 336.3 |
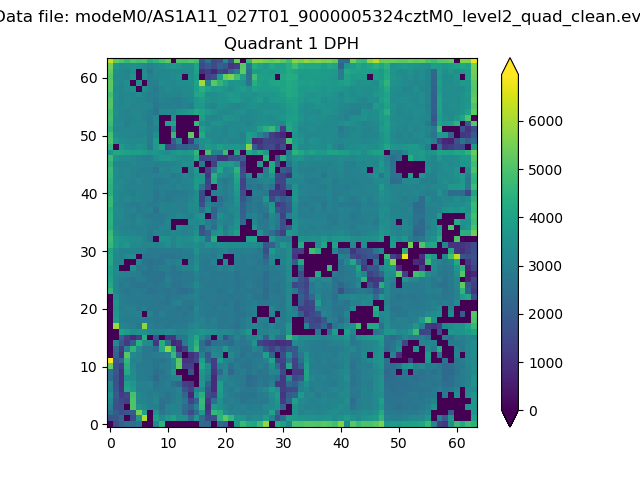
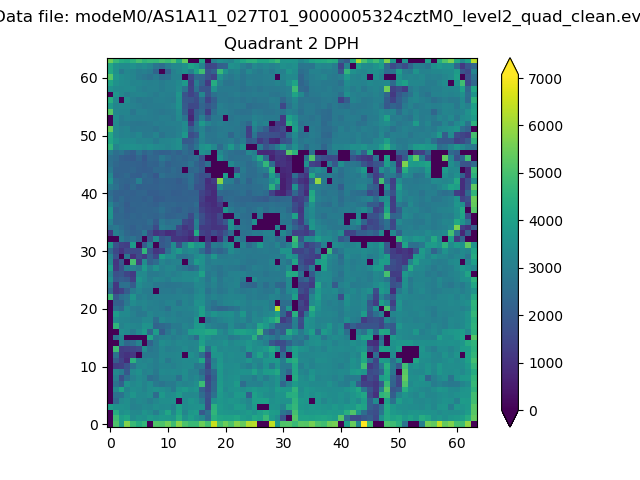
Histogram calculated using DETX and DETY for each event in the final _common_clean file
| Quadrant A |  |
 |
Quadrant B |
|---|---|---|---|
| Quadrant D |  |
 |
Quadrant C |
| Plot type | Count rate plots | Images |
|---|---|---|
| Comparison with Poisson distribution Blue bars denote a histogram of data divided into 1 sec bins. Red curve is a Poisson curve with rate = median count rate of data. |
 |
 |
| Quadrant-wise count rates Data is divided into 100 sec bins |
 |
|
| Module-wise count rates for Quadrant A Data is divided into 100 sec bins |
 |
 |
| Module-wise count rates for Quadrant B Data is divided into 100 sec bins |
 |
 |
| Module-wise count rates for Quadrant C Data is divided into 100 sec bins |
 |
 |
| Module-wise count rates for Quadrant D Data is divided into 100 sec bins |
 |
 |
| Parameter | Plot |
|---|---|
| CZT HV Monitor |  |
| D_VDD |  |
| Temperature 1 |  |
| Veto HV Monitor |  |
| Veto LLD | 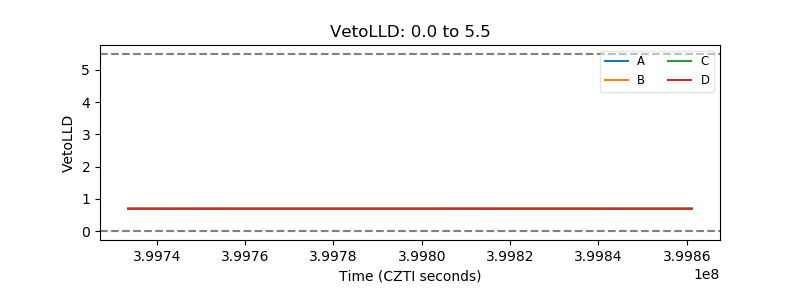 |
| Alpha Counter |  |
| _CPM_Rate |  |
| CZT Counter |  |
| +2.5 Volts monitor |  |
| +5 Volts monitor |  |
| _ROLL_ROT | 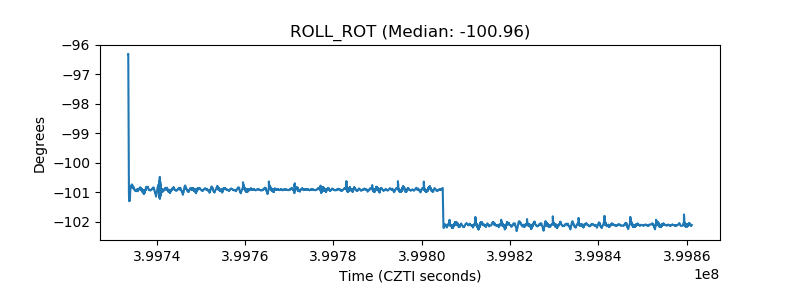 |
| _Roll_DEC |  |
| _Roll_RA | 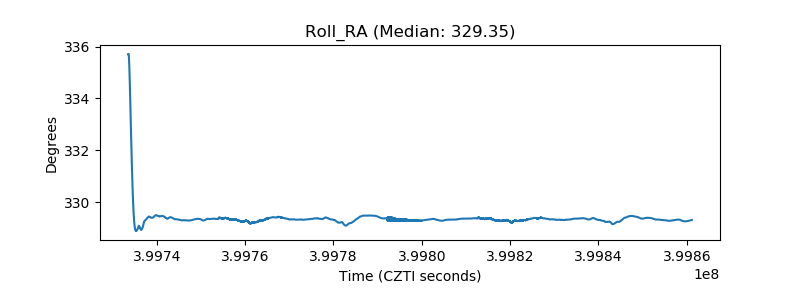 |
| Veto Counter |  |