| Param | Original file | Final file |
|---|---|---|
| Filename | modeM0/AS1A11_027T01_9000005324_37456cztM0_level2.evt | modeM0/AS1A11_027T01_9000005324_37456cztM0_level2_quad_clean.evt |
| Size (bytes) | 454,276,800 | 107,231,040 |
| Size | 433.2 MB | 102.3 MB |
| Events in quadrant A | 3,126,844 | 709,261 |
| Events in quadrant B | 3,443,030 | 710,766 |
| Events in quadrant C | 3,010,553 | 723,950 |
| Events in quadrant D | 3,778,522 | 693,155 |
| Mode SS | |||
|---|---|---|---|
| Quadrant | BADHDUFLAG | Total packets | Discarded packets |
| A | 0 | 118 | 0 |
| B | 0 | 118 | 0 |
| C | 0 | 118 | 0 |
| D | 0 | 118 | 0 |
| Mode M9 | |||
|---|---|---|---|
| Quadrant | BADHDUFLAG | Total packets | Discarded packets |
| A | 0 | 27 | 0 |
| B | 0 | 27 | 0 |
| C | 0 | 27 | 0 |
| D | 0 | 27 | 0 |
| Mode M0 | |||
|---|---|---|---|
| Quadrant | BADHDUFLAG | Total packets | Discarded packets |
| A | 0 | 13044 | 3 |
| B | 0 | 14244 | 2 |
| C | 0 | 12653 | 2 |
| D | 0 | 15191 | 2 |
| Quadrant | Total seconds | Saturated seconds | Saturation percentage |
|---|---|---|---|
| A | 5879 | 19 | 0.323184% |
| B | 5879 | 179 | 3.044735% |
| C | 5879 | 51 | 0.867494% |
| D | 5879 | 102 | 1.734989% |
Noise dominated data is calculated using 1-second bins in cleaned event files. If a bin has >2000 counts, and if more than 50% of those come from <1% of pixels, then it is considered to be noise-dominated and hence unusable.
| Quadrant | # 1 sec bins | Bins with >0 counts | Bins with >2000 counts | High rate bins dominated by noise | Noise dominated (total time) | Noise dominated (detector-on time) | Marked lightcurve |
|---|---|---|---|---|---|---|---|
| A | 7312 | 5880 | 6 | 6 | 0.08% | 0.10% | 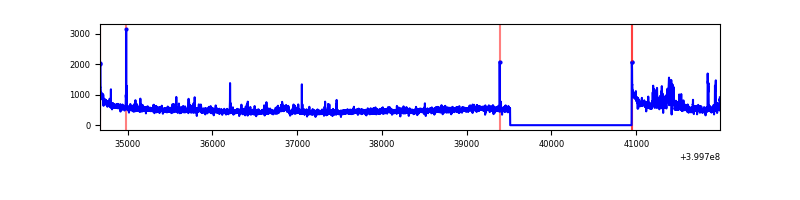 |
| B | 7312 | 5880 | 106 | 106 | 1.45% | 1.80% | 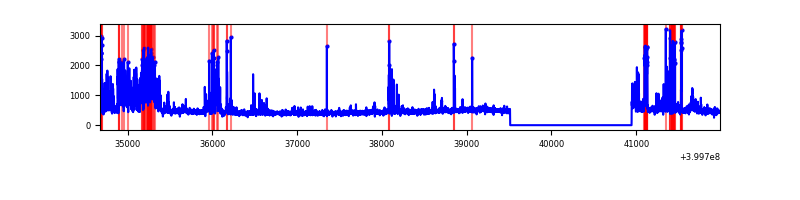 |
| C | 7312 | 5880 | 42 | 42 | 0.57% | 0.71% | 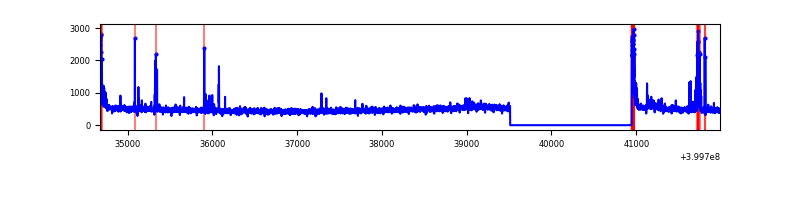 |
| D | 7312 | 5880 | 99 | 99 | 1.35% | 1.68% | 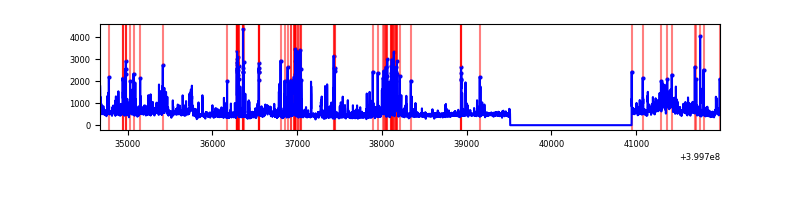 |
Top three noisy pixels from each quadrant. If the there are fewer than three noisy pixels in the level2.evt file, extra rows are filled as -1
| Pixel properties | Quadrant properties | ||||||
|---|---|---|---|---|---|---|---|
| Quadrant | DetID | PixID | Counts | Sigma | Mean | Median | Sigma |
| A | 10 | 83 | 321901 | 2391.56 | 658 | 643 | 134.3 |
| A | 15 | 222 | 149472 | 1107.94 | 658 | 643 | 134.3 |
| A | 12 | 189 | 31075 | 226.55 | 658 | 643 | 134.3 |
| B | 4 | 171 | 448321 | 3550.49 | 649 | 632 | 126.1 |
| B | 5 | 172 | 119294 | 941.07 | 649 | 632 | 126.1 |
| B | 5 | 200 | 71762 | 564.11 | 649 | 632 | 126.1 |
| C | 15 | 214 | 253477 | 1692.01 | 641 | 645 | 149.4 |
| C | 0 | 10 | 111796 | 743.85 | 641 | 645 | 149.4 |
| C | 14 | 254 | 100008 | 664.96 | 641 | 645 | 149.4 |
| D | 12 | 235 | 368195 | 2349.68 | 639 | 622 | 156.4 |
| D | 13 | 249 | 199809 | 1273.29 | 639 | 622 | 156.4 |
| D | 12 | 227 | 159095 | 1013.03 | 639 | 622 | 156.4 |
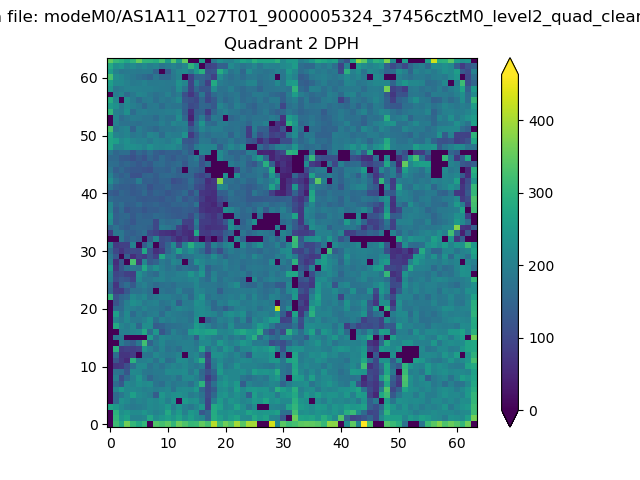
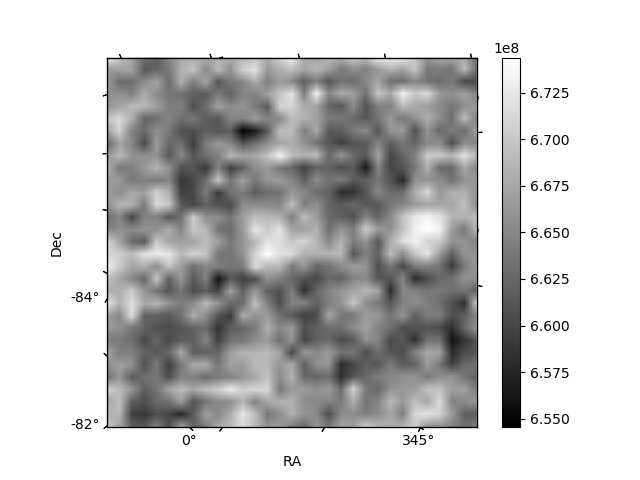
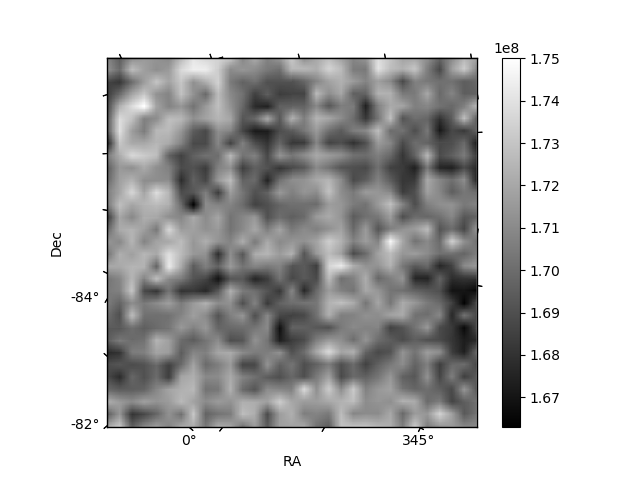
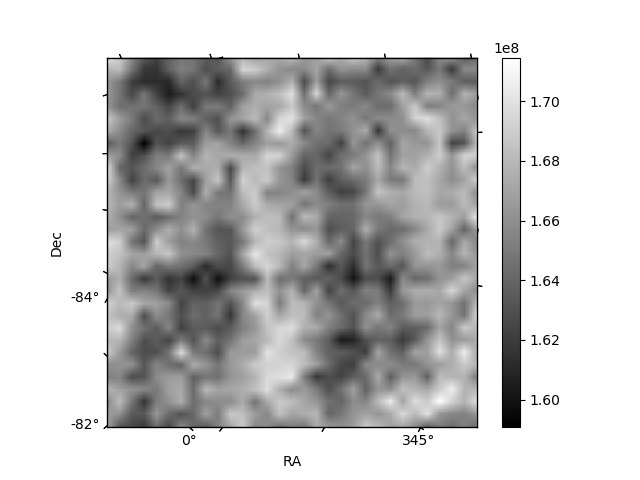
Histogram calculated using DETX and DETY for each event in the final _common_clean file
| Quadrant A | 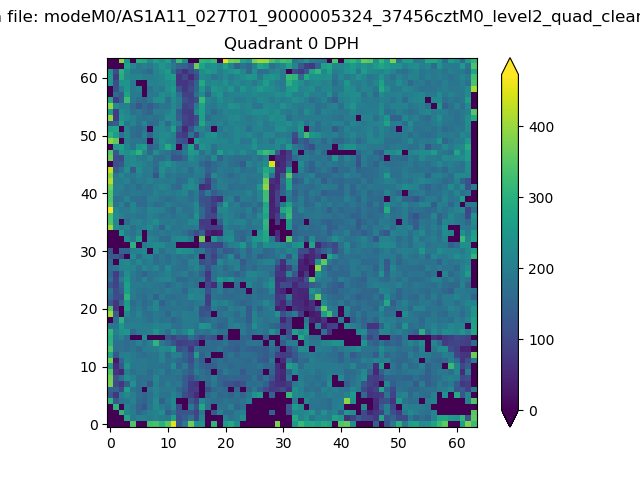 |
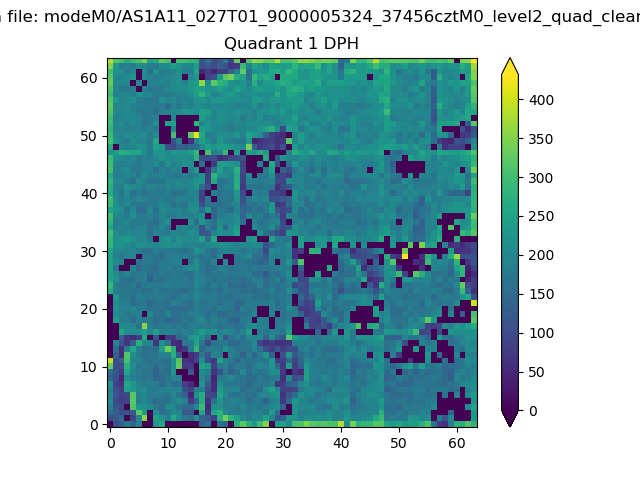 |
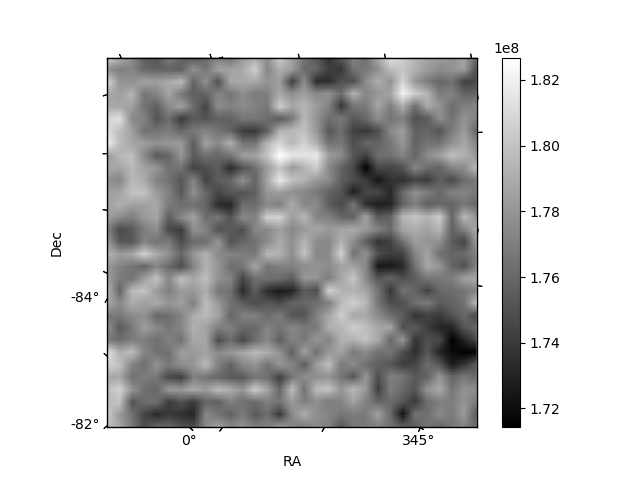
Quadrant B |
|---|---|---|---|
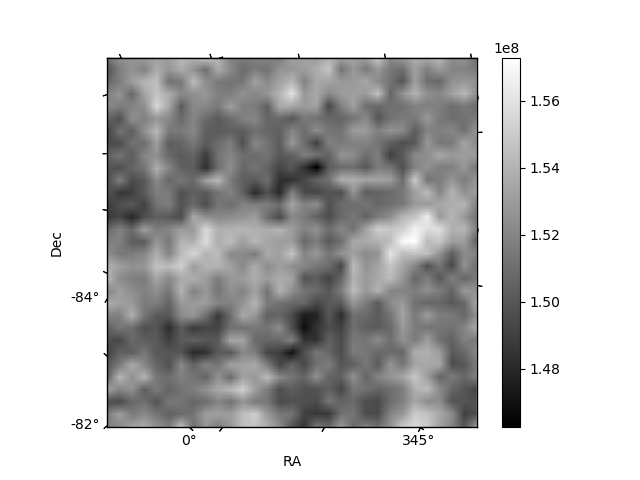
| Quadrant D | 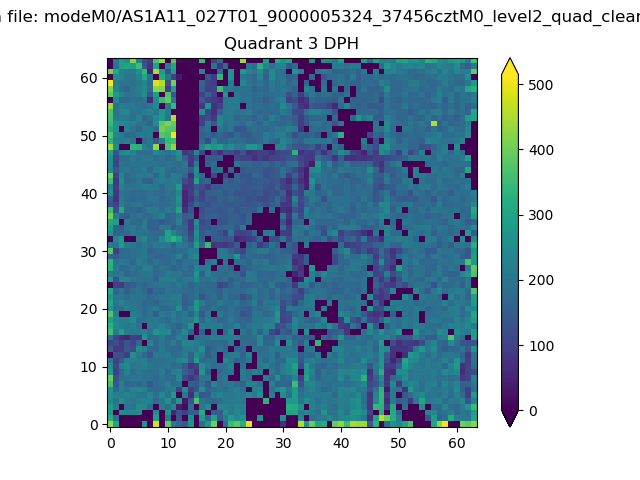 |
 |
Quadrant C |
| Plot type | Count rate plots | Images |
|---|---|---|
| Comparison with Poisson distribution Blue bars denote a histogram of data divided into 1 sec bins. Red curve is a Poisson curve with rate = median count rate of data. |
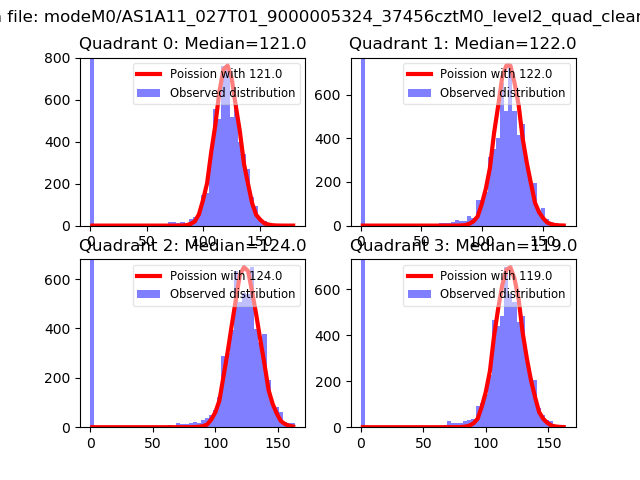 |
 |
| Quadrant-wise count rates Data is divided into 100 sec bins |
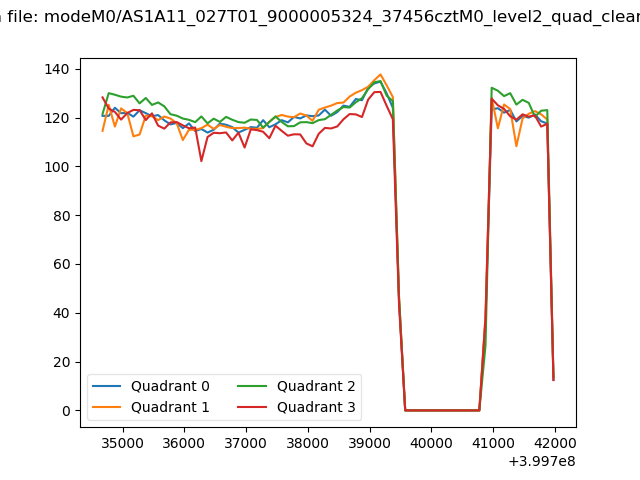 |
|
| Module-wise count rates for Quadrant A Data is divided into 100 sec bins |
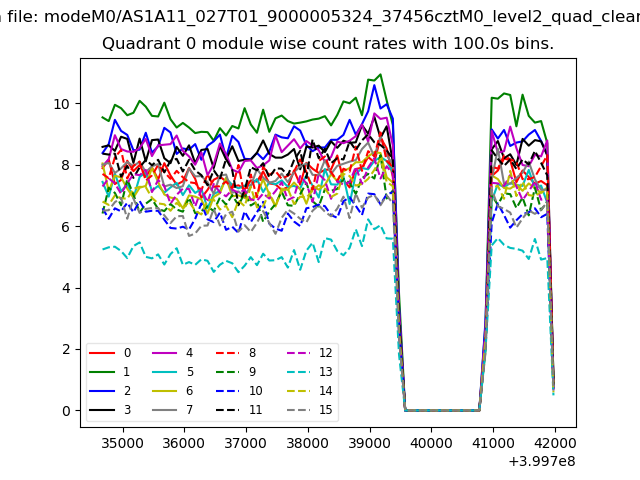 |
 |
| Module-wise count rates for Quadrant B Data is divided into 100 sec bins |
 |
 |
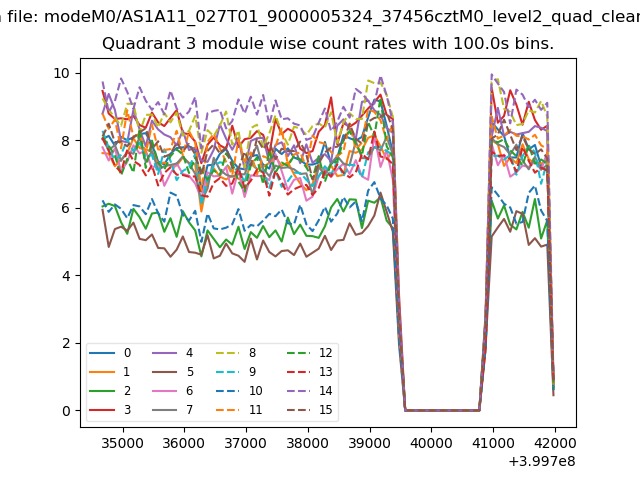
| Module-wise count rates for Quadrant C Data is divided into 100 sec bins |
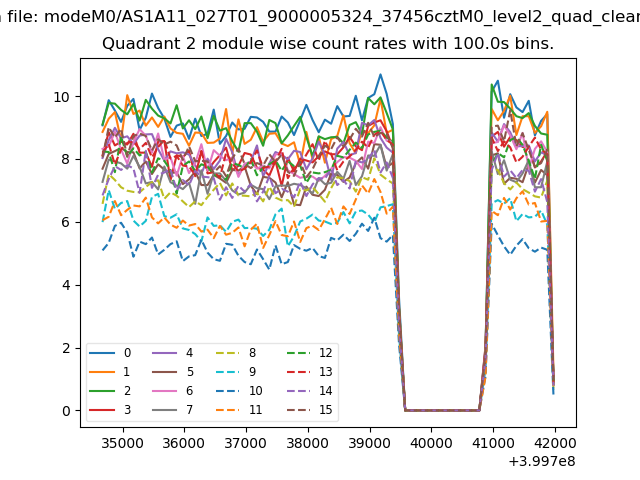 |
 |
| Module-wise count rates for Quadrant D Data is divided into 100 sec bins |
 |
 |
| Parameter | Plot |
|---|---|
| CZT HV Monitor | 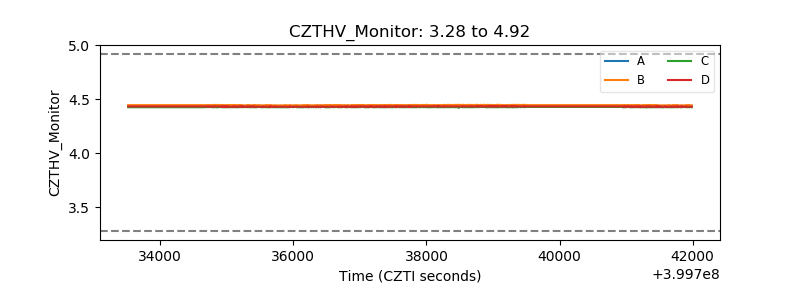 |
| D_VDD |  |
| Temperature 1 | 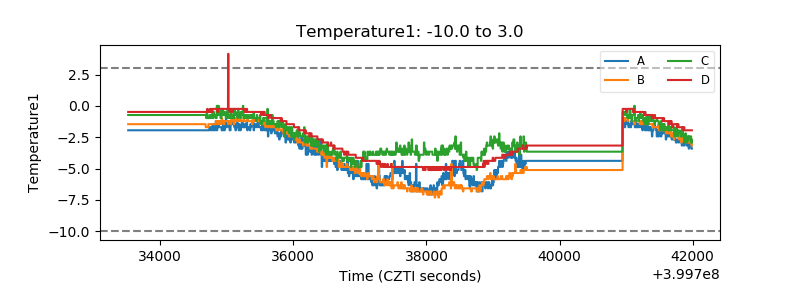 |
| Veto HV Monitor | 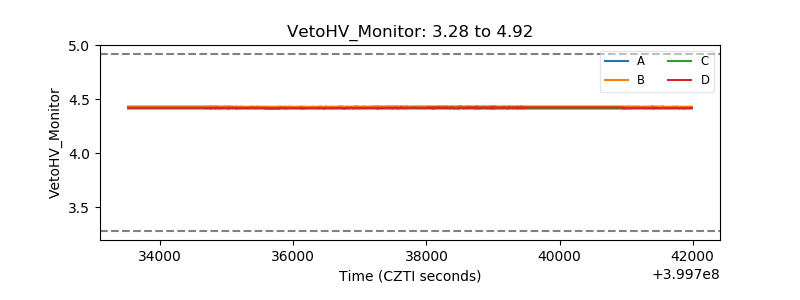 |
| Veto LLD | 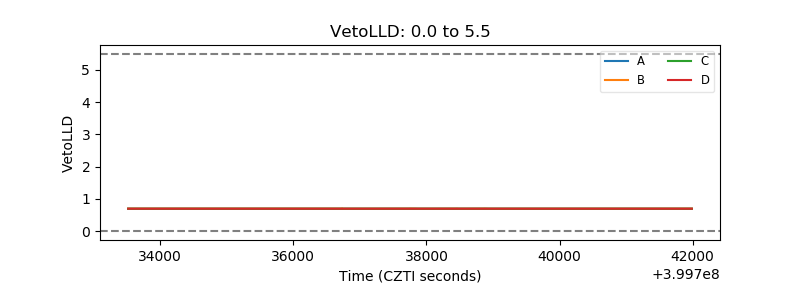 |
| Alpha Counter | 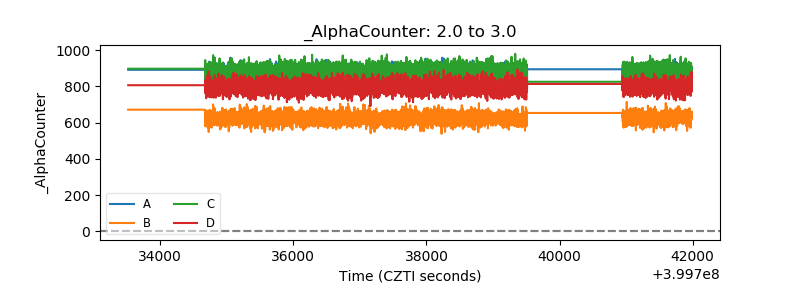 |
| _CPM_Rate | 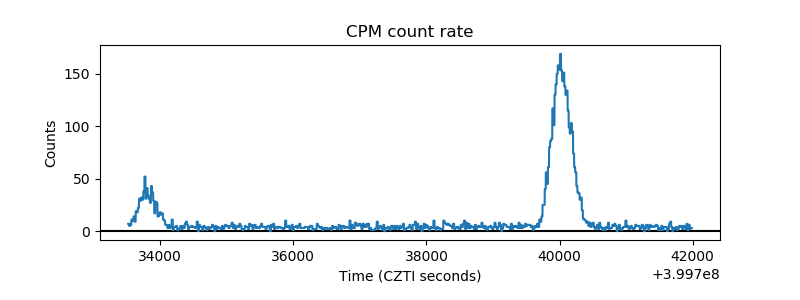 |
| CZT Counter | 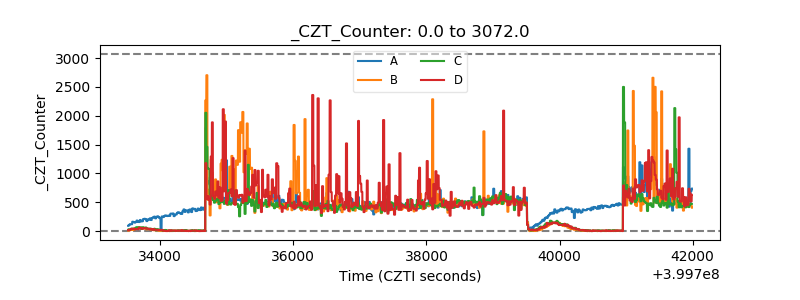 |
| +2.5 Volts monitor | 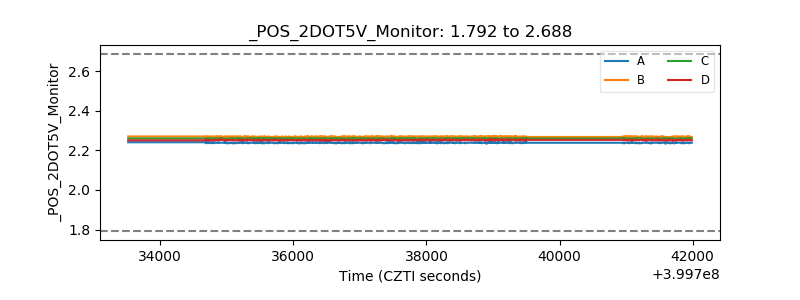 |
| +5 Volts monitor | 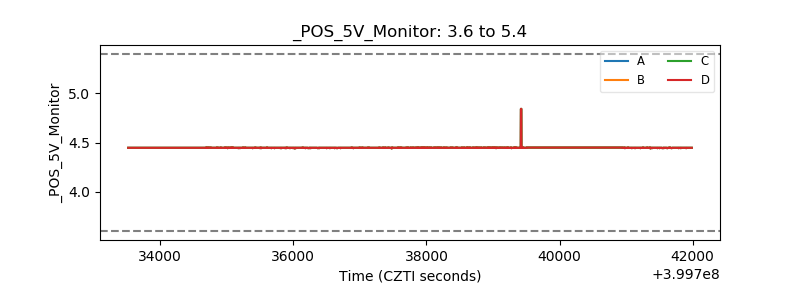 |
| _ROLL_ROT | 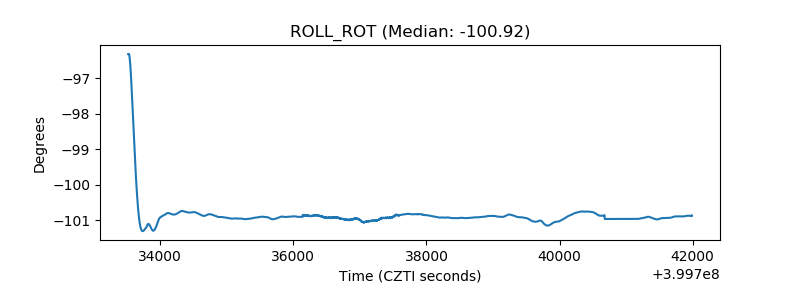 |
| _Roll_DEC | 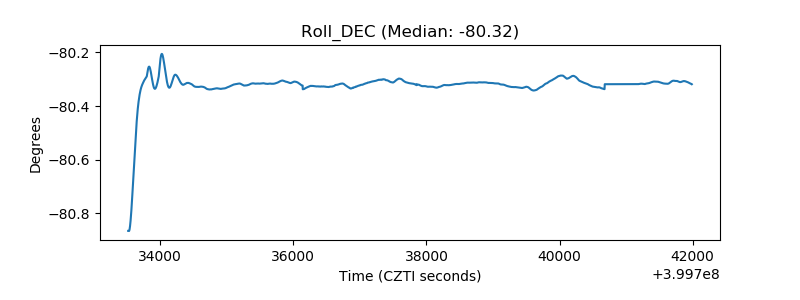 |
| _Roll_RA | 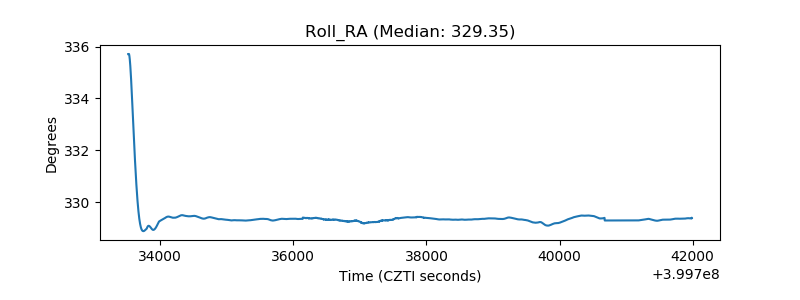 |
| Veto Counter | 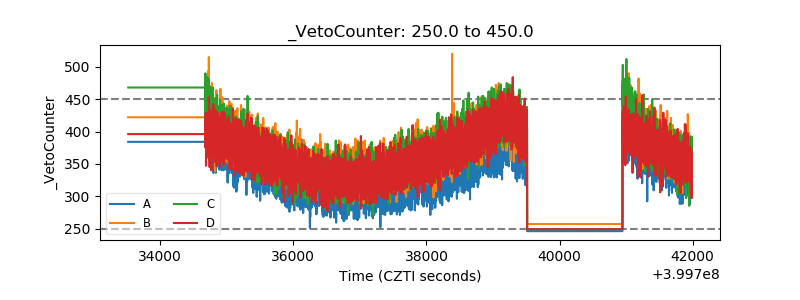 |