| Param | Original file | Final file |
|---|---|---|
| Filename | modeM0/AS1A11_027T01_9000005324_37458cztM0_level2.evt | modeM0/AS1A11_027T01_9000005324_37458cztM0_level2_quad_clean.evt |
| Size (bytes) | 575,400,960 | 97,531,200 |
| Size | 548.7 MB | 93.0 MB |
| Events in quadrant A | 4,101,186 | 650,100 |
| Events in quadrant B | 3,303,765 | 669,994 |
| Events in quadrant C | 4,210,185 | 640,699 |
| Events in quadrant D | 5,446,699 | 614,952 |
| Mode SS | |||
|---|---|---|---|
| Quadrant | BADHDUFLAG | Total packets | Discarded packets |
| A | 0 | 110 | 0 |
| B | 0 | 110 | 0 |
| C | 0 | 110 | 0 |
| D | 0 | 110 | 0 |
| Mode M9 | |||
|---|---|---|---|
| Quadrant | BADHDUFLAG | Total packets | Discarded packets |
| A | 0 | 24 | 0 |
| B | 0 | 24 | 0 |
| C | 0 | 24 | 0 |
| D | 0 | 25 | 0 |
| Mode M0 | |||
|---|---|---|---|
| Quadrant | BADHDUFLAG | Total packets | Discarded packets |
| A | 0 | 15890 | 3 |
| B | 0 | 13364 | 2 |
| C | 0 | 15921 | 2 |
| D | 0 | 19995 | 2 |
| Quadrant | Total seconds | Saturated seconds | Saturation percentage |
|---|---|---|---|
| A | 5395 | 42 | 0.778499% |
| B | 5395 | 90 | 1.668211% |
| C | 5395 | 473 | 8.767377% |
| D | 5395 | 233 | 4.318814% |
Noise dominated data is calculated using 1-second bins in cleaned event files. If a bin has >2000 counts, and if more than 50% of those come from <1% of pixels, then it is considered to be noise-dominated and hence unusable.
| Quadrant | # 1 sec bins | Bins with >0 counts | Bins with >2000 counts | High rate bins dominated by noise | Noise dominated (total time) | Noise dominated (detector-on time) | Marked lightcurve |
|---|---|---|---|---|---|---|---|
| A | 7098 | 5396 | 16 | 16 | 0.23% | 0.30% | 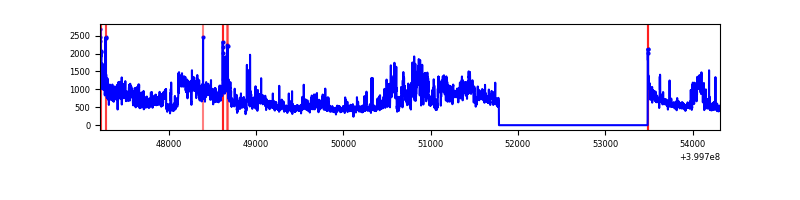 |
| B | 7098 | 5396 | 54 | 54 | 0.76% | 1.00% | 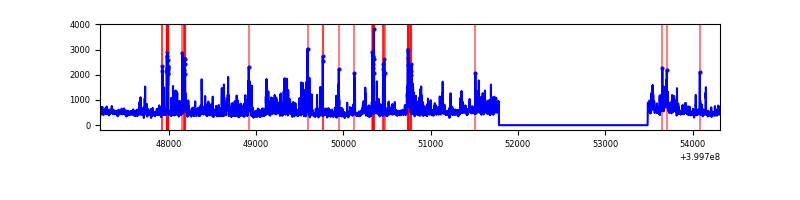 |
| C | 7098 | 5396 | 438 | 438 | 6.17% | 8.12% | 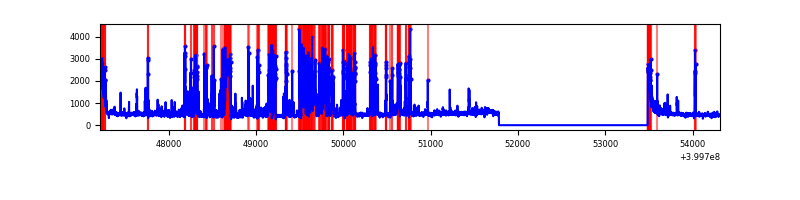 |
| D | 7098 | 5396 | 253 | 253 | 3.56% | 4.69% | 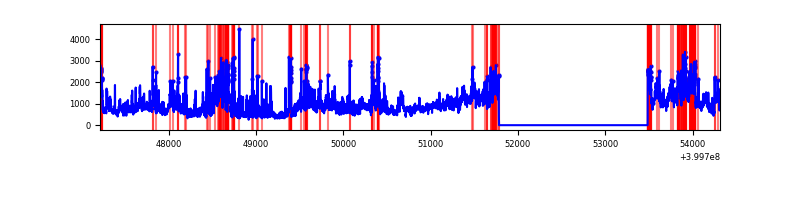 |
Top three noisy pixels from each quadrant. If the there are fewer than three noisy pixels in the level2.evt file, extra rows are filled as -1
| Pixel properties | Quadrant properties | ||||||
|---|---|---|---|---|---|---|---|
| Quadrant | DetID | PixID | Counts | Sigma | Mean | Median | Sigma |
| A | 15 | 222 | 883021 | 7268.55 | 598 | 587 | 121.4 |
| A | 15 | 174 | 517231 | 4255.56 | 598 | 587 | 121.4 |
| A | 10 | 83 | 299025 | 2458.22 | 598 | 587 | 121.4 |
| B | 4 | 171 | 477172 | 4158.82 | 598 | 583 | 114.6 |
| B | 0 | 189 | 104049 | 902.87 | 598 | 583 | 114.6 |
| B | 0 | 213 | 77212 | 668.68 | 598 | 583 | 114.6 |
| C | 14 | 254 | 1485979 | 11202.94 | 568 | 571 | 132.6 |
| C | 15 | 214 | 223863 | 1684.07 | 568 | 571 | 132.6 |
| C | 0 | 10 | 190855 | 1435.12 | 568 | 571 | 132.6 |
| D | 12 | 227 | 1651087 | 11738.4 | 573 | 556 | 140.6 |
| D | 12 | 235 | 950132 | 6753.28 | 573 | 556 | 140.6 |
| D | 2 | 249 | 231391 | 1641.67 | 573 | 556 | 140.6 |
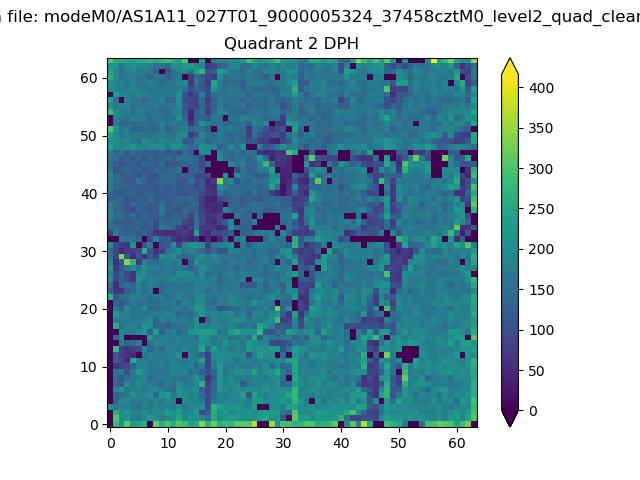
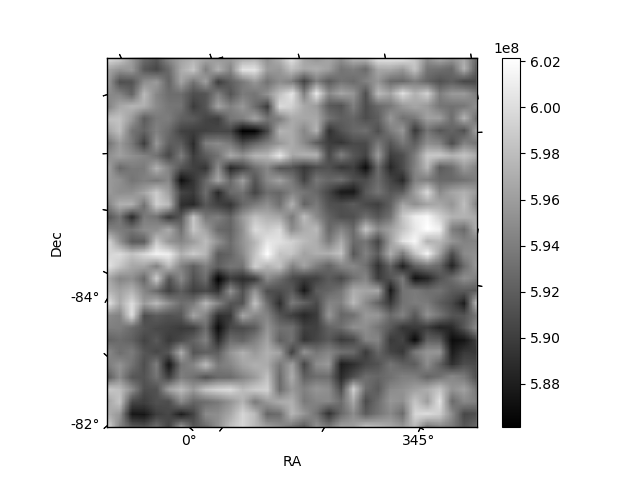
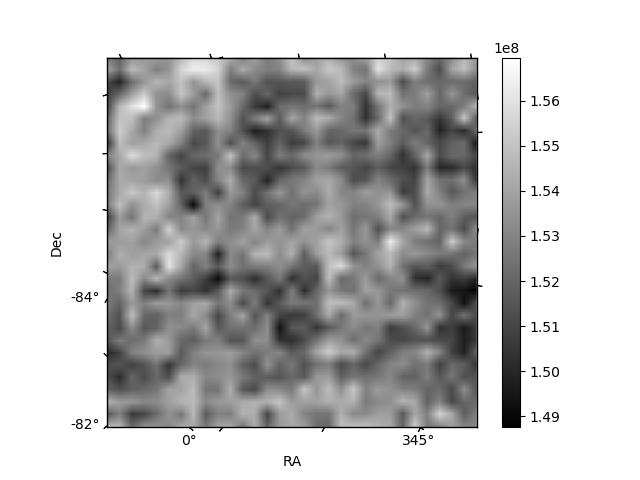
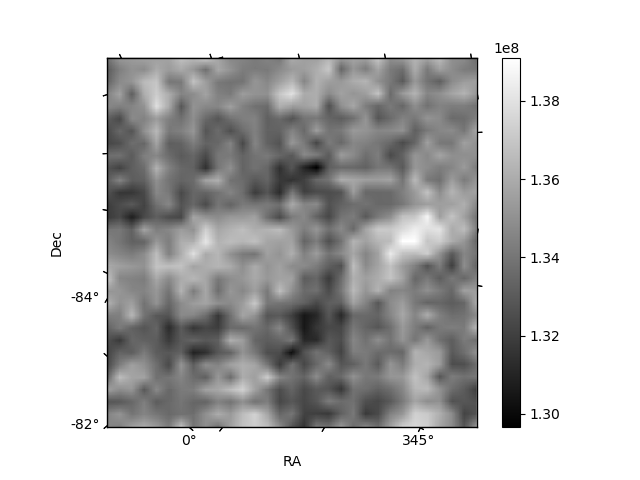
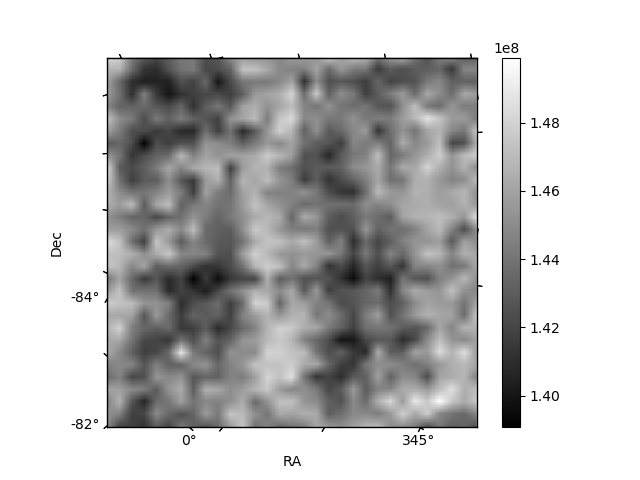
Histogram calculated using DETX and DETY for each event in the final _common_clean file
| Quadrant A | 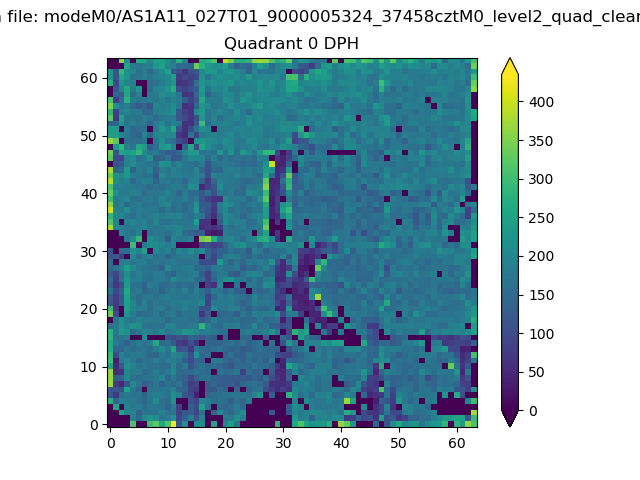 |
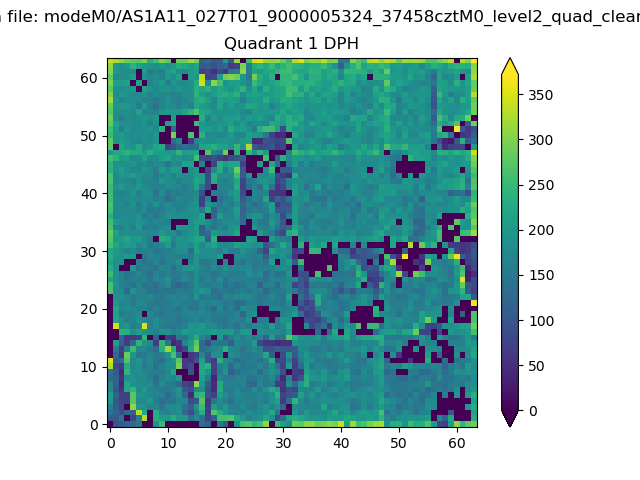 |
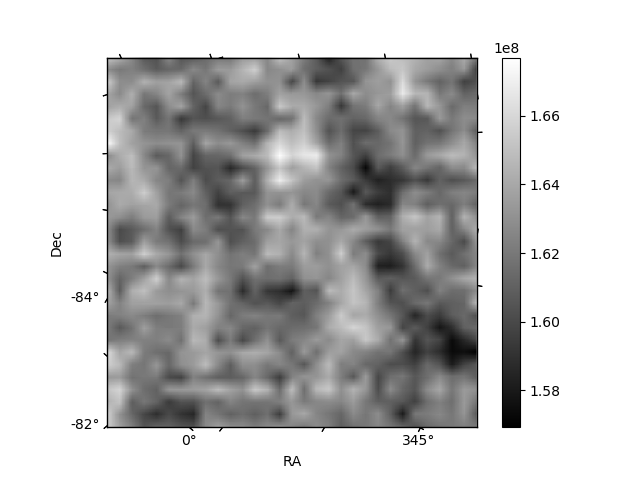
Quadrant B |
|---|---|---|---|
| Quadrant D | 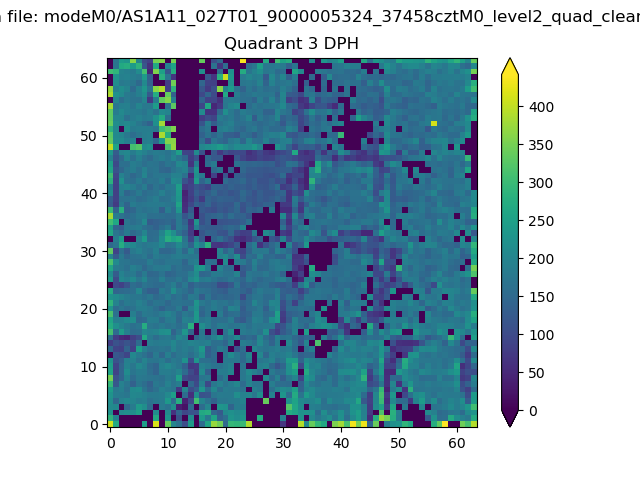 |
 |
Quadrant C |
| Plot type | Count rate plots | Images |
|---|---|---|
| Comparison with Poisson distribution Blue bars denote a histogram of data divided into 1 sec bins. Red curve is a Poisson curve with rate = median count rate of data. |
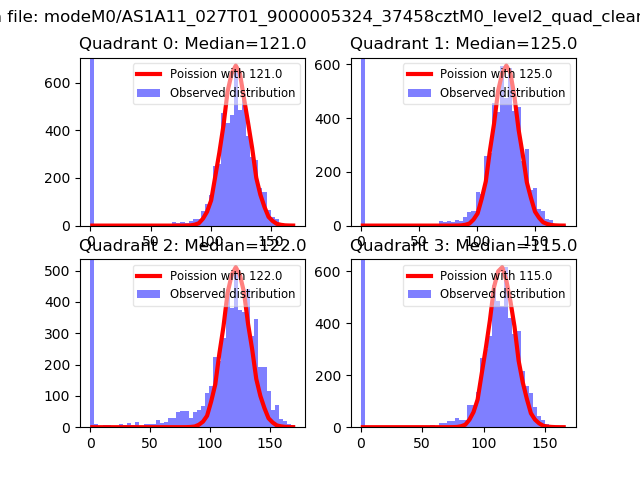 |
 |
| Quadrant-wise count rates Data is divided into 100 sec bins |
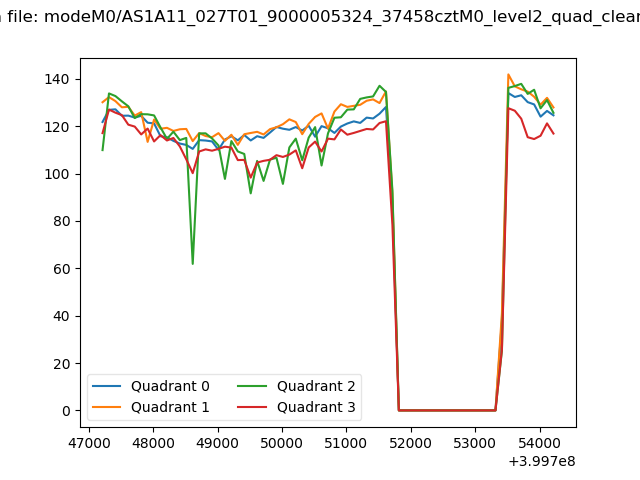 |
|
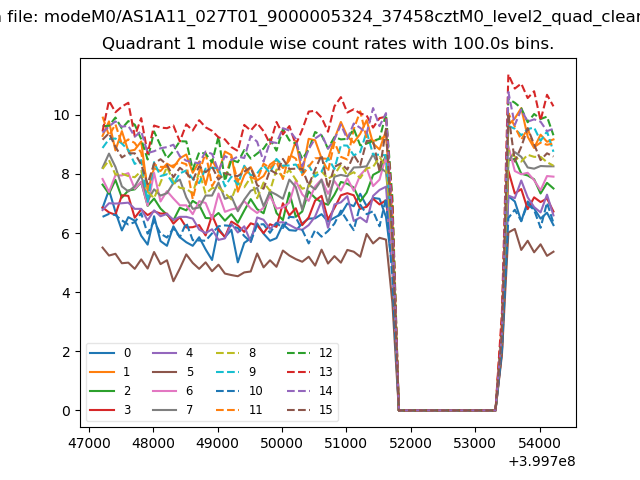
| Module-wise count rates for Quadrant A Data is divided into 100 sec bins |
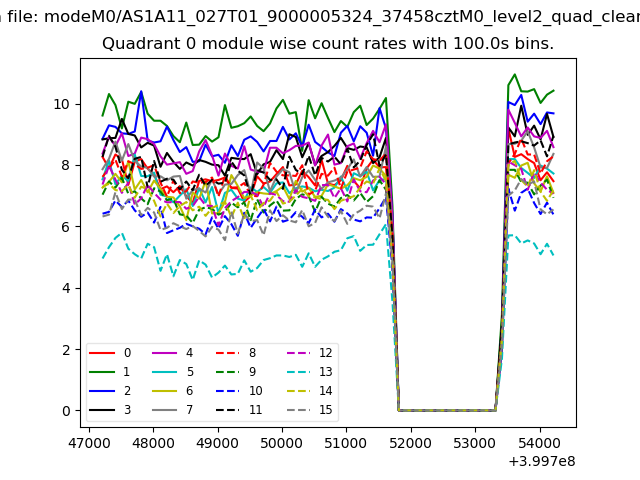 |
 |
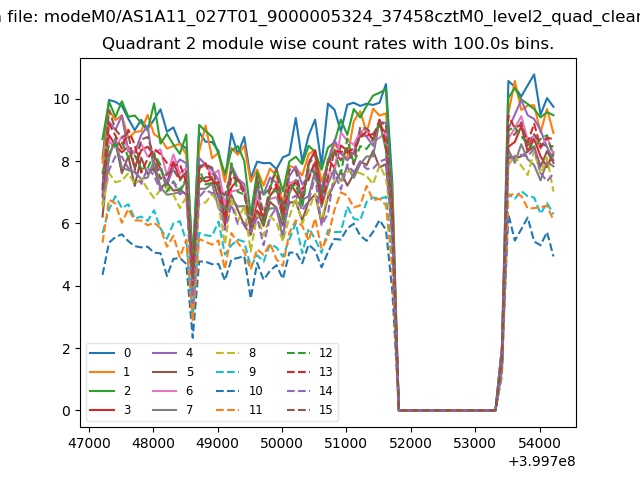
| Module-wise count rates for Quadrant B Data is divided into 100 sec bins |
 |
 |
| Module-wise count rates for Quadrant C Data is divided into 100 sec bins |
 |
 |
| Module-wise count rates for Quadrant D Data is divided into 100 sec bins |
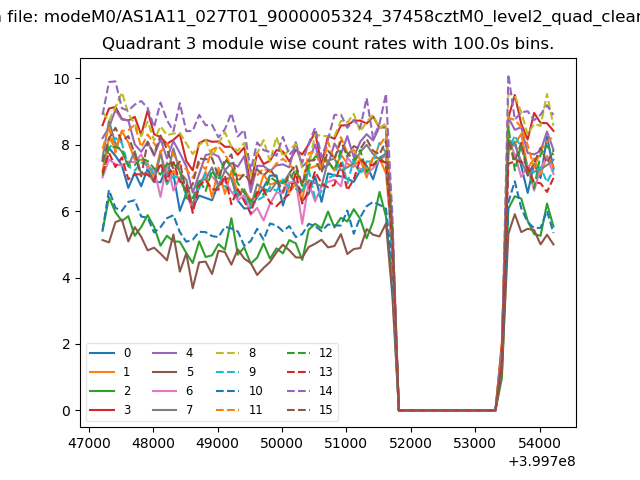 |
 |
| Parameter | Plot |
|---|---|
| CZT HV Monitor | 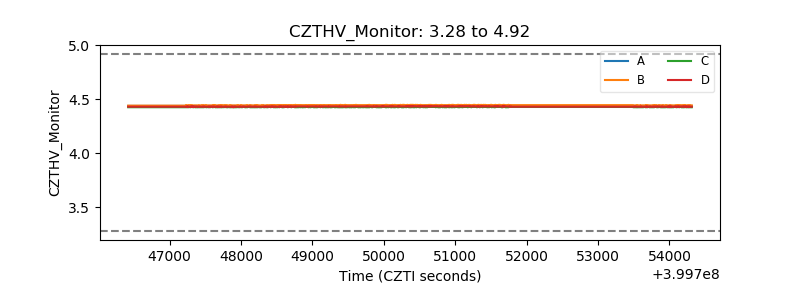 |
| D_VDD | 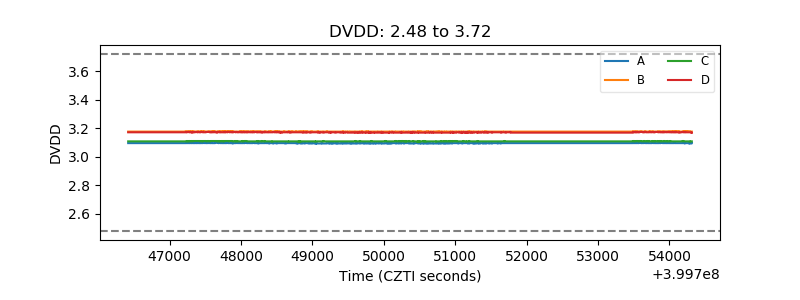 |
| Temperature 1 | 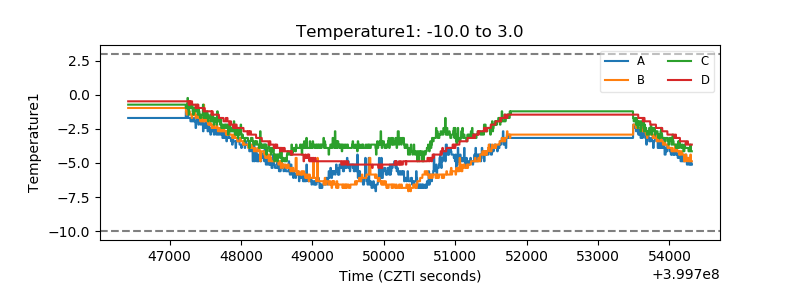 |
| Veto HV Monitor |  |
| Veto LLD | 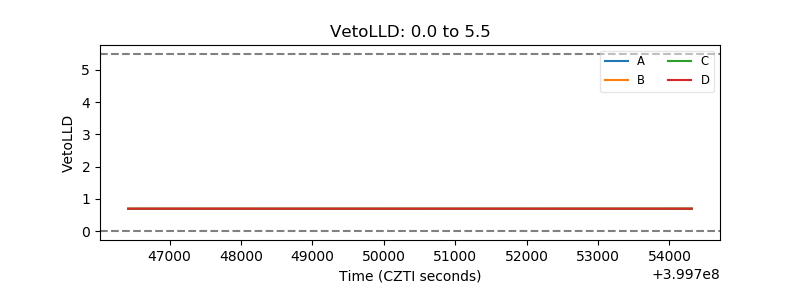 |
| Alpha Counter | 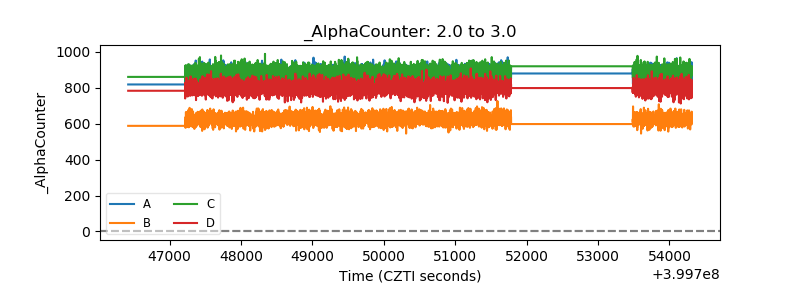 |
| _CPM_Rate | 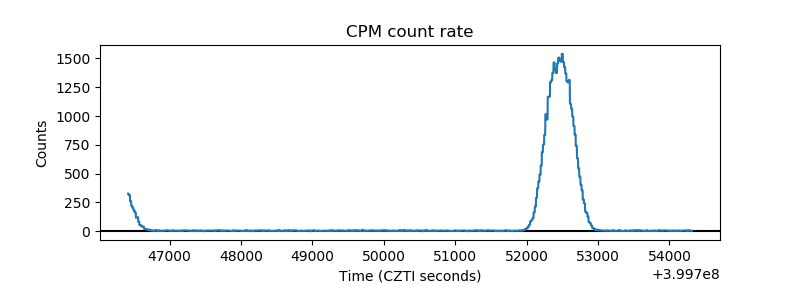 |
| CZT Counter | 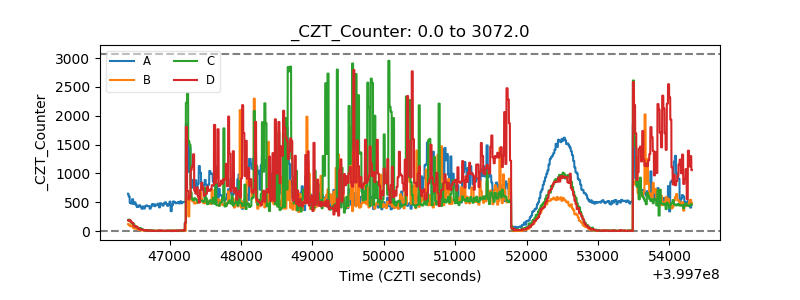 |
| +2.5 Volts monitor | 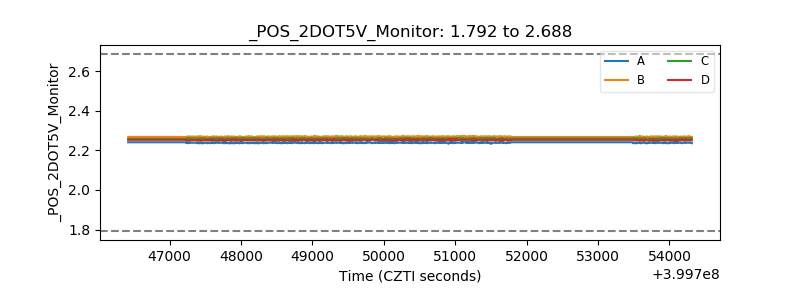 |
| +5 Volts monitor | 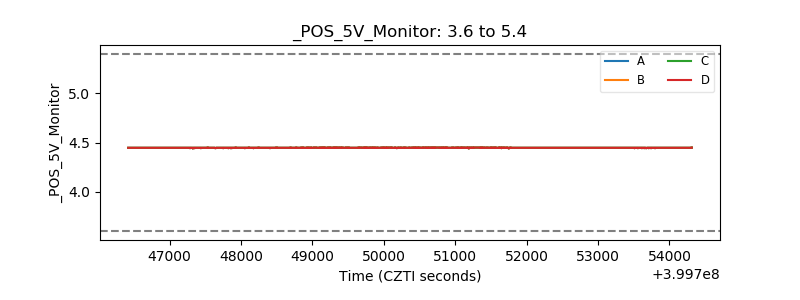 |
| _ROLL_ROT | 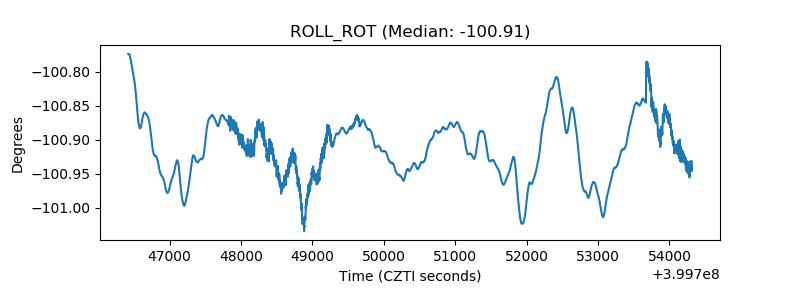 |
| _Roll_DEC | 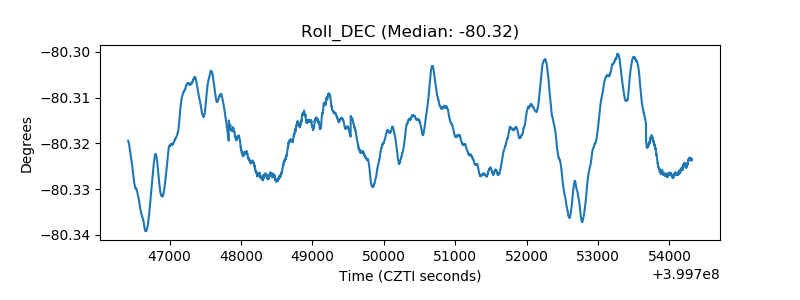 |
| _Roll_RA | 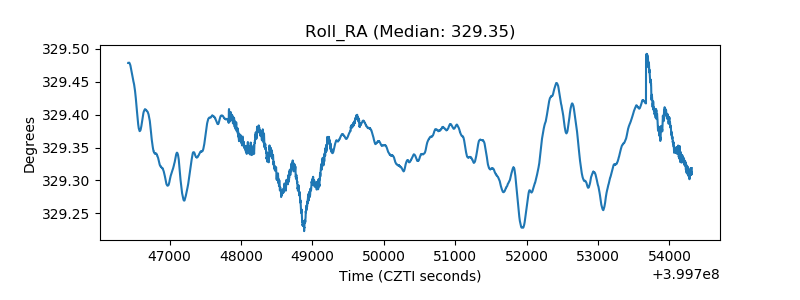 |
| Veto Counter |  |