| Param | Original file | Final file |
|---|---|---|
| Filename | modeM0/AS1A11_027T01_9000005324_37460cztM0_level2.evt | modeM0/AS1A11_027T01_9000005324_37460cztM0_level2_quad_clean.evt |
| Size (bytes) | 487,673,280 | 98,490,240 |
| Size | 465.1 MB | 93.9 MB |
| Events in quadrant A | 3,141,080 | 661,408 |
| Events in quadrant B | 2,725,924 | 681,968 |
| Events in quadrant C | 2,889,062 | 668,869 |
| Events in quadrant D | 5,656,760 | 601,954 |
| Mode SS | |||
|---|---|---|---|
| Quadrant | BADHDUFLAG | Total packets | Discarded packets |
| A | 0 | 108 | 0 |
| B | 0 | 108 | 0 |
| C | 0 | 108 | 0 |
| D | 0 | 108 | 0 |
| Mode M9 | |||
|---|---|---|---|
| Quadrant | BADHDUFLAG | Total packets | Discarded packets |
| A | 0 | 29 | 0 |
| B | 0 | 29 | 0 |
| C | 0 | 29 | 0 |
| D | 0 | 30 | 0 |
| Mode M0 | |||
|---|---|---|---|
| Quadrant | BADHDUFLAG | Total packets | Discarded packets |
| A | 0 | 12745 | 3 |
| B | 0 | 11650 | 2 |
| C | 0 | 11923 | 2 |
| D | 0 | 20526 | 2 |
| Quadrant | Total seconds | Saturated seconds | Saturation percentage |
|---|---|---|---|
| A | 5258 | 29 | 0.551541% |
| B | 5258 | 42 | 0.798783% |
| C | 5258 | 60 | 1.141118% |
| D | 5258 | 416 | 7.911754% |
Noise dominated data is calculated using 1-second bins in cleaned event files. If a bin has >2000 counts, and if more than 50% of those come from <1% of pixels, then it is considered to be noise-dominated and hence unusable.
| Quadrant | # 1 sec bins | Bins with >0 counts | Bins with >2000 counts | High rate bins dominated by noise | Noise dominated (total time) | Noise dominated (detector-on time) | Marked lightcurve |
|---|---|---|---|---|---|---|---|
| A | 7049 | 5259 | 14 | 14 | 0.20% | 0.27% | 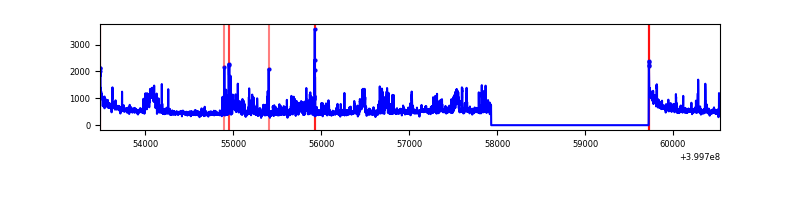 |
| B | 7049 | 5259 | 28 | 28 | 0.40% | 0.53% | 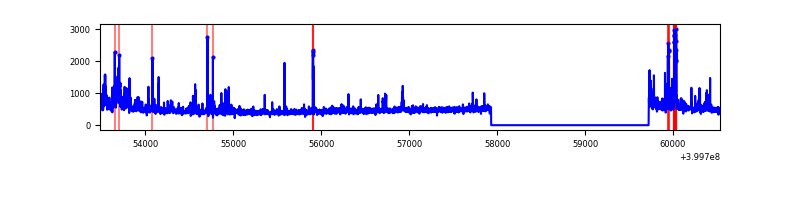 |
| C | 7049 | 5259 | 58 | 58 | 0.82% | 1.10% | 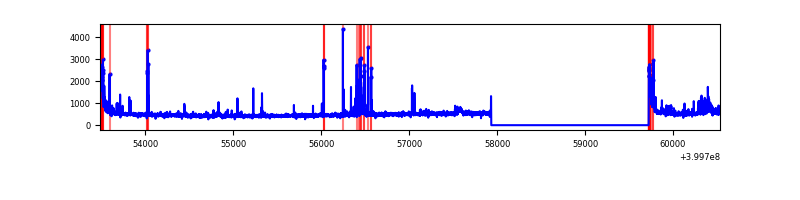 |
| D | 7049 | 5259 | 449 | 449 | 6.37% | 8.54% | 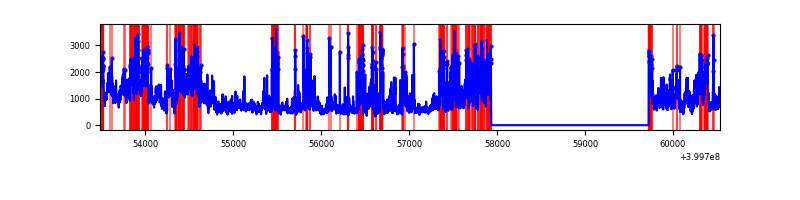 |
Top three noisy pixels from each quadrant. If the there are fewer than three noisy pixels in the level2.evt file, extra rows are filled as -1
| Pixel properties | Quadrant properties | ||||||
|---|---|---|---|---|---|---|---|
| Quadrant | DetID | PixID | Counts | Sigma | Mean | Median | Sigma |
| A | 15 | 222 | 394160 | 3301.77 | 590 | 577 | 119.2 |
| A | 10 | 83 | 289853 | 2426.74 | 590 | 577 | 119.2 |
| A | 13 | 248 | 102337 | 853.67 | 590 | 577 | 119.2 |
| B | 5 | 184 | 91050 | 811.73 | 592 | 578 | 111.5 |
| B | 4 | 171 | 63520 | 564.73 | 592 | 578 | 111.5 |
| B | 5 | 200 | 58079 | 515.91 | 592 | 578 | 111.5 |
| C | 15 | 214 | 221088 | 1638.13 | 578 | 580 | 134.6 |
| C | 0 | 10 | 147681 | 1092.8 | 578 | 580 | 134.6 |
| C | 14 | 254 | 144674 | 1070.46 | 578 | 580 | 134.6 |
| D | 12 | 235 | 1717280 | 12682.22 | 554 | 537 | 135.4 |
| D | 13 | 249 | 798900 | 5897.81 | 554 | 537 | 135.4 |
| D | 12 | 227 | 618299 | 4563.64 | 554 | 537 | 135.4 |
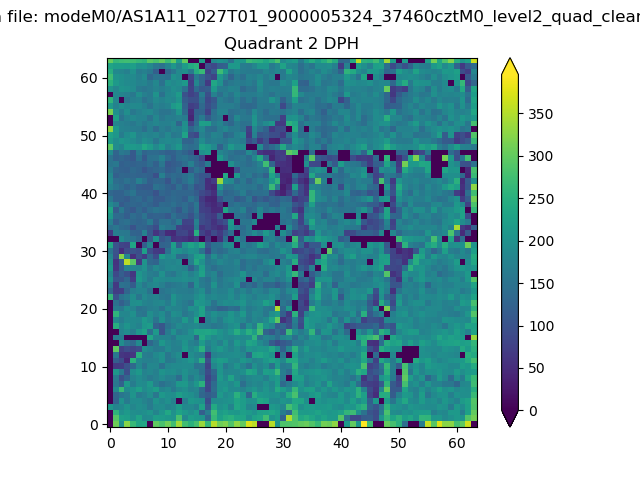
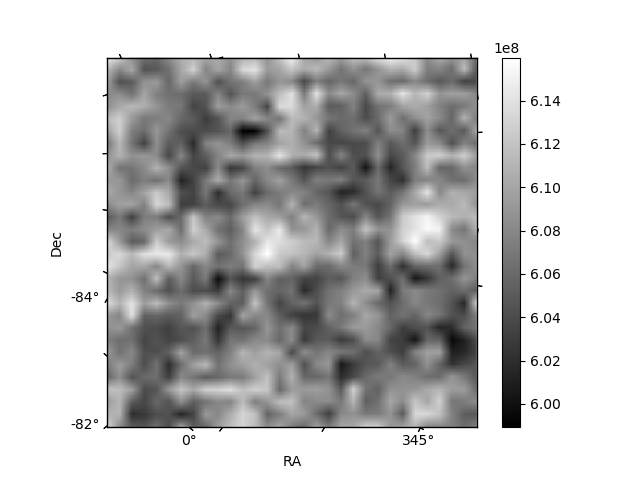
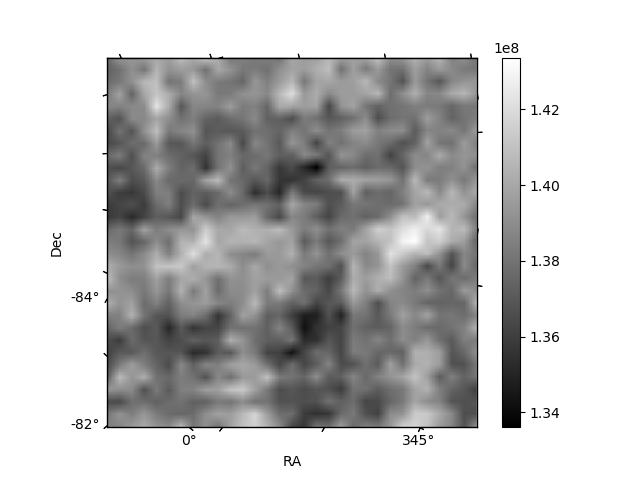
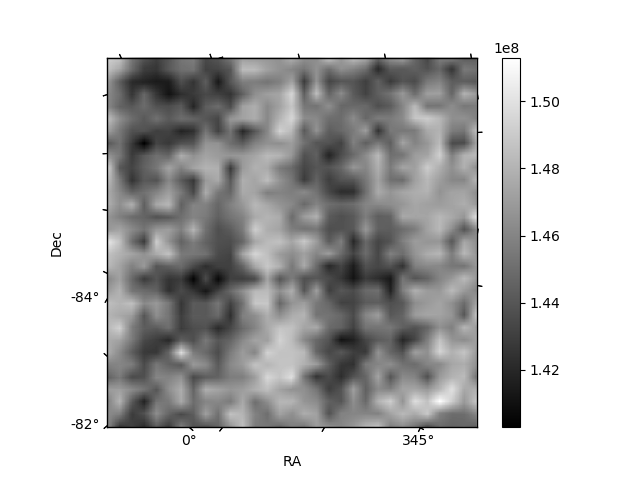
Histogram calculated using DETX and DETY for each event in the final _common_clean file
| Quadrant A | 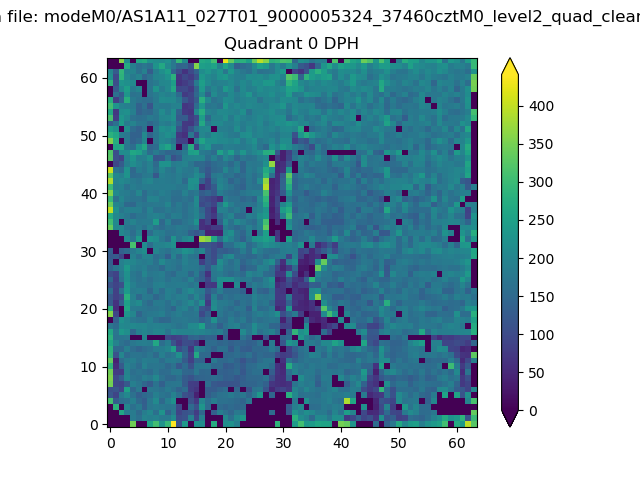 |
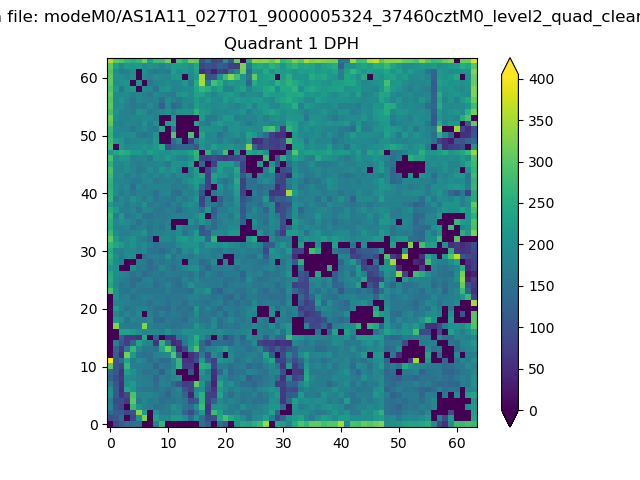 |
Quadrant B |
|---|---|---|---|
| Quadrant D | 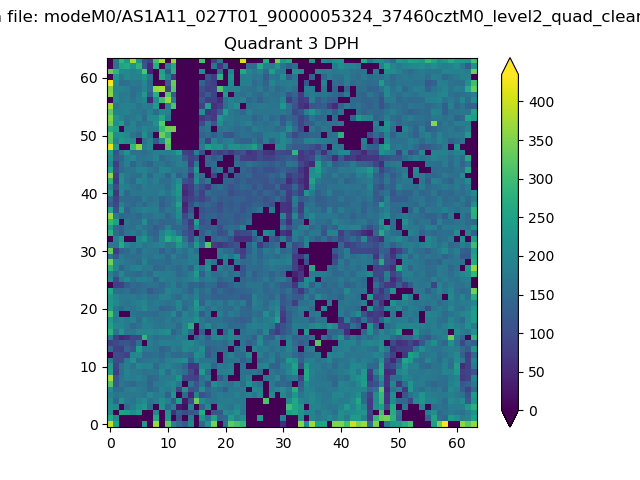 |
 |
Quadrant C |
| Plot type | Count rate plots | Images |
|---|---|---|
| Comparison with Poisson distribution Blue bars denote a histogram of data divided into 1 sec bins. Red curve is a Poisson curve with rate = median count rate of data. |
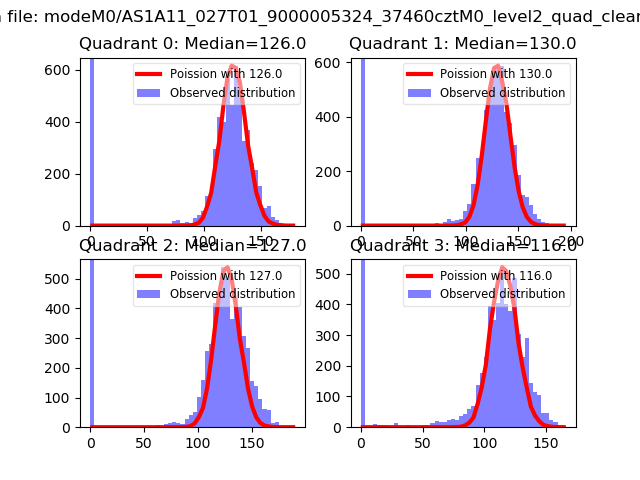 |
 |
| Quadrant-wise count rates Data is divided into 100 sec bins |
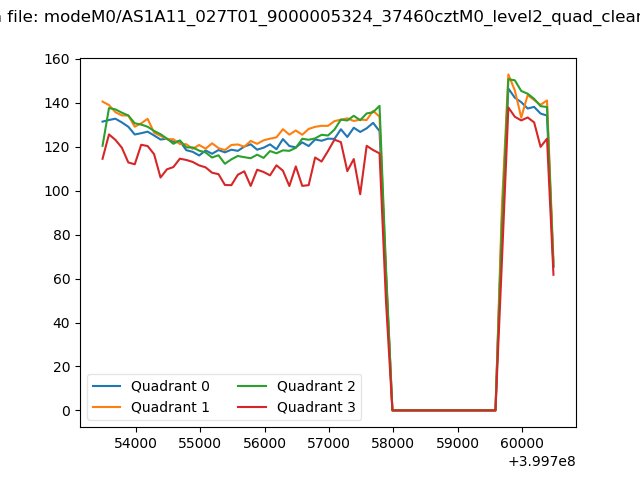 |
|
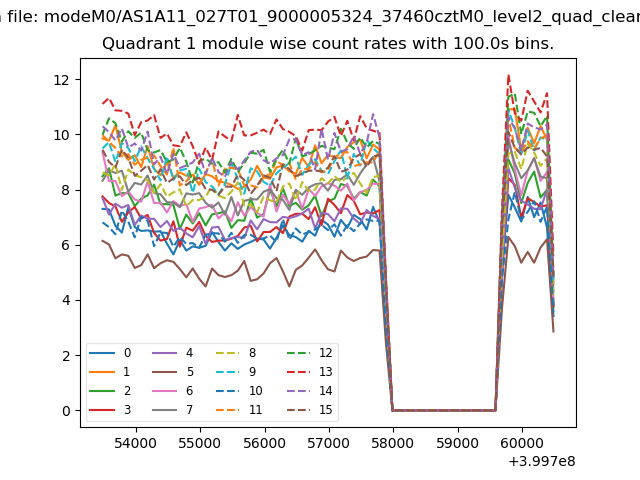
| Module-wise count rates for Quadrant A Data is divided into 100 sec bins |
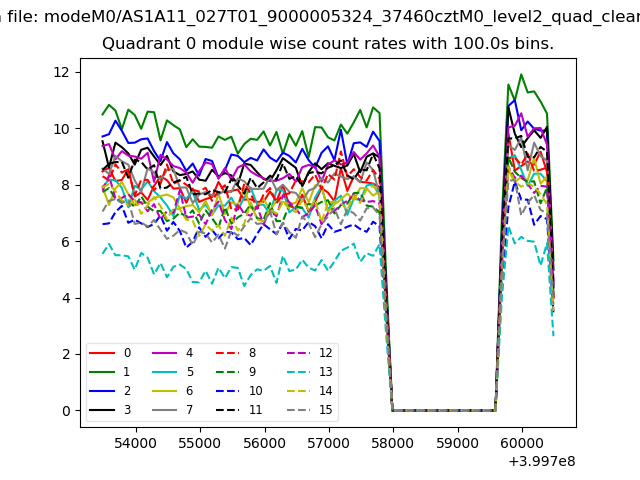 |
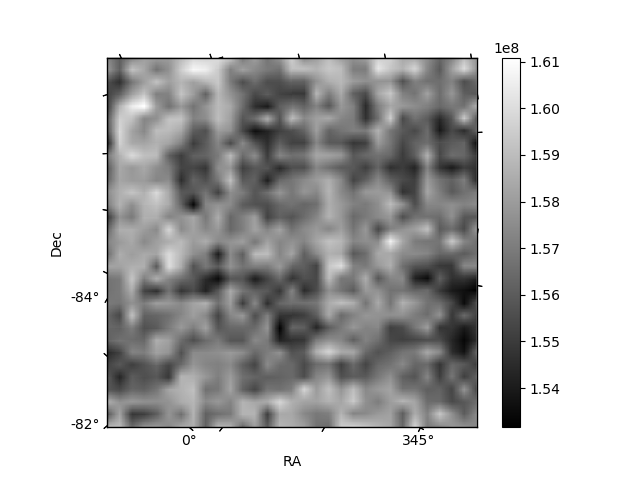 |
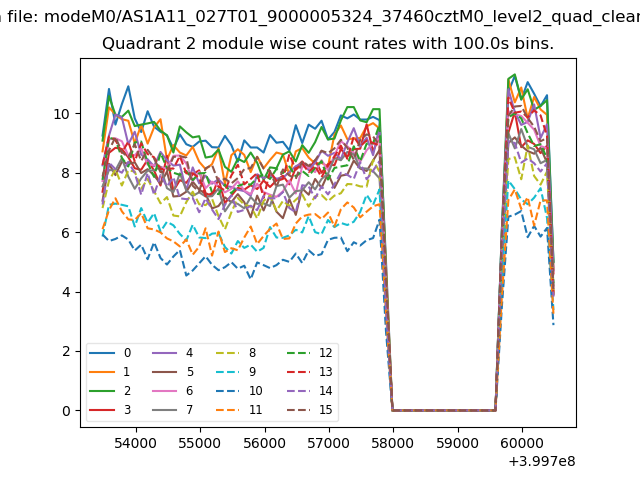
| Module-wise count rates for Quadrant B Data is divided into 100 sec bins |
 |
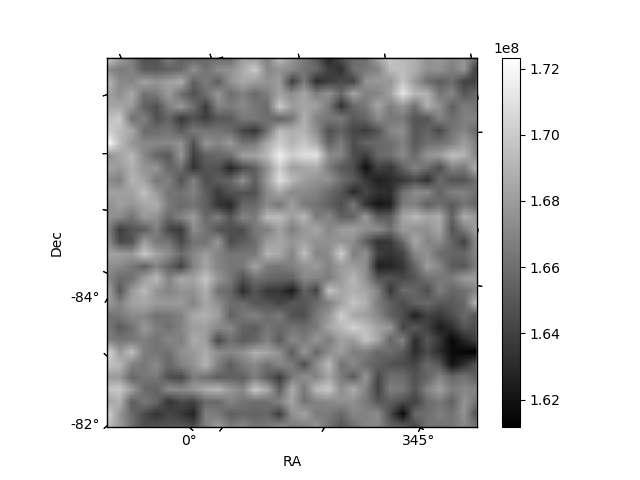 |
| Module-wise count rates for Quadrant C Data is divided into 100 sec bins |
 |
 |
| Module-wise count rates for Quadrant D Data is divided into 100 sec bins |
 |
 |
| Parameter | Plot |
|---|---|
| CZT HV Monitor | 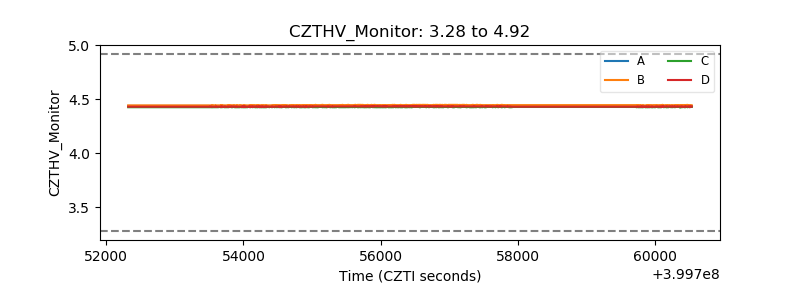 |
| D_VDD | 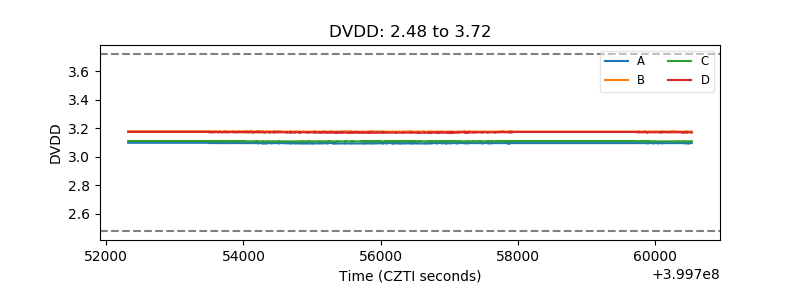 |
| Temperature 1 | 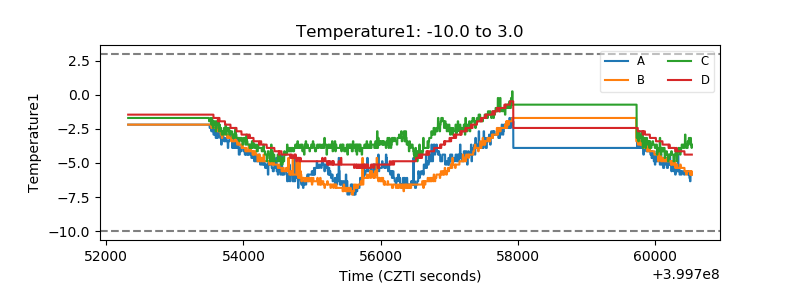 |
| Veto HV Monitor |  |
| Veto LLD |  |
| Alpha Counter | 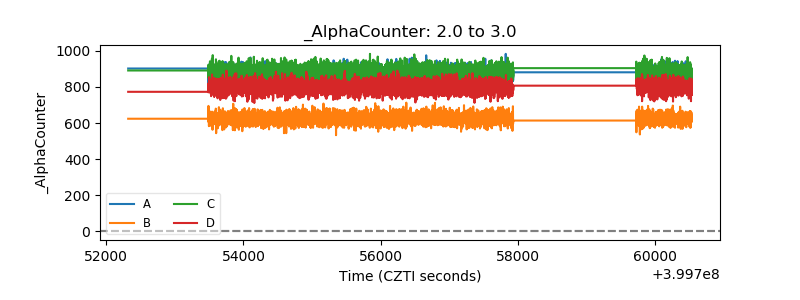 |
| _CPM_Rate |  |
| CZT Counter | 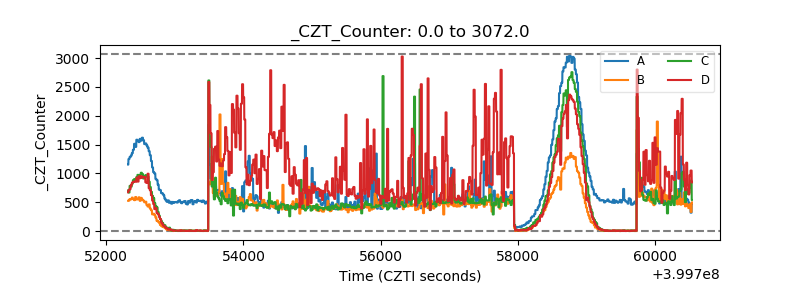 |
| +2.5 Volts monitor |  |
| +5 Volts monitor |  |
| _ROLL_ROT | 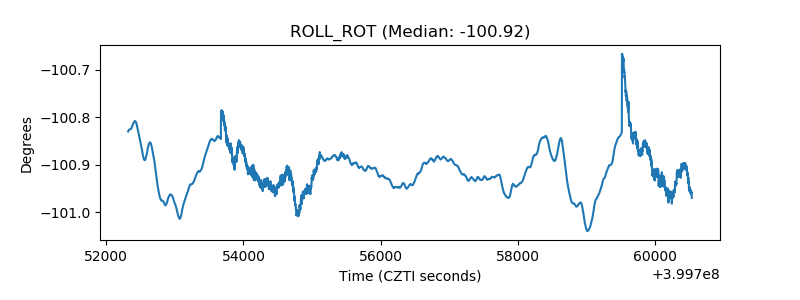 |
| _Roll_DEC | 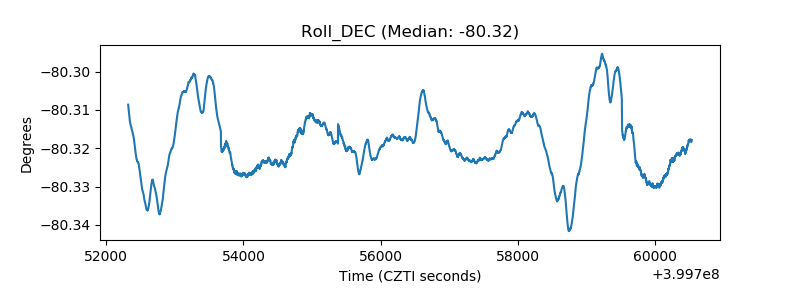 |
| _Roll_RA | 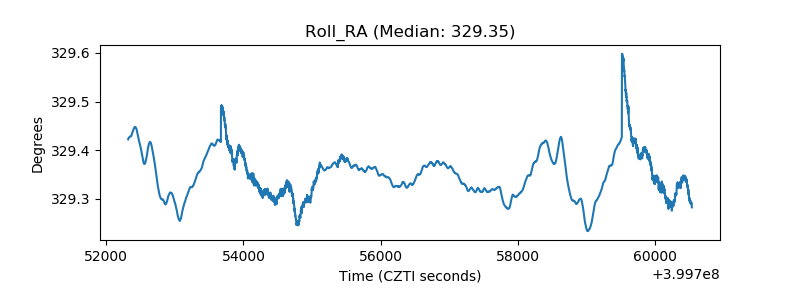 |
| Veto Counter | 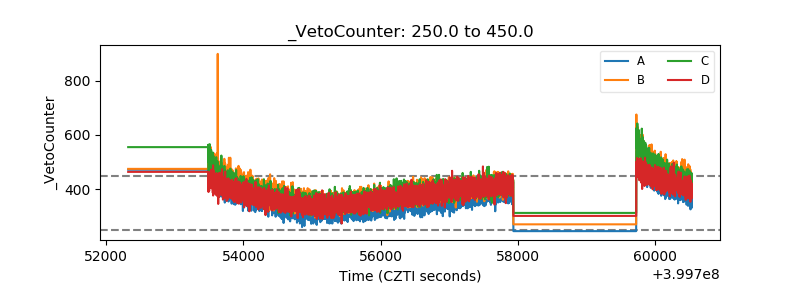 |