| Param | Original file | Final file |
|---|---|---|
| Filename | modeM0/AS1A11_027T01_9000005324_37461cztM0_level2.evt | modeM0/AS1A11_027T01_9000005324_37461cztM0_level2_quad_clean.evt |
| Size (bytes) | 473,129,280 | 100,520,640 |
| Size | 451.2 MB | 95.9 MB |
| Events in quadrant A | 3,040,265 | 678,355 |
| Events in quadrant B | 2,894,246 | 691,581 |
| Events in quadrant C | 3,566,889 | 684,459 |
| Events in quadrant D | 4,479,111 | 629,773 |
| Mode SS | |||
|---|---|---|---|
| Quadrant | BADHDUFLAG | Total packets | Discarded packets |
| A | 0 | 104 | 0 |
| B | 0 | 104 | 0 |
| C | 0 | 104 | 0 |
| D | 0 | 104 | 0 |
| Mode M9 | |||
|---|---|---|---|
| Quadrant | BADHDUFLAG | Total packets | Discarded packets |
| A | 0 | 32 | 0 |
| B | 0 | 32 | 0 |
| C | 0 | 32 | 0 |
| D | 0 | 33 | 0 |
| Mode M0 | |||
|---|---|---|---|
| Quadrant | BADHDUFLAG | Total packets | Discarded packets |
| A | 0 | 12399 | 3 |
| B | 0 | 11921 | 2 |
| C | 0 | 13798 | 2 |
| D | 0 | 16782 | 2 |
| Quadrant | Total seconds | Saturated seconds | Saturation percentage |
|---|---|---|---|
| A | 5141 | 33 | 0.641898% |
| B | 5141 | 138 | 2.684303% |
| C | 5141 | 95 | 1.847890% |
| D | 5141 | 269 | 5.232445% |
Noise dominated data is calculated using 1-second bins in cleaned event files. If a bin has >2000 counts, and if more than 50% of those come from <1% of pixels, then it is considered to be noise-dominated and hence unusable.
| Quadrant | # 1 sec bins | Bins with >0 counts | Bins with >2000 counts | High rate bins dominated by noise | Noise dominated (total time) | Noise dominated (detector-on time) | Marked lightcurve |
|---|---|---|---|---|---|---|---|
| A | 7053 | 5142 | 17 | 17 | 0.24% | 0.33% | 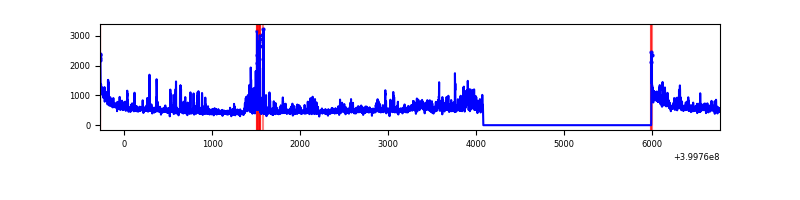 |
| B | 7053 | 5142 | 127 | 127 | 1.80% | 2.47% | 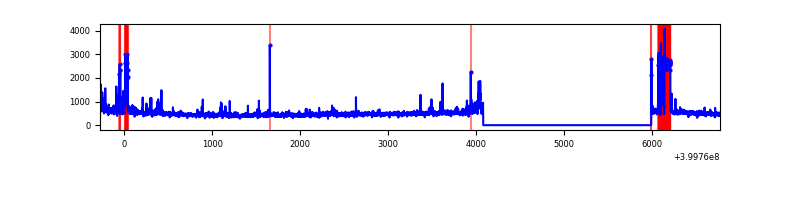 |
| C | 7053 | 5142 | 91 | 91 | 1.29% | 1.77% | 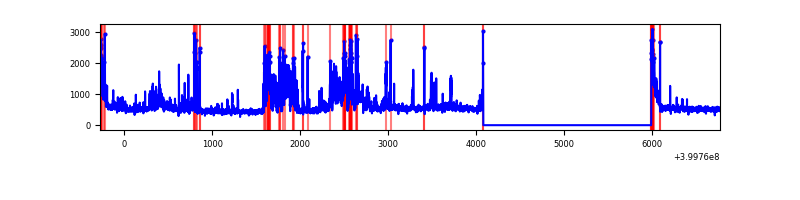 |
| D | 7053 | 5142 | 303 | 303 | 4.30% | 5.89% | 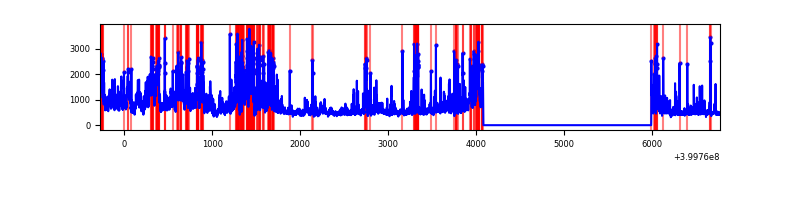 |
Top three noisy pixels from each quadrant. If the there are fewer than three noisy pixels in the level2.evt file, extra rows are filled as -1
| Pixel properties | Quadrant properties | ||||||
|---|---|---|---|---|---|---|---|
| Quadrant | DetID | PixID | Counts | Sigma | Mean | Median | Sigma |
| A | 15 | 222 | 350205 | 2949.58 | 590 | 578 | 118.5 |
| A | 10 | 83 | 272550 | 2294.45 | 590 | 578 | 118.5 |
| A | 13 | 248 | 85698 | 718.1 | 590 | 578 | 118.5 |
| B | 5 | 200 | 297027 | 2673.16 | 586 | 571 | 110.9 |
| B | 5 | 184 | 90440 | 810.35 | 586 | 571 | 110.9 |
| B | 4 | 171 | 79687 | 713.39 | 586 | 571 | 110.9 |
| C | 0 | 207 | 807873 | 6045.01 | 583 | 588 | 133.5 |
| C | 15 | 214 | 217705 | 1625.79 | 583 | 588 | 133.5 |
| C | 0 | 10 | 145725 | 1086.8 | 583 | 588 | 133.5 |
| D | 12 | 235 | 1283644 | 9364.18 | 565 | 551 | 137.0 |
| D | 13 | 249 | 517717 | 3774.35 | 565 | 551 | 137.0 |
| D | 2 | 249 | 255647 | 1861.72 | 565 | 551 | 137.0 |
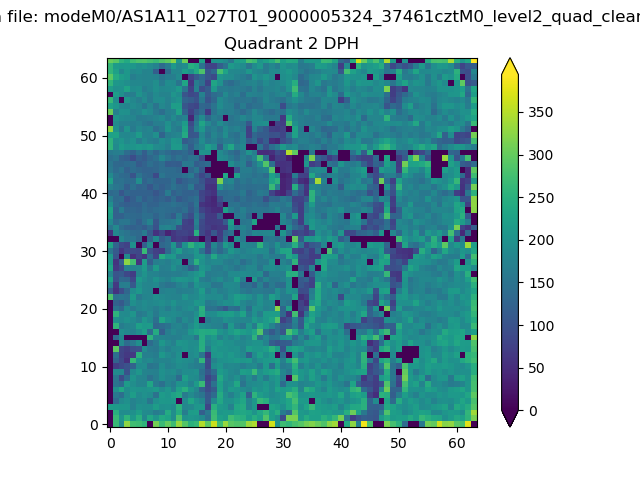
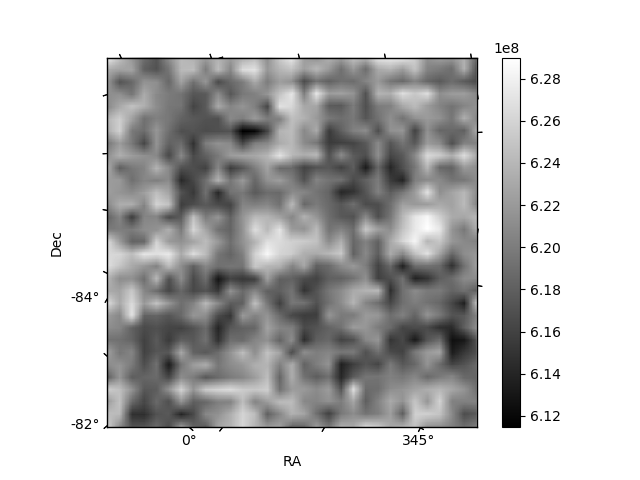
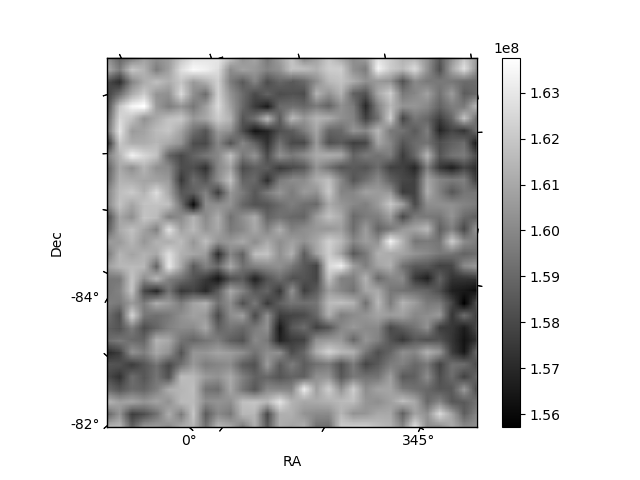
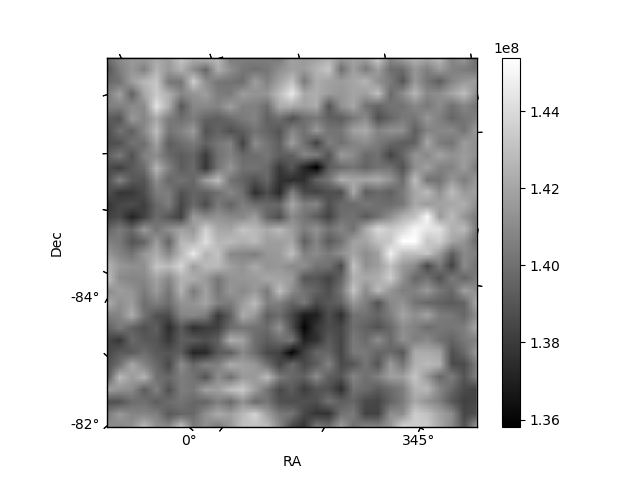
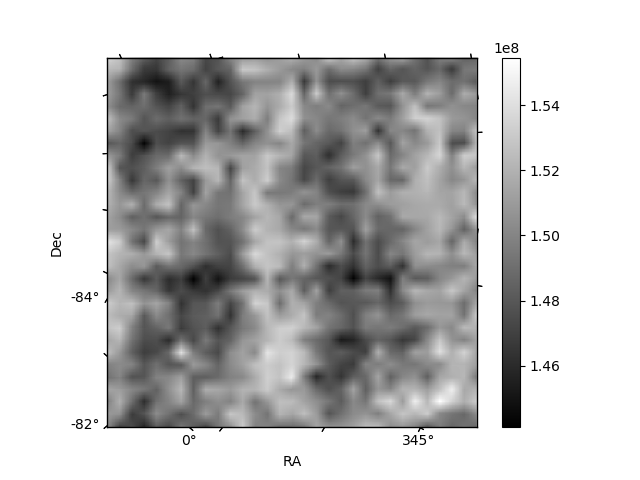
Histogram calculated using DETX and DETY for each event in the final _common_clean file
| Quadrant A | 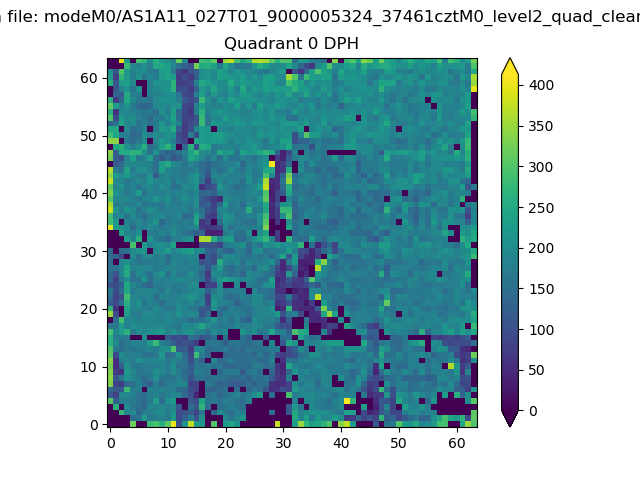 |
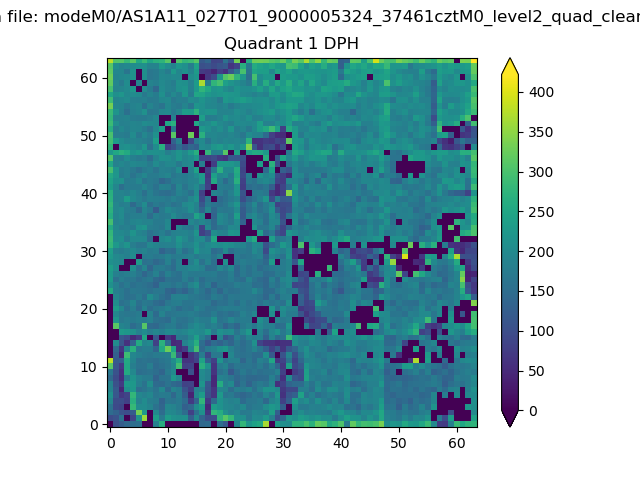 |
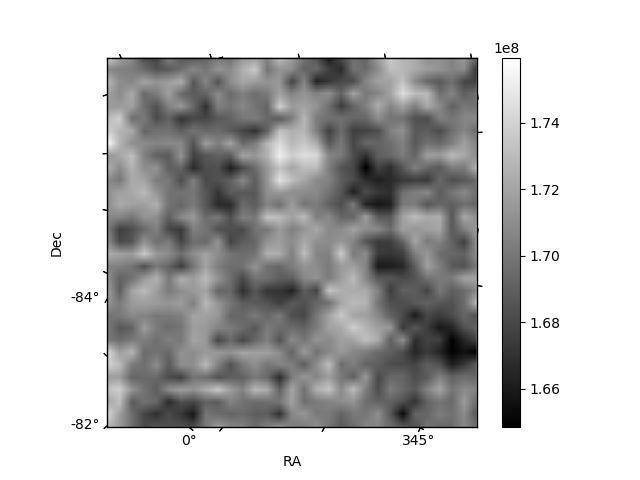
Quadrant B |
|---|---|---|---|
| Quadrant D | 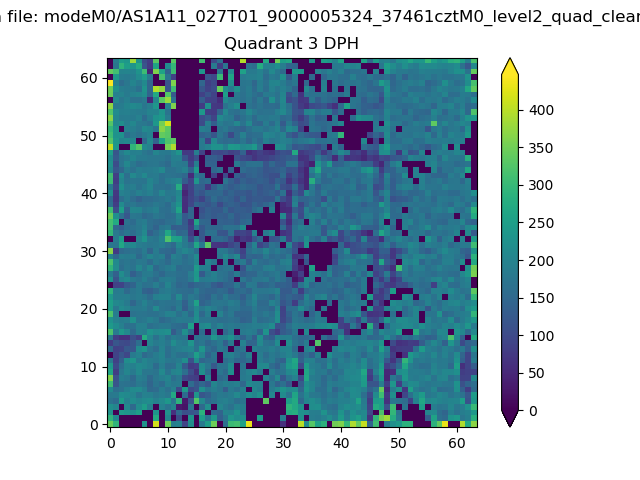 |
 |
Quadrant C |
| Plot type | Count rate plots | Images |
|---|---|---|
| Comparison with Poisson distribution Blue bars denote a histogram of data divided into 1 sec bins. Red curve is a Poisson curve with rate = median count rate of data. |
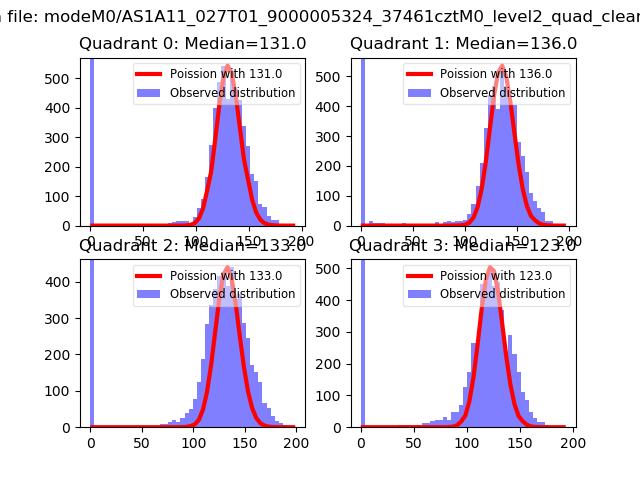 |
 |
| Quadrant-wise count rates Data is divided into 100 sec bins |
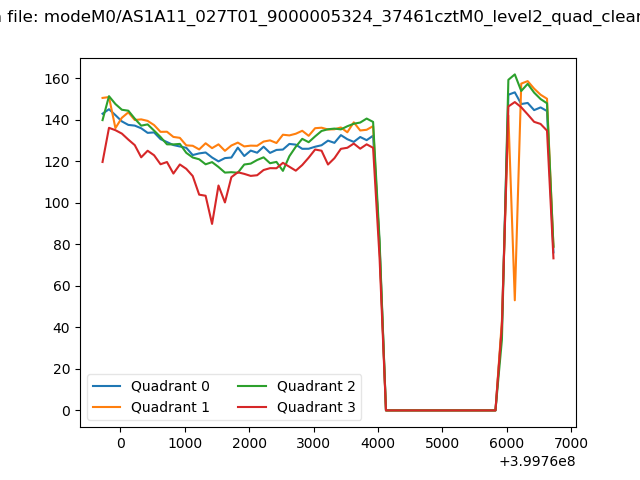 |
|
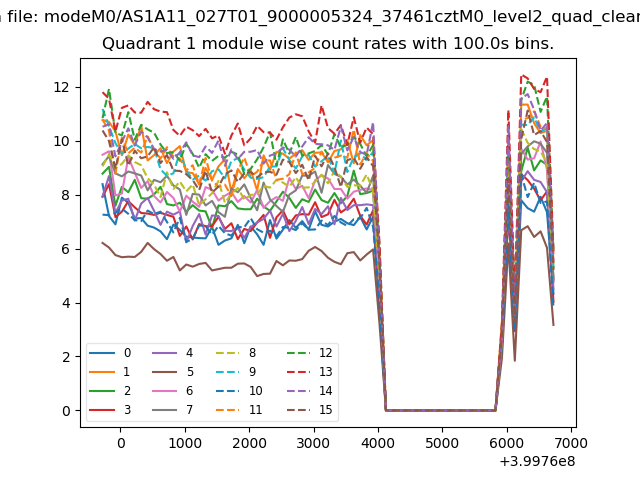
| Module-wise count rates for Quadrant A Data is divided into 100 sec bins |
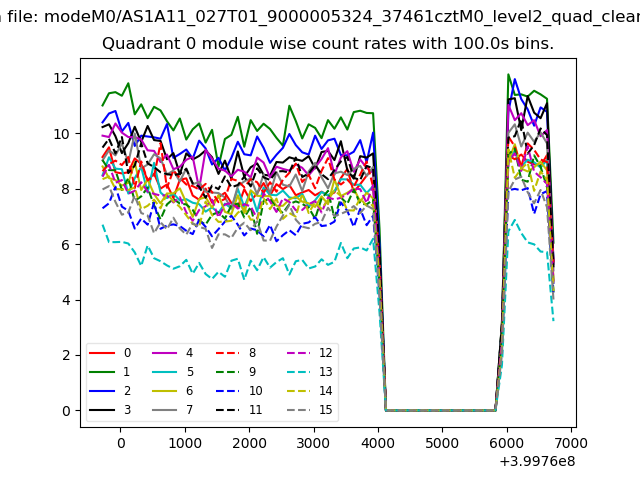 |
 |
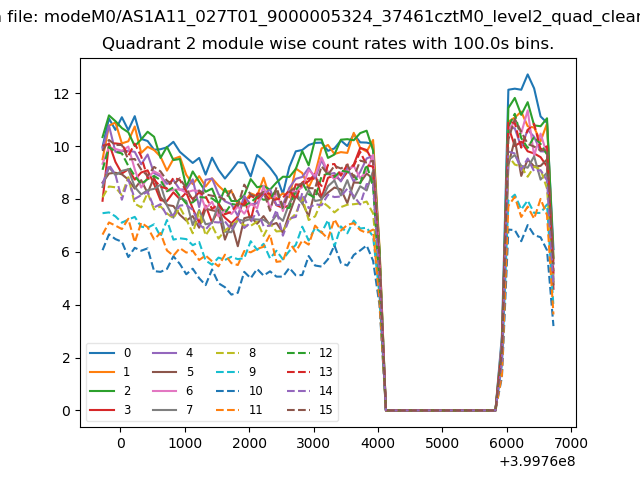
| Module-wise count rates for Quadrant B Data is divided into 100 sec bins |
 |
 |
| Module-wise count rates for Quadrant C Data is divided into 100 sec bins |
 |
 |
| Module-wise count rates for Quadrant D Data is divided into 100 sec bins |
 |
 |
| Parameter | Plot |
|---|---|
| CZT HV Monitor | 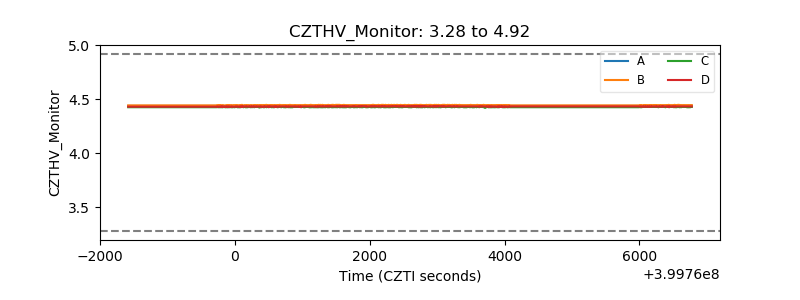 |
| D_VDD | 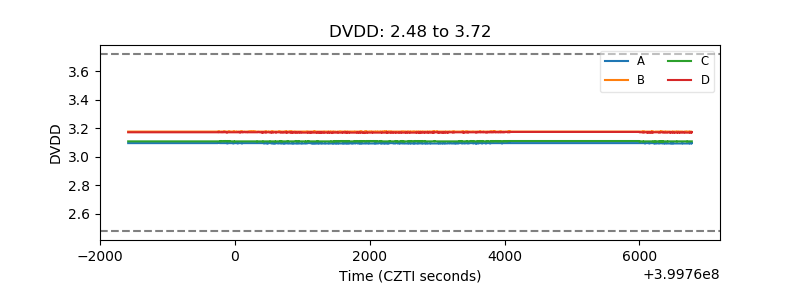 |
| Temperature 1 | 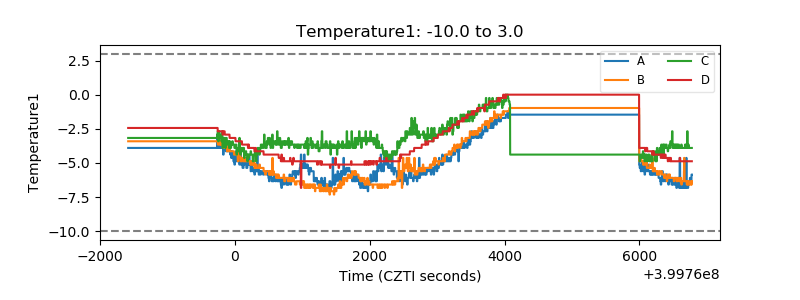 |
| Veto HV Monitor | 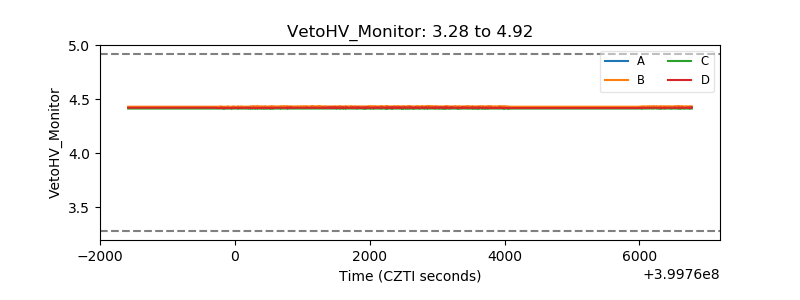 |
| Veto LLD | 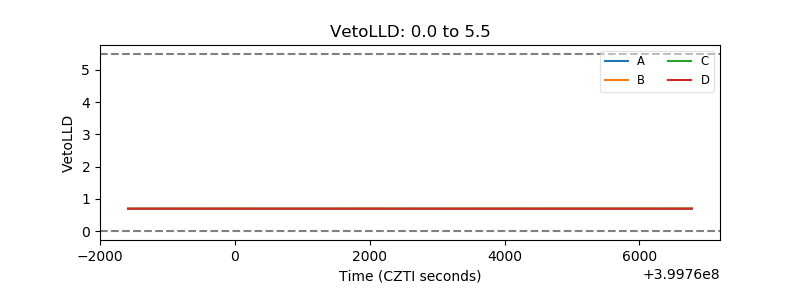 |
| Alpha Counter | 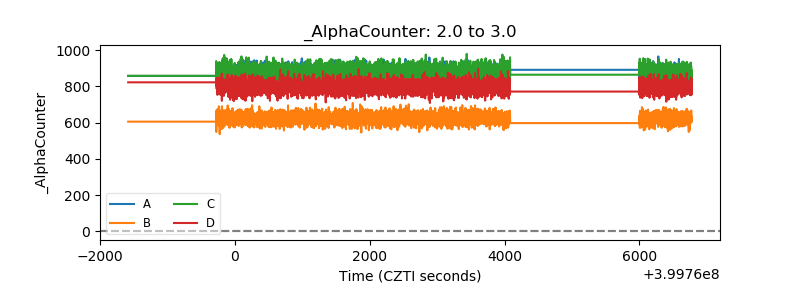 |
| _CPM_Rate | 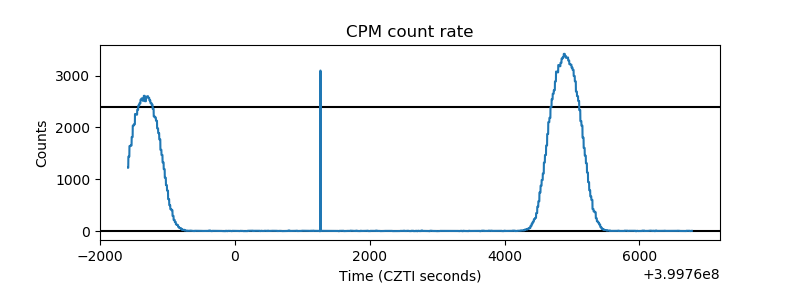 |
| CZT Counter |  |
| +2.5 Volts monitor | 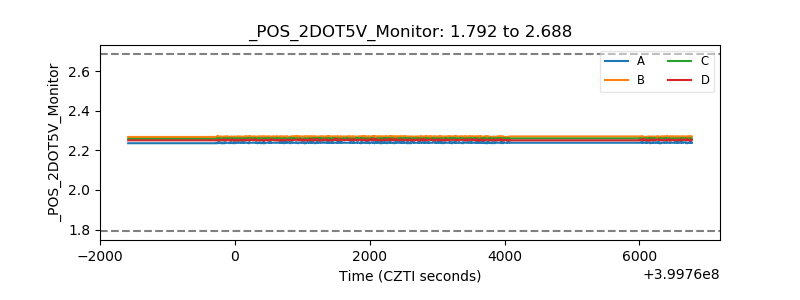 |
| +5 Volts monitor | 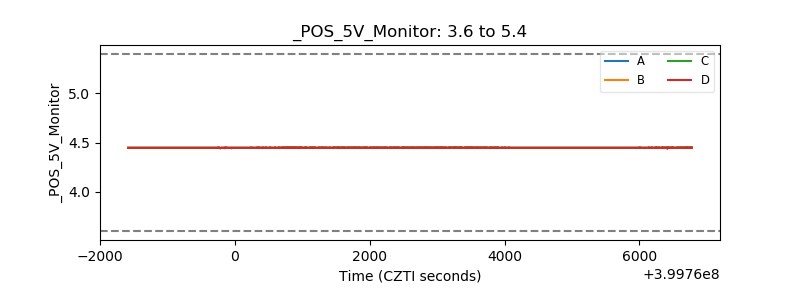 |
| _ROLL_ROT |  |
| _Roll_DEC | 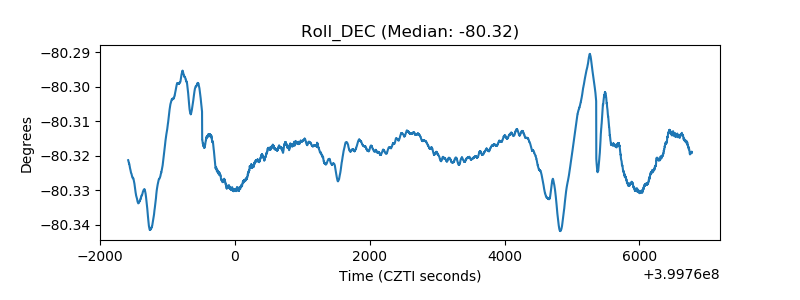 |
| _Roll_RA | 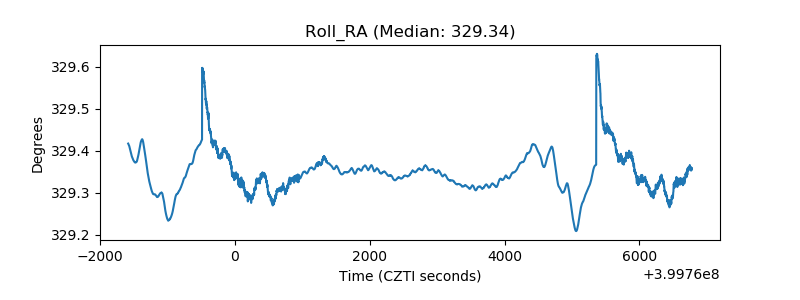 |
| Veto Counter | 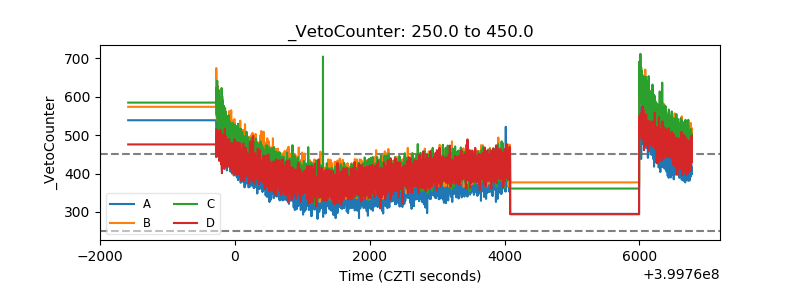 |