| Param | Original file | Final file |
|---|---|---|
| Filename | modeM0/AS1A11_027T01_9000005324_37462cztM0_level2.evt | modeM0/AS1A11_027T01_9000005324_37462cztM0_level2_quad_clean.evt |
| Size (bytes) | 463,700,160 | 107,337,600 |
| Size | 442.2 MB | 102.4 MB |
| Events in quadrant A | 3,620,651 | 721,649 |
| Events in quadrant B | 3,035,506 | 744,691 |
| Events in quadrant C | 2,902,537 | 743,039 |
| Events in quadrant D | 4,124,834 | 670,268 |
| Mode SS | |||
|---|---|---|---|
| Quadrant | BADHDUFLAG | Total packets | Discarded packets |
| A | 0 | 110 | 0 |
| B | 0 | 110 | 0 |
| C | 0 | 110 | 0 |
| D | 0 | 110 | 0 |
| Mode M9 | |||
|---|---|---|---|
| Quadrant | BADHDUFLAG | Total packets | Discarded packets |
| A | 0 | 34 | 0 |
| B | 0 | 34 | 0 |
| C | 0 | 34 | 0 |
| D | 0 | 35 | 0 |
| Mode M0 | |||
|---|---|---|---|
| Quadrant | BADHDUFLAG | Total packets | Discarded packets |
| A | 0 | 14335 | 3 |
| B | 0 | 12305 | 2 |
| C | 0 | 11570 | 2 |
| D | 0 | 15774 | 2 |
| Quadrant | Total seconds | Saturated seconds | Saturation percentage |
|---|---|---|---|
| A | 5293 | 38 | 0.717929% |
| B | 5293 | 165 | 3.117325% |
| C | 5293 | 58 | 1.095787% |
| D | 5293 | 442 | 8.350652% |
Noise dominated data is calculated using 1-second bins in cleaned event files. If a bin has >2000 counts, and if more than 50% of those come from <1% of pixels, then it is considered to be noise-dominated and hence unusable.
| Quadrant | # 1 sec bins | Bins with >0 counts | Bins with >2000 counts | High rate bins dominated by noise | Noise dominated (total time) | Noise dominated (detector-on time) | Marked lightcurve |
|---|---|---|---|---|---|---|---|
| A | 7327 | 5294 | 23 | 23 | 0.31% | 0.43% | 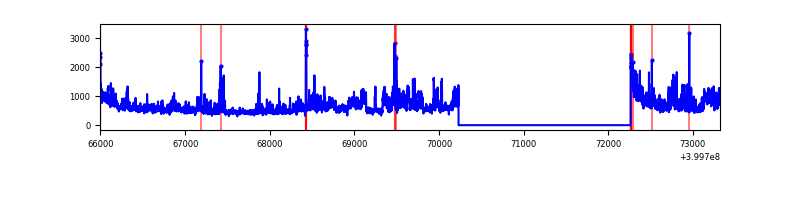 |
| B | 7327 | 5294 | 152 | 152 | 2.07% | 2.87% | 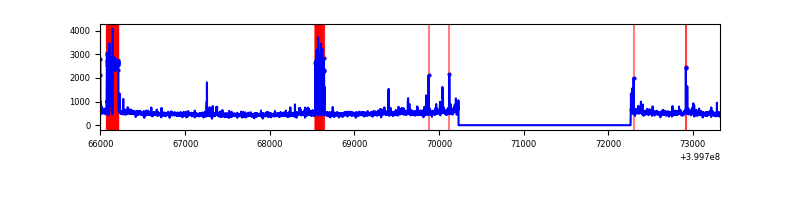 |
| C | 7327 | 5294 | 48 | 48 | 0.66% | 0.91% | 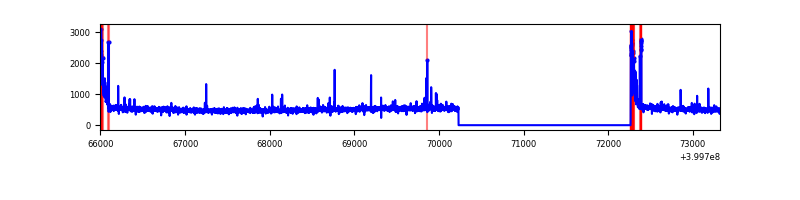 |
| D | 7327 | 5294 | 373 | 373 | 5.09% | 7.05% | 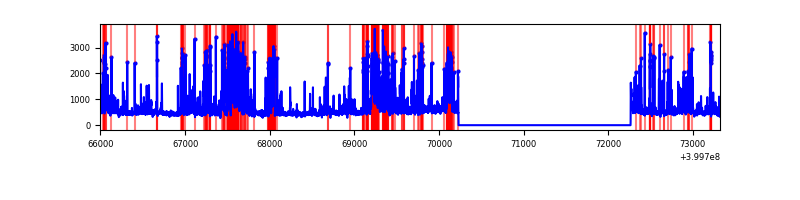 |
Top three noisy pixels from each quadrant. If the there are fewer than three noisy pixels in the level2.evt file, extra rows are filled as -1
| Pixel properties | Quadrant properties | ||||||
|---|---|---|---|---|---|---|---|
| Quadrant | DetID | PixID | Counts | Sigma | Mean | Median | Sigma |
| A | 15 | 222 | 727342 | 5846.94 | 621 | 610 | 124.3 |
| A | 10 | 83 | 269507 | 2163.42 | 621 | 610 | 124.3 |
| A | 13 | 248 | 103961 | 831.51 | 621 | 610 | 124.3 |
| B | 5 | 200 | 291034 | 2509.86 | 619 | 603 | 115.7 |
| B | 5 | 172 | 180435 | 1554.08 | 619 | 603 | 115.7 |
| B | 4 | 171 | 32231 | 273.32 | 619 | 603 | 115.7 |
| C | 15 | 214 | 224698 | 1583.5 | 621 | 628 | 141.5 |
| C | 0 | 10 | 158103 | 1112.87 | 621 | 628 | 141.5 |
| C | 14 | 254 | 29170 | 201.71 | 621 | 628 | 141.5 |
| D | 13 | 249 | 1058718 | 7435.18 | 591 | 575 | 142.3 |
| D | 2 | 249 | 121030 | 846.39 | 591 | 575 | 142.3 |
| D | 2 | 153 | 119430 | 835.15 | 591 | 575 | 142.3 |
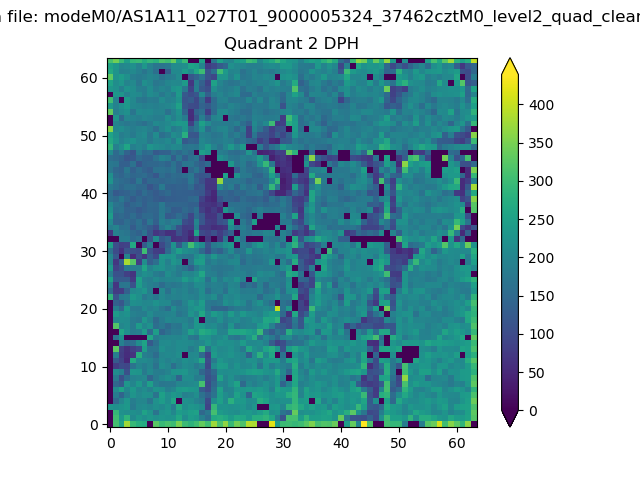
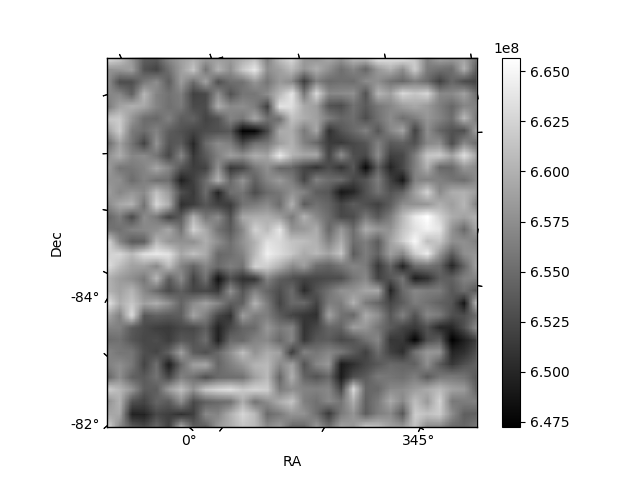
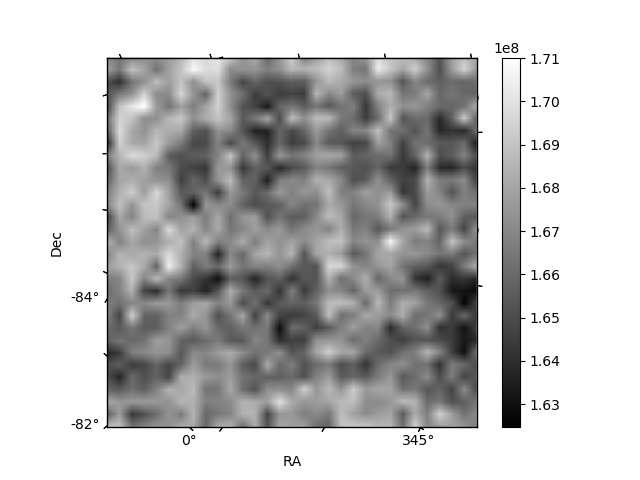
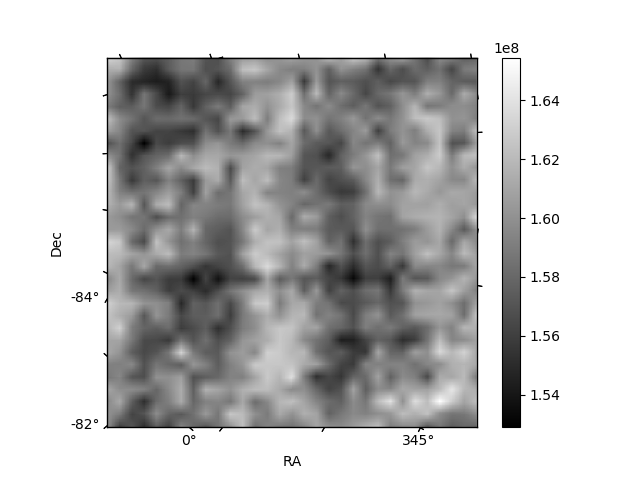
Histogram calculated using DETX and DETY for each event in the final _common_clean file
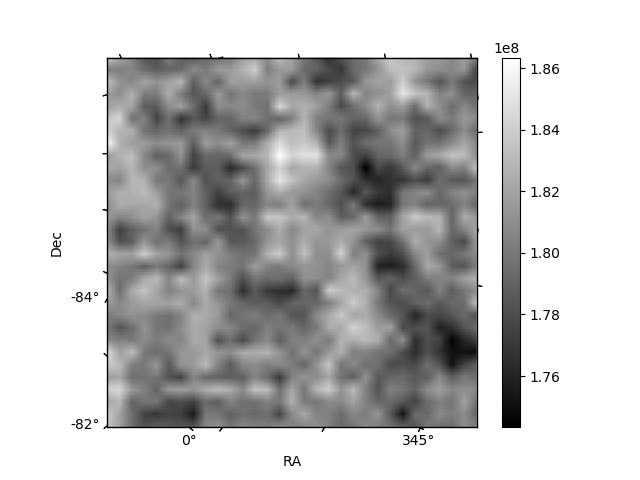
| Quadrant A | 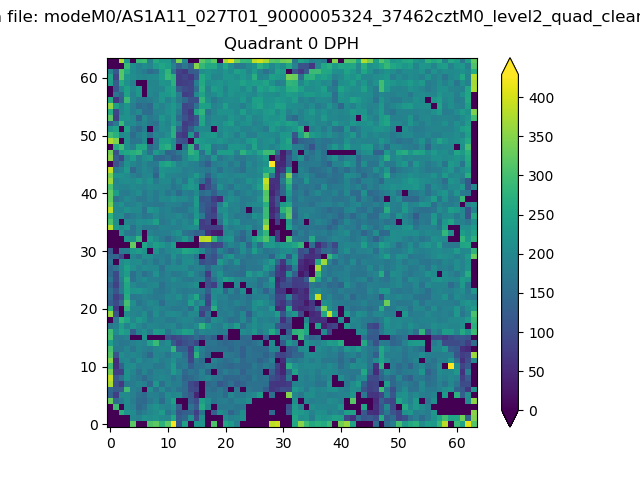 |
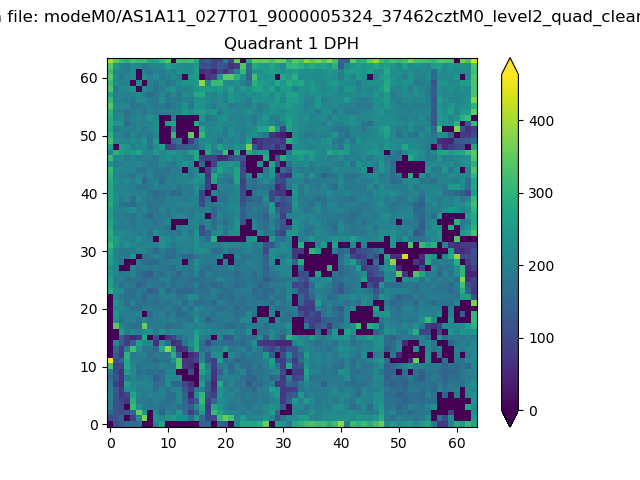 |
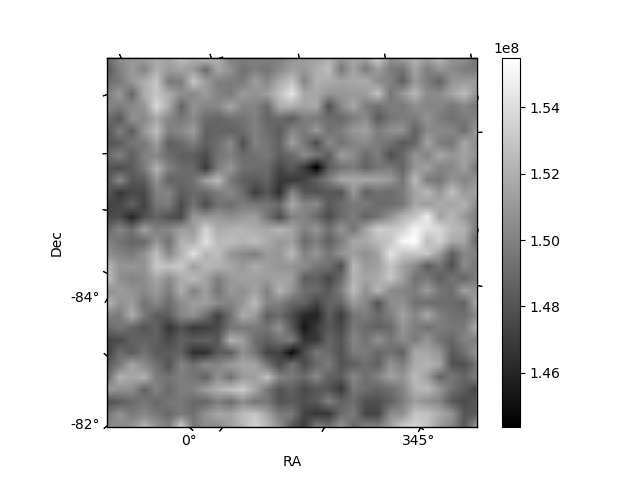
Quadrant B |
|---|---|---|---|
| Quadrant D | 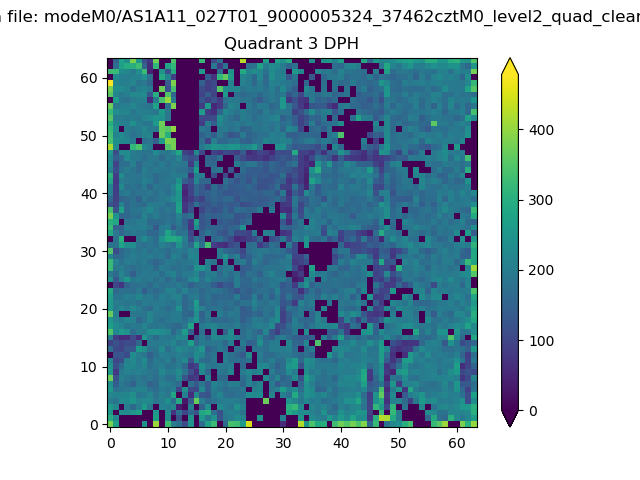 |
 |
Quadrant C |
| Plot type | Count rate plots | Images |
|---|---|---|
| Comparison with Poisson distribution Blue bars denote a histogram of data divided into 1 sec bins. Red curve is a Poisson curve with rate = median count rate of data. |
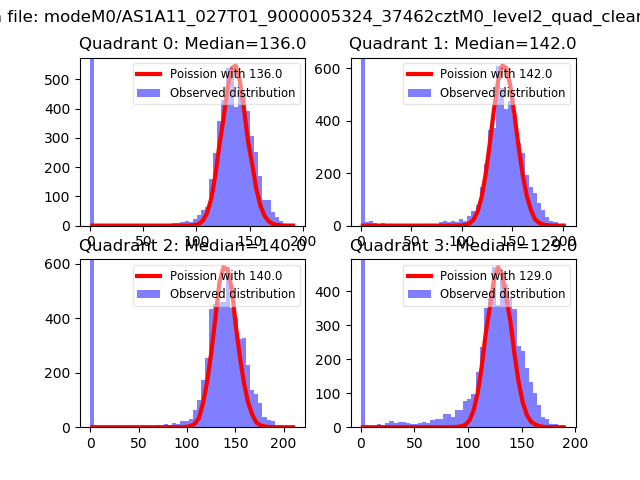 |
 |
| Quadrant-wise count rates Data is divided into 100 sec bins |
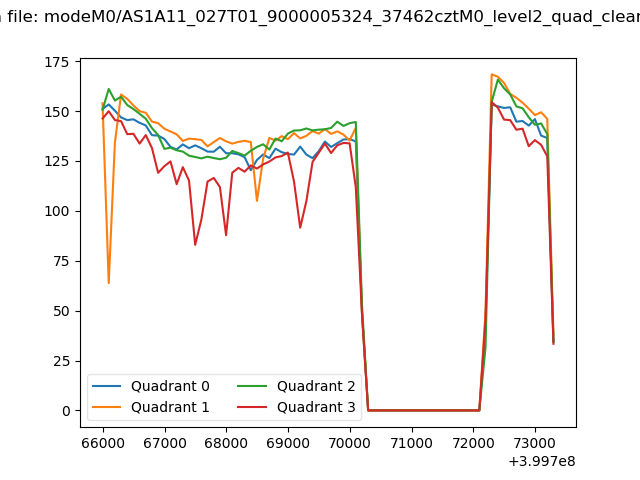 |
|
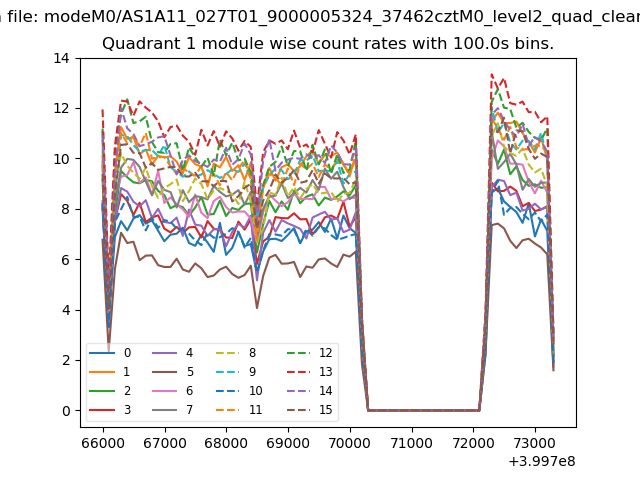
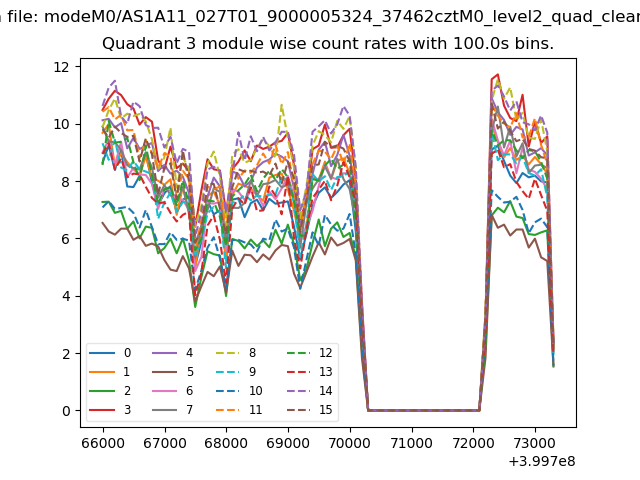
| Module-wise count rates for Quadrant A Data is divided into 100 sec bins |
 |
 |
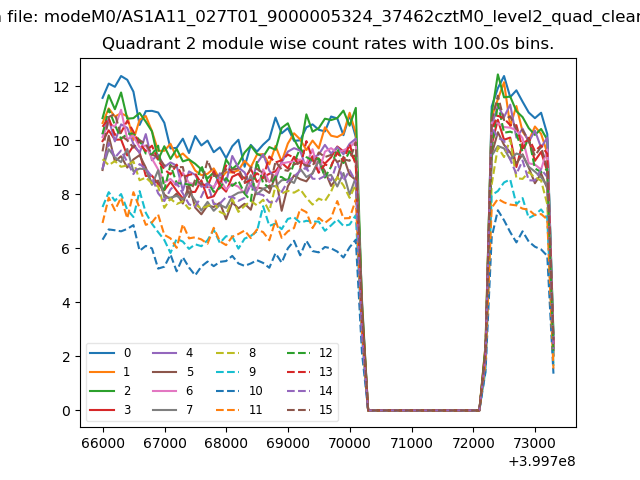
| Module-wise count rates for Quadrant B Data is divided into 100 sec bins |
 |
 |
| Module-wise count rates for Quadrant C Data is divided into 100 sec bins |
 |
 |
| Module-wise count rates for Quadrant D Data is divided into 100 sec bins |
 |
 |
| Parameter | Plot |
|---|---|
| CZT HV Monitor |  |
| D_VDD | 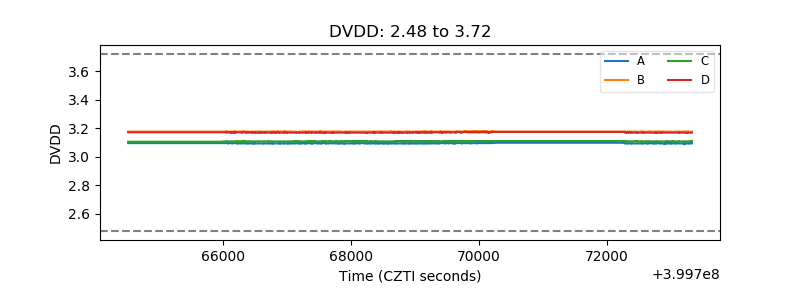 |
| Temperature 1 | 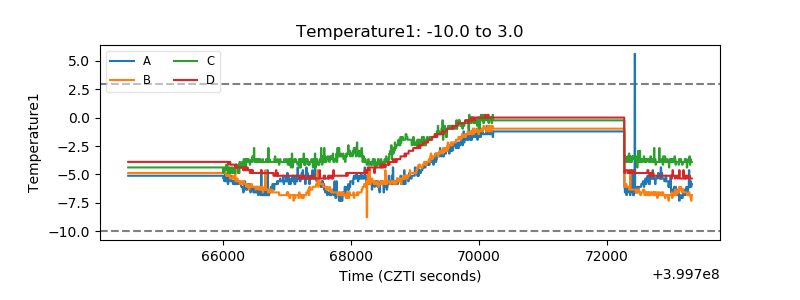 |
| Veto HV Monitor | 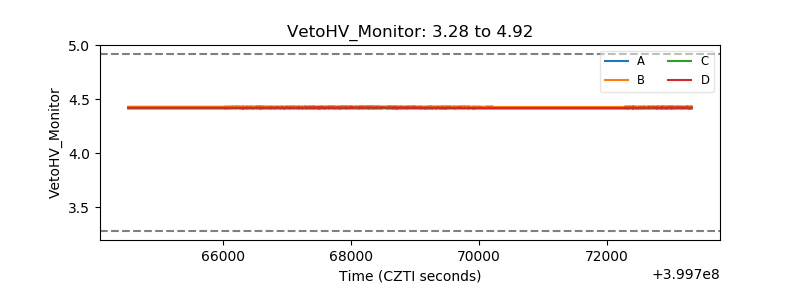 |
| Veto LLD | 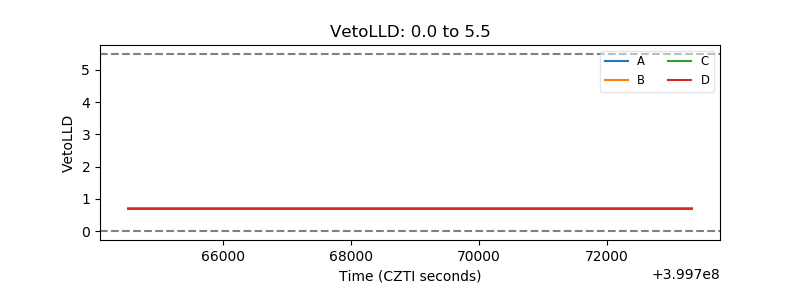 |
| Alpha Counter | 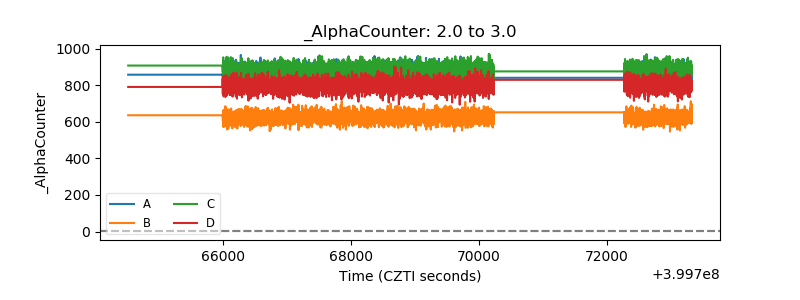 |
| _CPM_Rate | 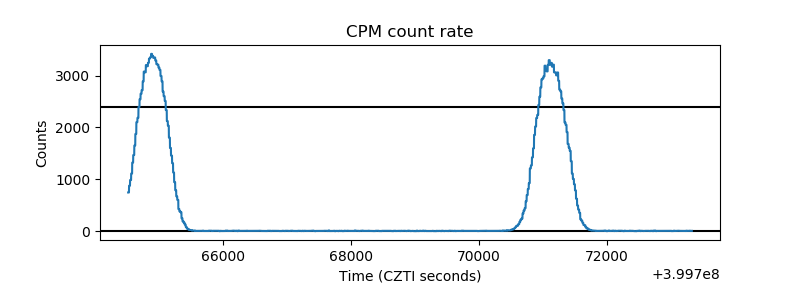 |
| CZT Counter | 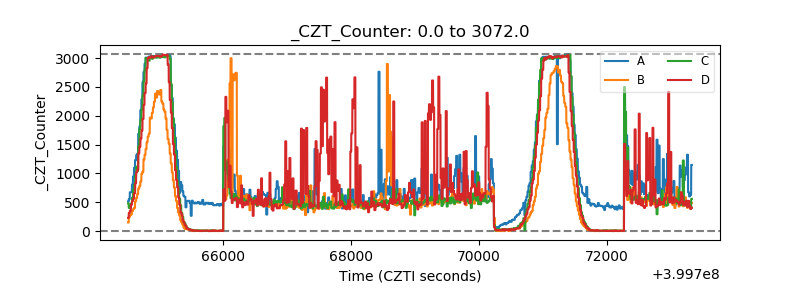 |
| +2.5 Volts monitor | 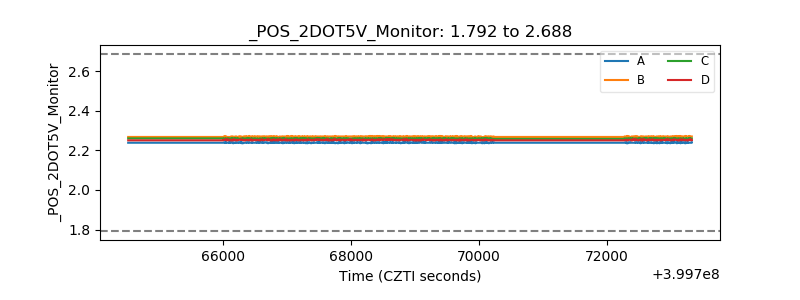 |
| +5 Volts monitor | 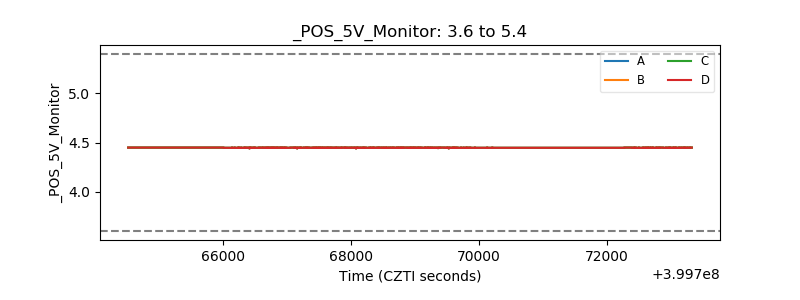 |
| _ROLL_ROT | 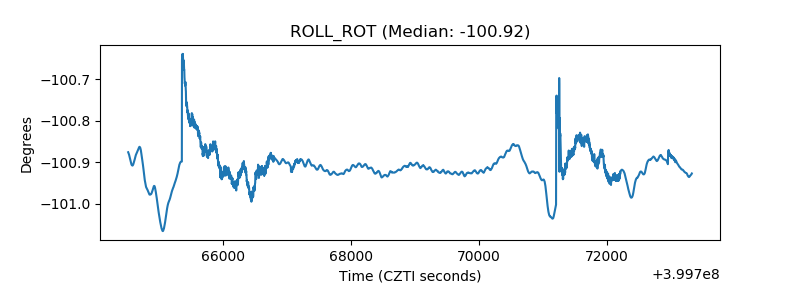 |
| _Roll_DEC | 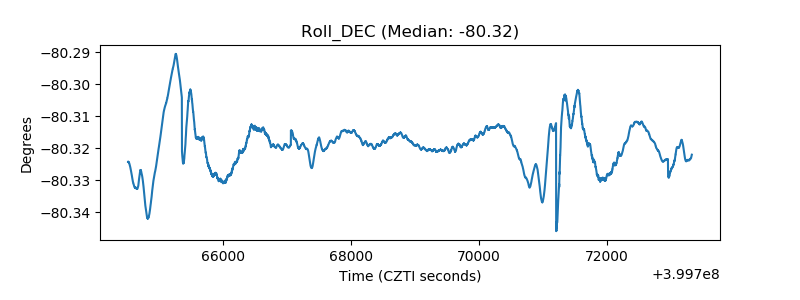 |
| _Roll_RA | 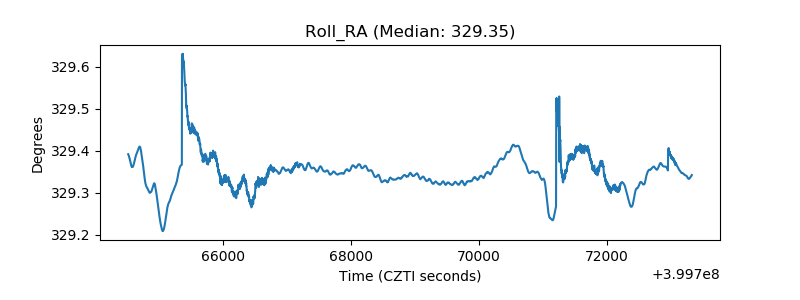 |
| Veto Counter | 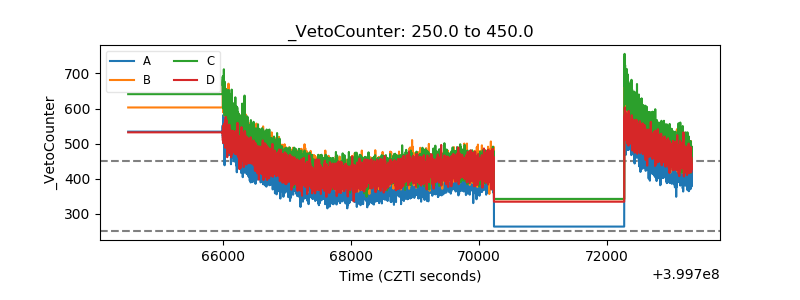 |