| Param | Original file | Final file |
|---|---|---|
| Filename | modeM0/AS1A11_027T01_9000005324_37464cztM0_level2.evt | modeM0/AS1A11_027T01_9000005324_37464cztM0_level2_quad_clean.evt |
| Size (bytes) | 490,933,440 | 103,423,680 |
| Size | 468.2 MB | 98.6 MB |
| Events in quadrant A | 4,161,566 | 687,021 |
| Events in quadrant B | 2,817,039 | 722,445 |
| Events in quadrant C | 2,921,420 | 716,567 |
| Events in quadrant D | 4,617,189 | 643,361 |
| Mode SS | |||
|---|---|---|---|
| Quadrant | BADHDUFLAG | Total packets | Discarded packets |
| A | 0 | 106 | 0 |
| B | 0 | 106 | 0 |
| C | 0 | 106 | 0 |
| D | 0 | 106 | 0 |
| Mode M9 | |||
|---|---|---|---|
| Quadrant | BADHDUFLAG | Total packets | Discarded packets |
| A | 0 | 31 | 0 |
| B | 0 | 31 | 0 |
| C | 0 | 31 | 0 |
| D | 0 | 32 | 0 |
| Mode M0 | |||
|---|---|---|---|
| Quadrant | BADHDUFLAG | Total packets | Discarded packets |
| A | 0 | 15982 | 3 |
| B | 0 | 11577 | 2 |
| C | 0 | 11530 | 2 |
| D | 0 | 17124 | 2 |
| Quadrant | Total seconds | Saturated seconds | Saturation percentage |
|---|---|---|---|
| A | 5176 | 48 | 0.927357% |
| B | 5176 | 42 | 0.811437% |
| C | 5176 | 68 | 1.313756% |
| D | 5176 | 554 | 10.703246% |
Noise dominated data is calculated using 1-second bins in cleaned event files. If a bin has >2000 counts, and if more than 50% of those come from <1% of pixels, then it is considered to be noise-dominated and hence unusable.
| Quadrant | # 1 sec bins | Bins with >0 counts | Bins with >2000 counts | High rate bins dominated by noise | Noise dominated (total time) | Noise dominated (detector-on time) | Marked lightcurve |
|---|---|---|---|---|---|---|---|
| A | 7298 | 5177 | 27 | 27 | 0.37% | 0.52% | 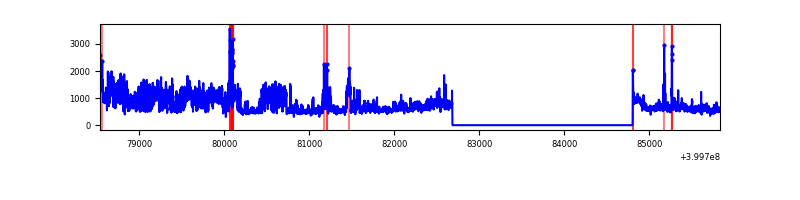 |
| B | 7298 | 5177 | 27 | 27 | 0.37% | 0.52% | 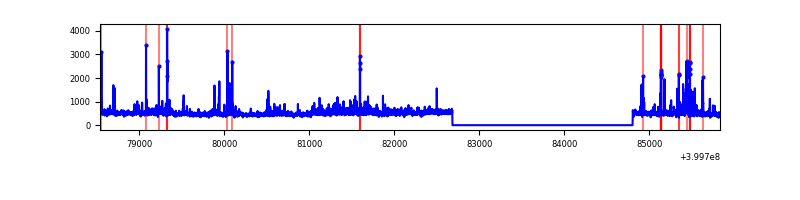 |
| C | 7298 | 5177 | 52 | 52 | 0.71% | 1.00% | 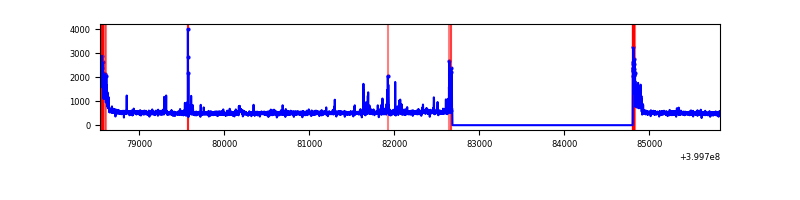 |
| D | 7297 | 5176 | 510 | 510 | 6.99% | 9.85% | 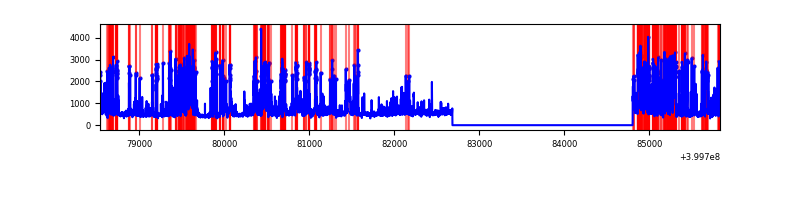 |
Top three noisy pixels from each quadrant. If the there are fewer than three noisy pixels in the level2.evt file, extra rows are filled as -1
| Pixel properties | Quadrant properties | ||||||
|---|---|---|---|---|---|---|---|
| Quadrant | DetID | PixID | Counts | Sigma | Mean | Median | Sigma |
| A | 15 | 222 | 1389268 | 11605.24 | 604 | 594 | 119.7 |
| A | 10 | 83 | 274814 | 2291.67 | 604 | 594 | 119.7 |
| A | 13 | 248 | 119940 | 997.38 | 604 | 594 | 119.7 |
| B | 5 | 172 | 181882 | 1597.57 | 610 | 594 | 113.5 |
| B | 0 | 213 | 112331 | 984.67 | 610 | 594 | 113.5 |
| B | 4 | 171 | 27843 | 240.13 | 610 | 594 | 113.5 |
| C | 15 | 214 | 222234 | 1591.11 | 606 | 611 | 139.3 |
| C | 0 | 10 | 211204 | 1511.92 | 606 | 611 | 139.3 |
| C | 14 | 254 | 100934 | 720.25 | 606 | 611 | 139.3 |
| D | 13 | 249 | 1765585 | 12610.71 | 579 | 565 | 140.0 |
| D | 4 | 239 | 209179 | 1490.5 | 579 | 565 | 140.0 |
| D | 12 | 227 | 135176 | 961.77 | 579 | 565 | 140.0 |
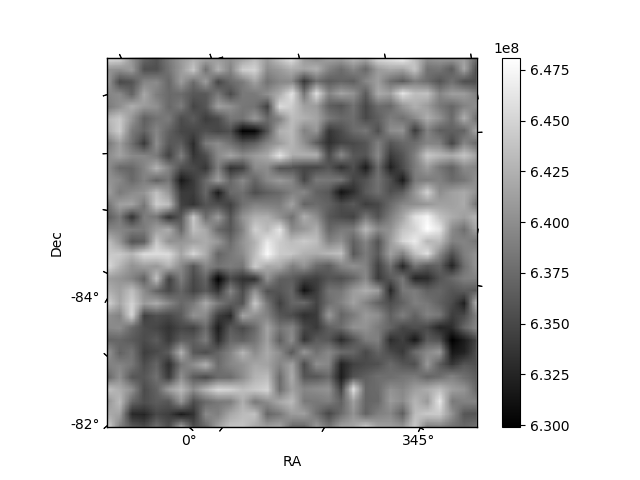
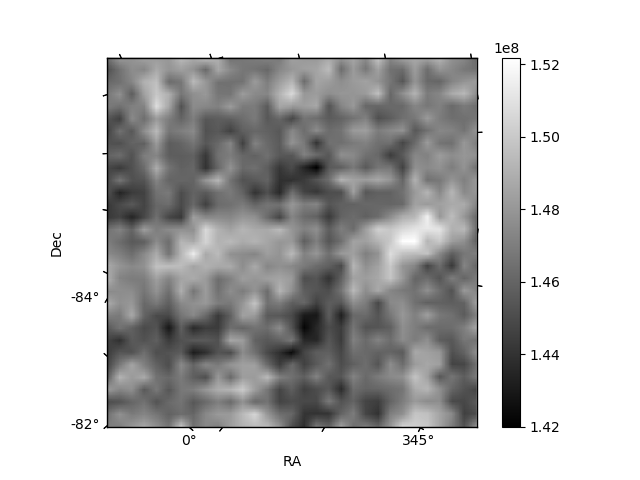
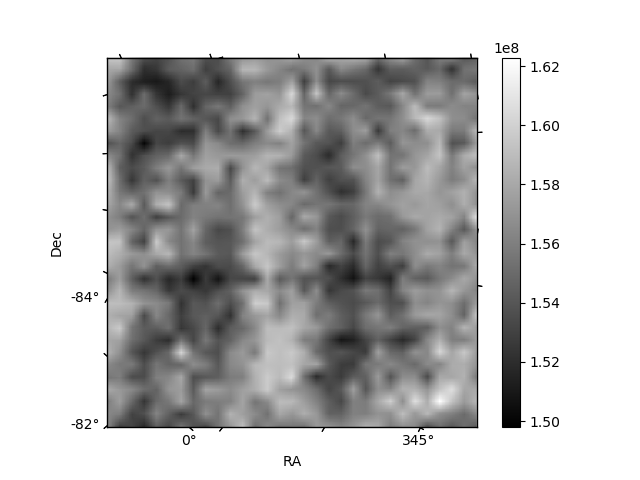
Histogram calculated using DETX and DETY for each event in the final _common_clean file
| Quadrant A | 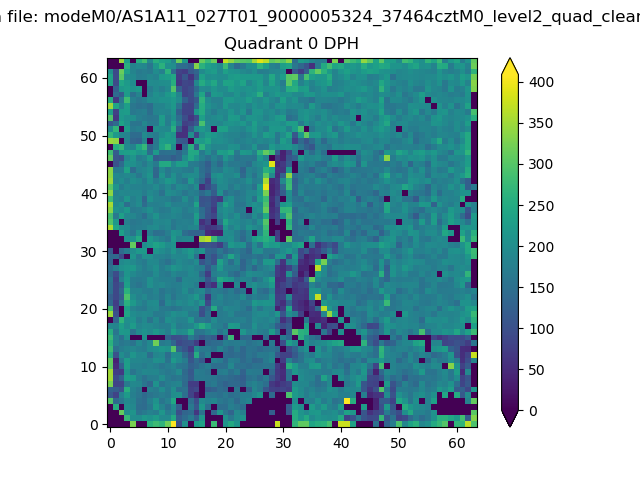 |
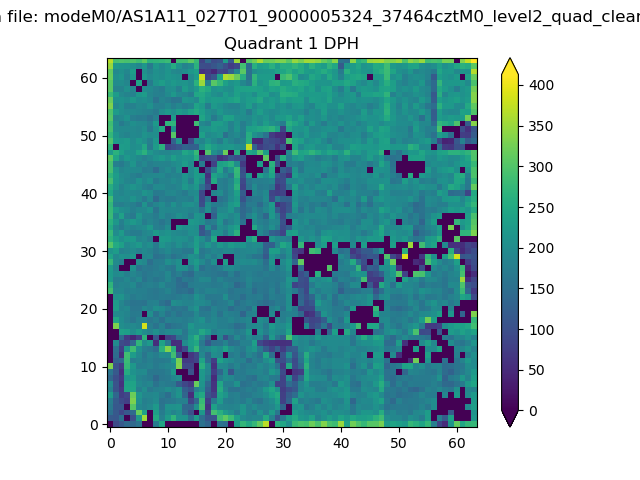 |
Quadrant B |
|---|---|---|---|
| Quadrant D | 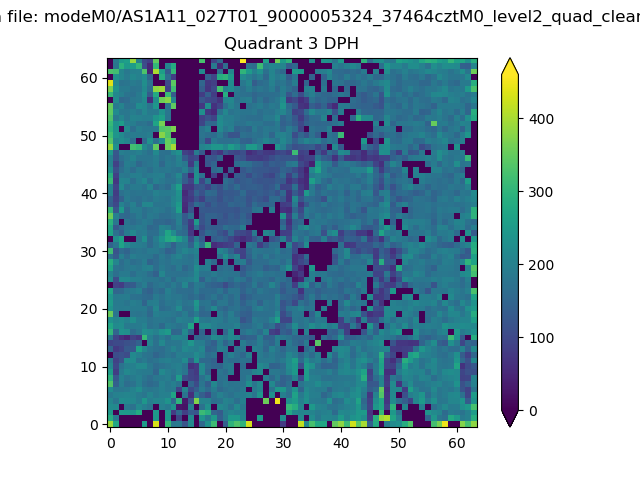 |
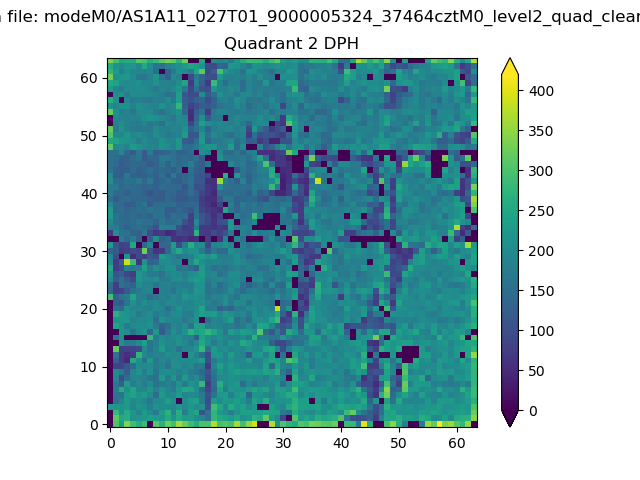 |
Quadrant C |
| Plot type | Count rate plots | Images |
|---|---|---|
| Comparison with Poisson distribution Blue bars denote a histogram of data divided into 1 sec bins. Red curve is a Poisson curve with rate = median count rate of data. |
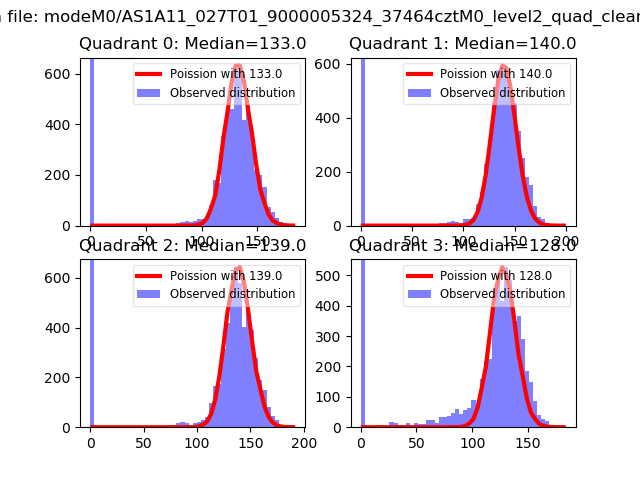 |
 |
| Quadrant-wise count rates Data is divided into 100 sec bins |
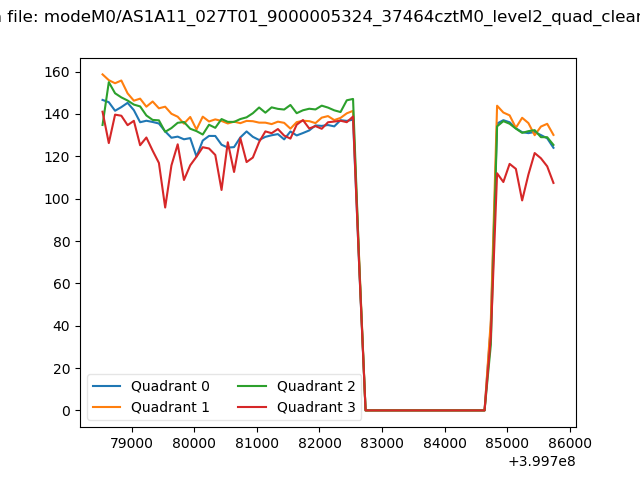 |
|
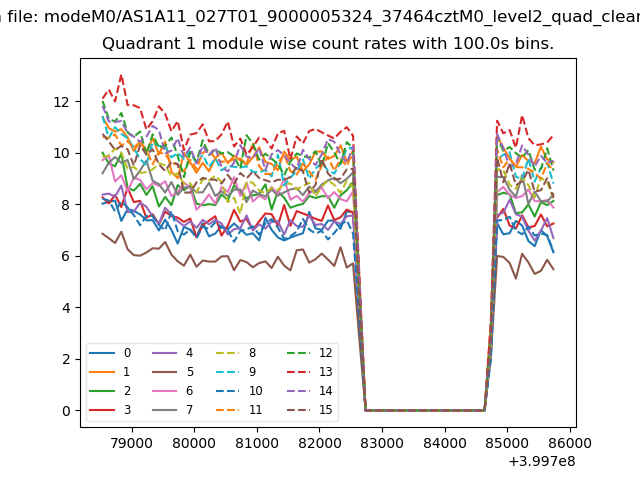
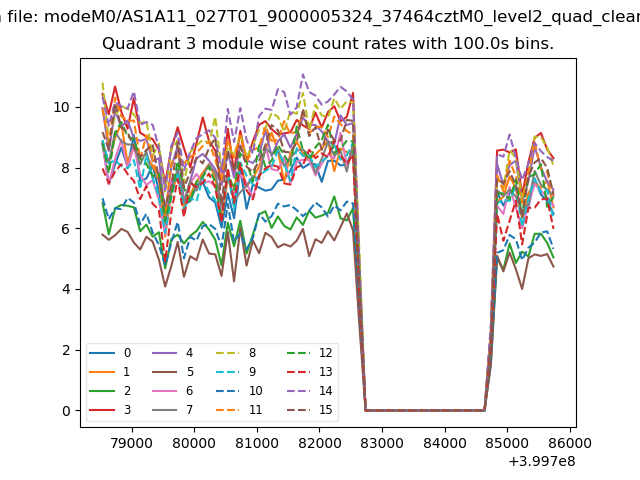
| Module-wise count rates for Quadrant A Data is divided into 100 sec bins |
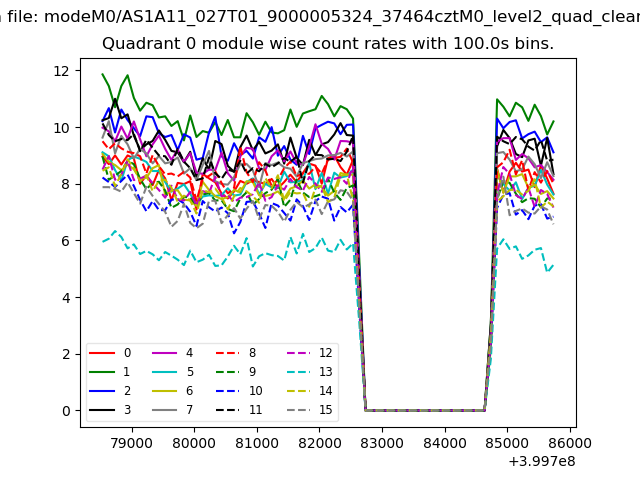 |
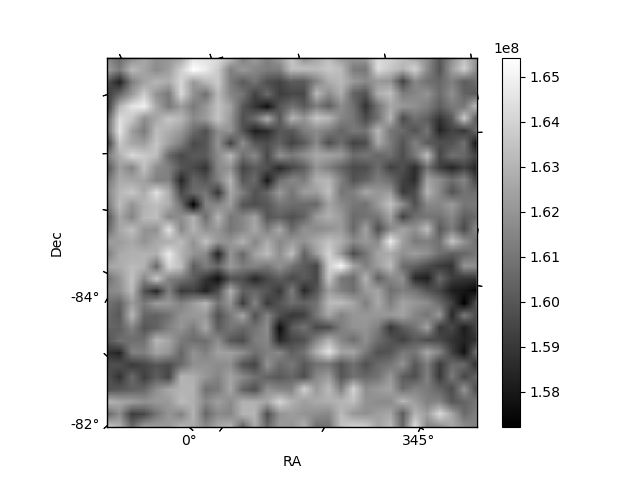 |
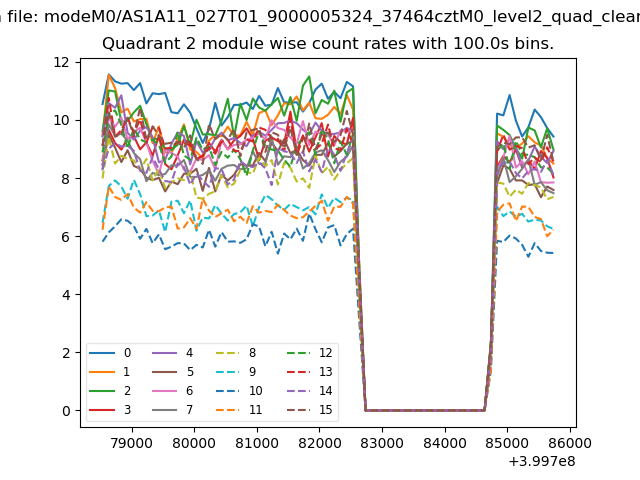
| Module-wise count rates for Quadrant B Data is divided into 100 sec bins |
 |
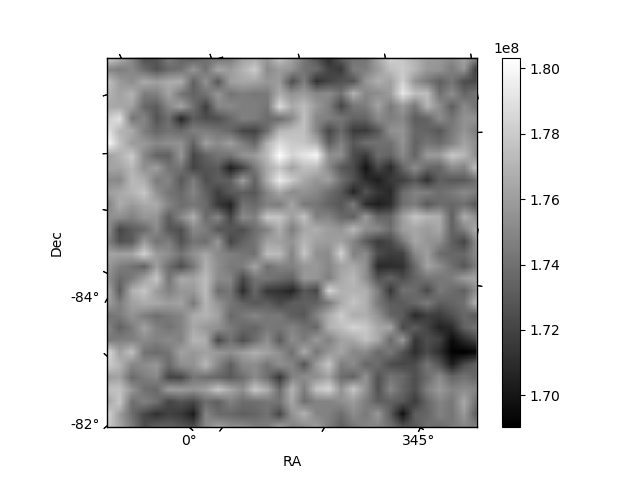 |
| Module-wise count rates for Quadrant C Data is divided into 100 sec bins |
 |
 |
| Module-wise count rates for Quadrant D Data is divided into 100 sec bins |
 |
 |
| Parameter | Plot |
|---|---|
| CZT HV Monitor | 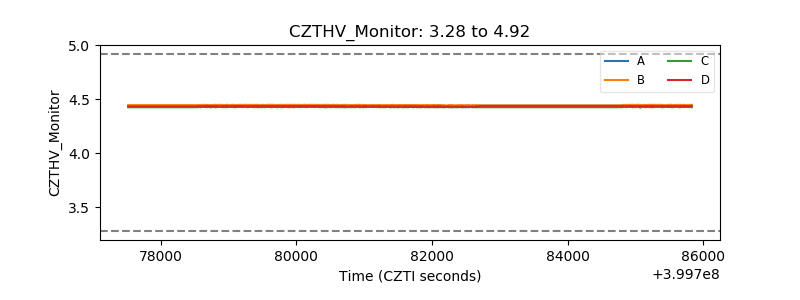 |
| D_VDD | 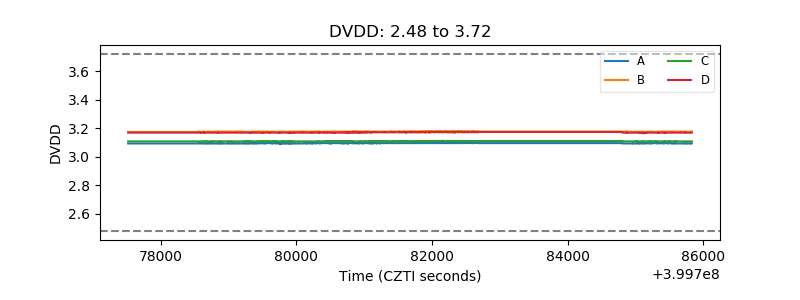 |
| Temperature 1 | 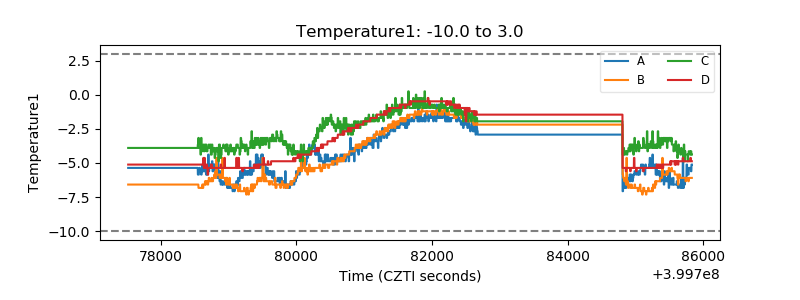 |
| Veto HV Monitor | 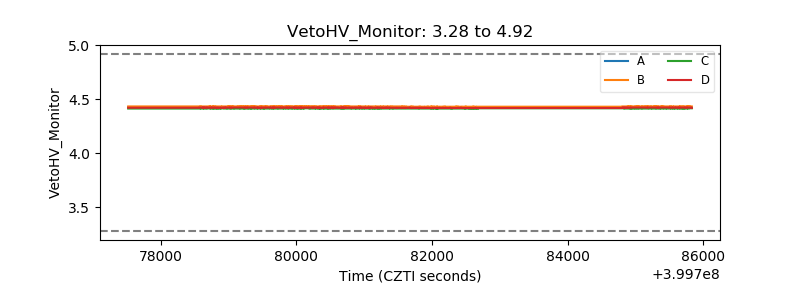 |
| Veto LLD | 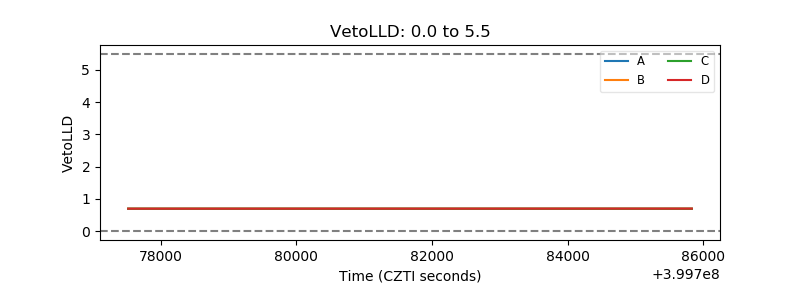 |
| Alpha Counter | 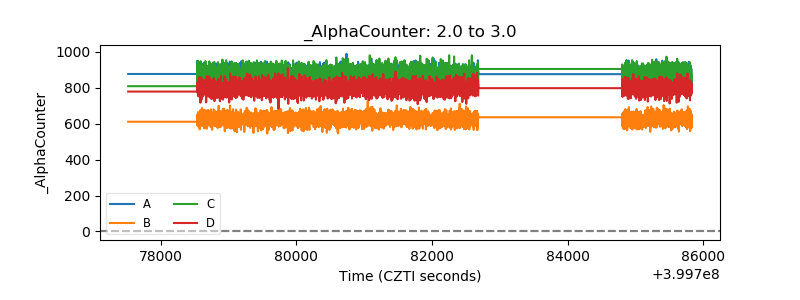 |
| _CPM_Rate | 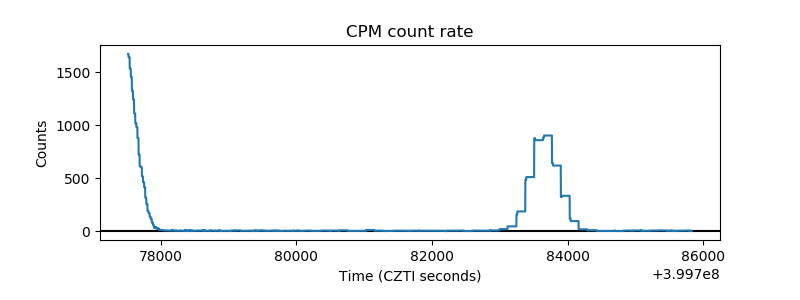 |
| CZT Counter | 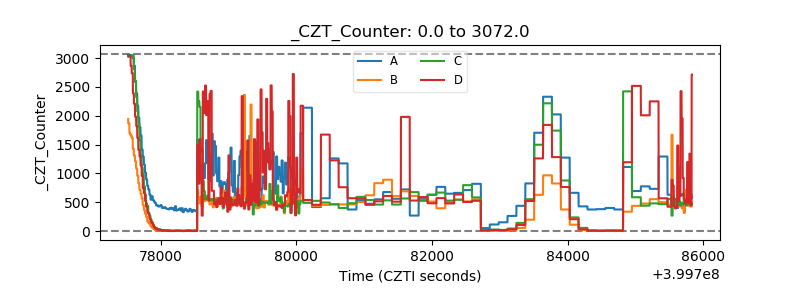 |
| +2.5 Volts monitor | 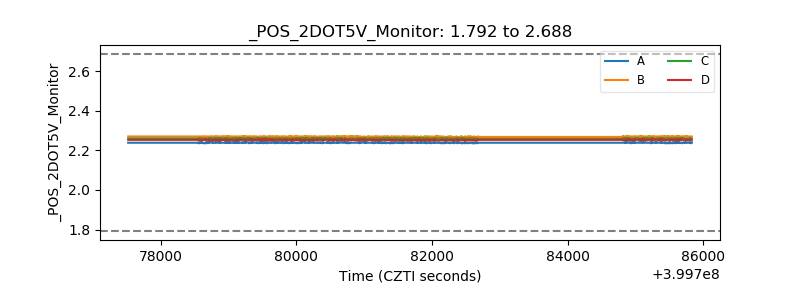 |
| +5 Volts monitor | 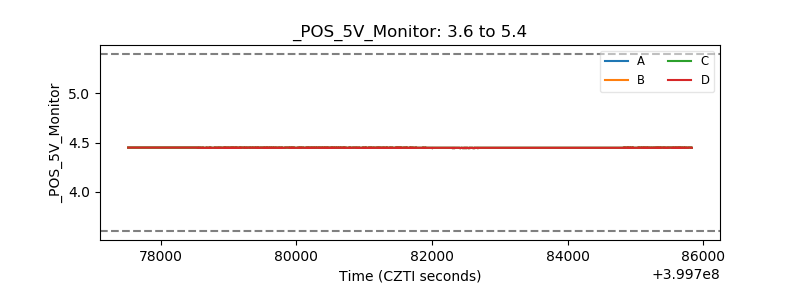 |
| _ROLL_ROT | 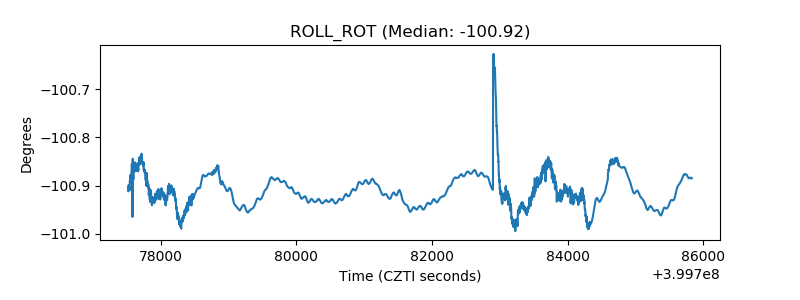 |
| _Roll_DEC | 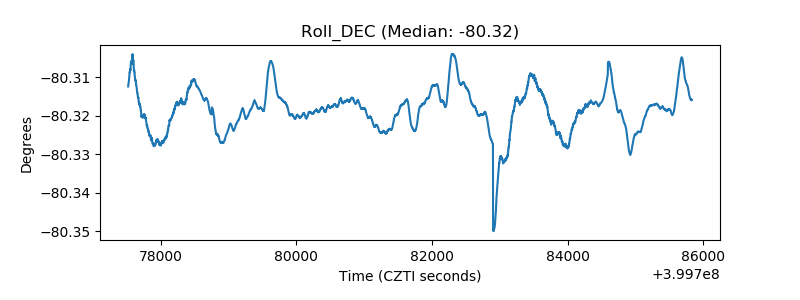 |
| _Roll_RA | 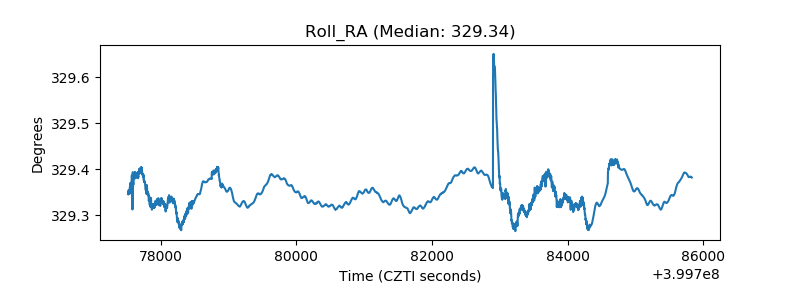 |
| Veto Counter | 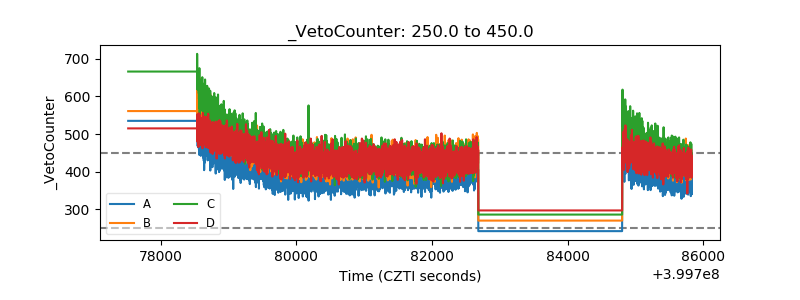 |