| Param | Original file | Final file |
|---|---|---|
| Filename | modeM0/AS1A11_027T01_9000005324_37466cztM0_level2.evt | modeM0/AS1A11_027T01_9000005324_37466cztM0_level2_quad_clean.evt |
| Size (bytes) | 435,810,240 | 99,763,200 |
| Size | 415.6 MB | 95.1 MB |
| Events in quadrant A | 3,719,582 | 653,896 |
| Events in quadrant B | 2,731,292 | 680,695 |
| Events in quadrant C | 2,734,381 | 688,016 |
| Events in quadrant D | 3,648,142 | 622,413 |
| Mode SS | |||
|---|---|---|---|
| Quadrant | BADHDUFLAG | Total packets | Discarded packets |
| A | 0 | 108 | 0 |
| B | 0 | 108 | 0 |
| C | 0 | 108 | 0 |
| D | 0 | 108 | 0 |
| Mode M9 | |||
|---|---|---|---|
| Quadrant | BADHDUFLAG | Total packets | Discarded packets |
| A | 0 | 25 | 0 |
| B | 0 | 25 | 0 |
| C | 0 | 25 | 0 |
| D | 0 | 26 | 0 |
| Mode M0 | |||
|---|---|---|---|
| Quadrant | BADHDUFLAG | Total packets | Discarded packets |
| A | 0 | 14584 | 3 |
| B | 0 | 11709 | 2 |
| C | 0 | 11351 | 2 |
| D | 0 | 14501 | 2 |
| Quadrant | Total seconds | Saturated seconds | Saturation percentage |
|---|---|---|---|
| A | 5381 | 19 | 0.353094% |
| B | 5381 | 66 | 1.226538% |
| C | 5381 | 44 | 0.817692% |
| D | 5381 | 366 | 6.801710% |
Noise dominated data is calculated using 1-second bins in cleaned event files. If a bin has >2000 counts, and if more than 50% of those come from <1% of pixels, then it is considered to be noise-dominated and hence unusable.
| Quadrant | # 1 sec bins | Bins with >0 counts | Bins with >2000 counts | High rate bins dominated by noise | Noise dominated (total time) | Noise dominated (detector-on time) | Marked lightcurve |
|---|---|---|---|---|---|---|---|
| A | 7114 | 5382 | 13 | 13 | 0.18% | 0.24% | 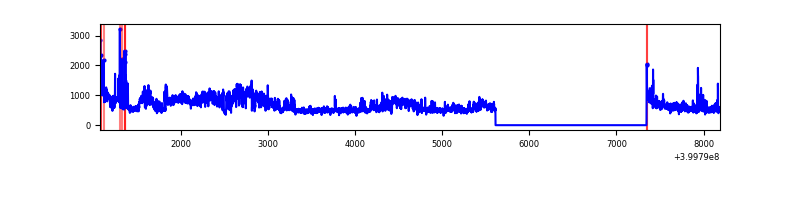 |
| B | 7114 | 5382 | 46 | 46 | 0.65% | 0.85% | 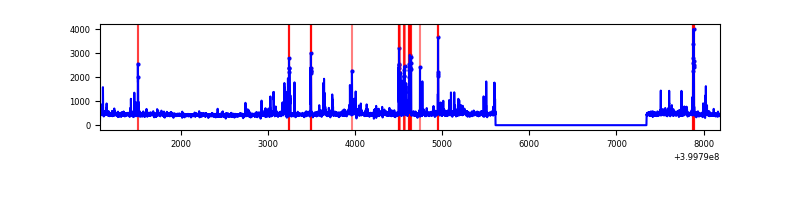 |
| C | 7114 | 5382 | 33 | 33 | 0.46% | 0.61% | 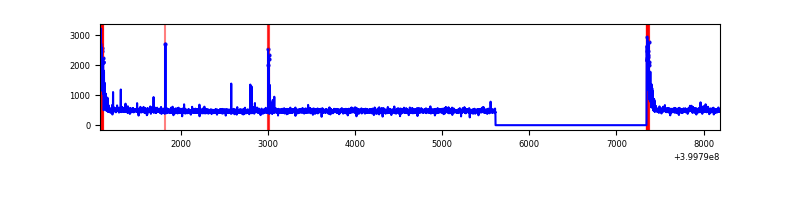 |
| D | 7113 | 5381 | 326 | 326 | 4.58% | 6.06% | 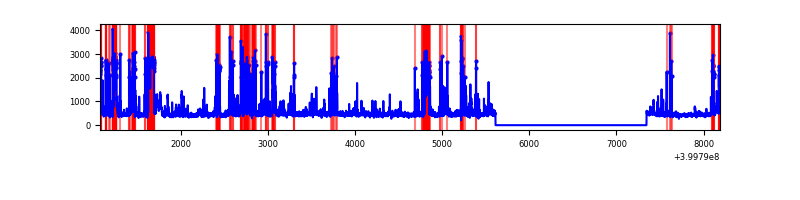 |
Top three noisy pixels from each quadrant. If the there are fewer than three noisy pixels in the level2.evt file, extra rows are filled as -1
| Pixel properties | Quadrant properties | ||||||
|---|---|---|---|---|---|---|---|
| Quadrant | DetID | PixID | Counts | Sigma | Mean | Median | Sigma |
| A | 15 | 222 | 998025 | 8281.35 | 598 | 586 | 120.4 |
| A | 10 | 83 | 290353 | 2405.82 | 598 | 586 | 120.4 |
| A | 13 | 248 | 72653 | 598.34 | 598 | 586 | 120.4 |
| B | 5 | 172 | 267511 | 2343.81 | 598 | 582 | 113.9 |
| B | 0 | 190 | 42648 | 369.37 | 598 | 582 | 113.9 |
| B | 0 | 229 | 23484 | 201.09 | 598 | 582 | 113.9 |
| C | 15 | 214 | 229818 | 1668.46 | 594 | 598 | 137.4 |
| C | 0 | 10 | 149135 | 1081.18 | 594 | 598 | 137.4 |
| C | 14 | 254 | 28154 | 200.58 | 594 | 598 | 137.4 |
| D | 13 | 249 | 945169 | 6848.22 | 569 | 554 | 137.9 |
| D | 2 | 153 | 182571 | 1319.57 | 569 | 554 | 137.9 |
| D | 2 | 249 | 130241 | 940.19 | 569 | 554 | 137.9 |
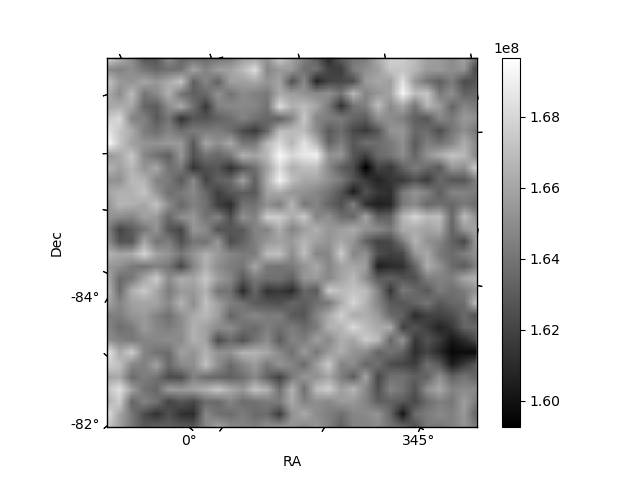
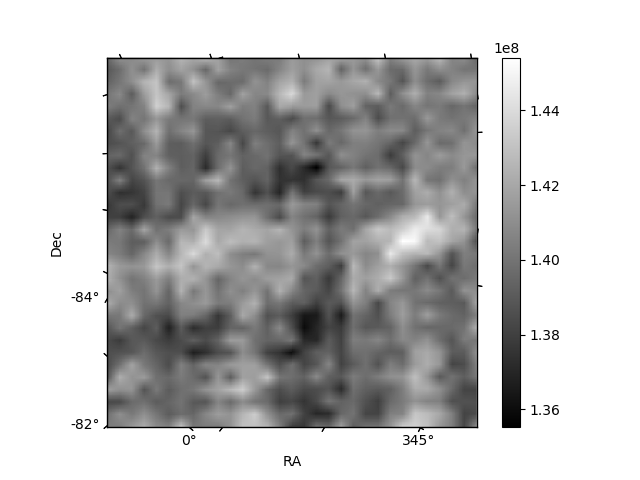
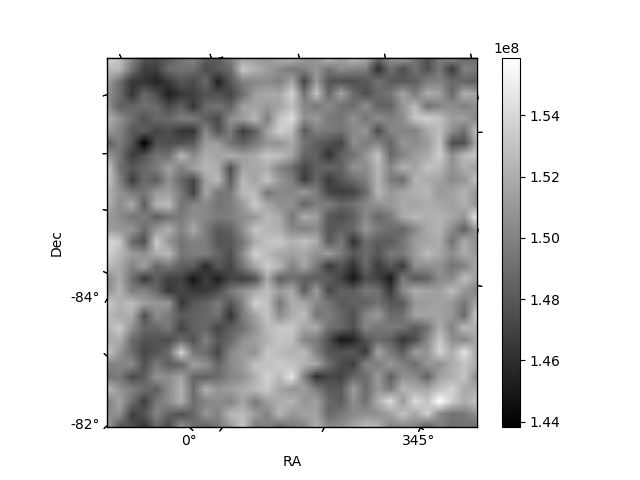
Histogram calculated using DETX and DETY for each event in the final _common_clean file
| Quadrant A | 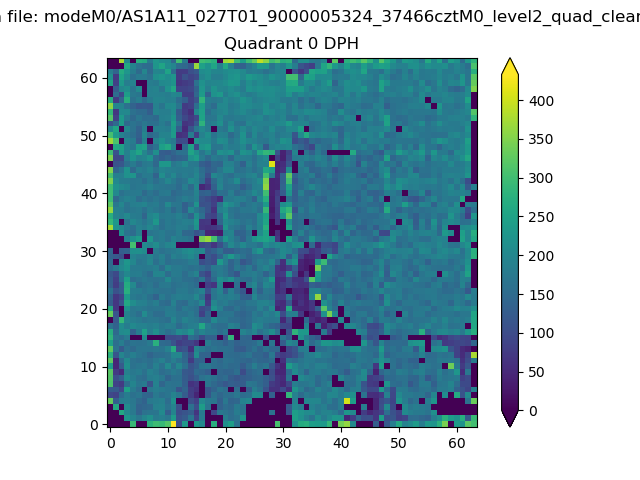 |
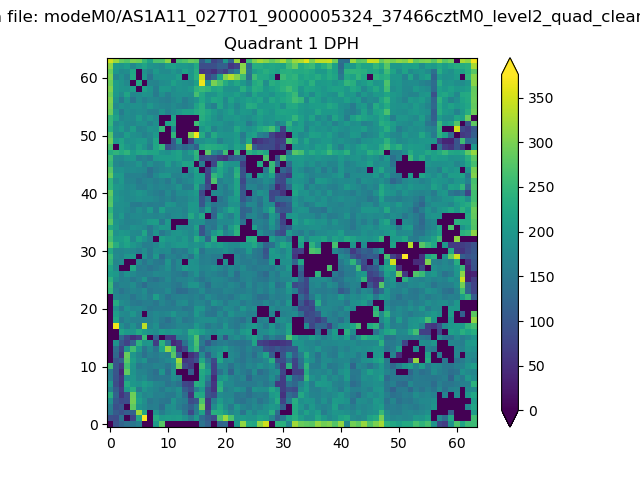 |
Quadrant B |
|---|---|---|---|
| Quadrant D | 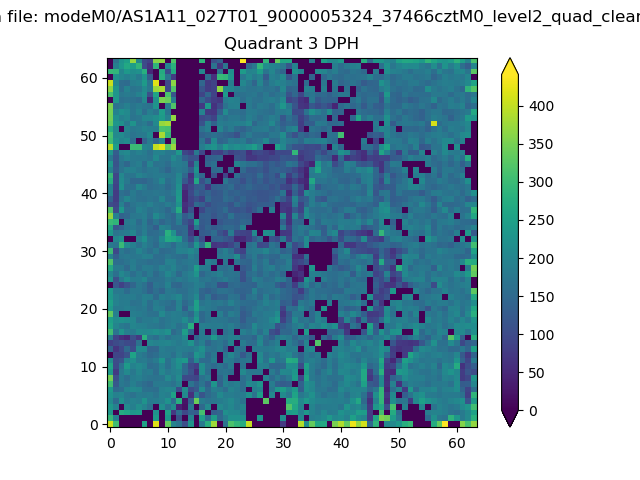 |
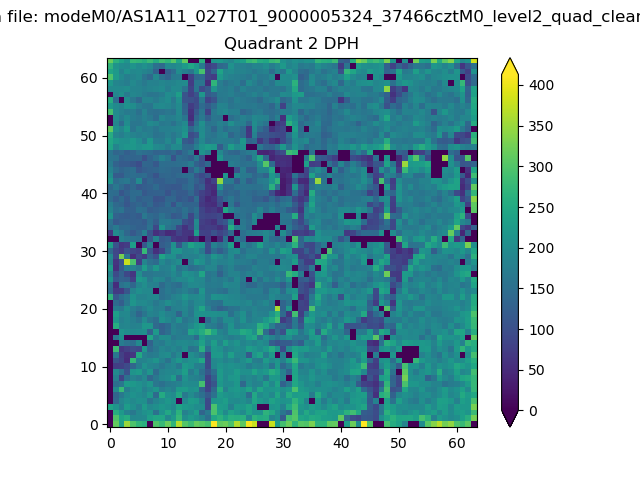 |
Quadrant C |
| Plot type | Count rate plots | Images |
|---|---|---|
| Comparison with Poisson distribution Blue bars denote a histogram of data divided into 1 sec bins. Red curve is a Poisson curve with rate = median count rate of data. |
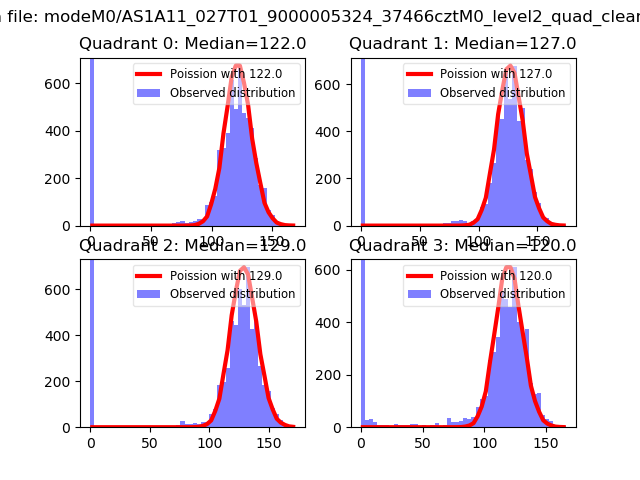 |
 |
| Quadrant-wise count rates Data is divided into 100 sec bins |
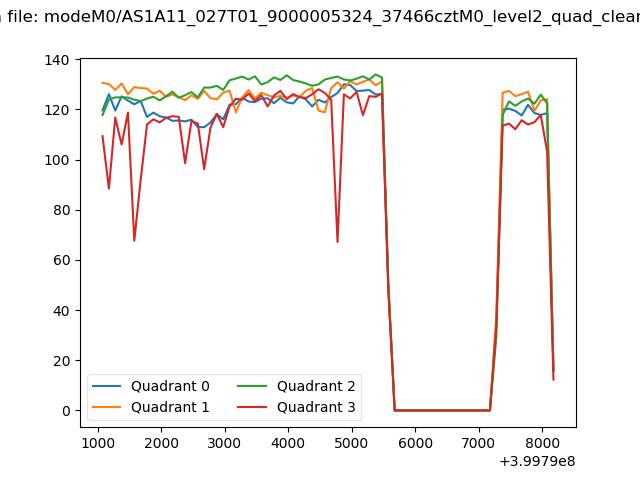 |
|
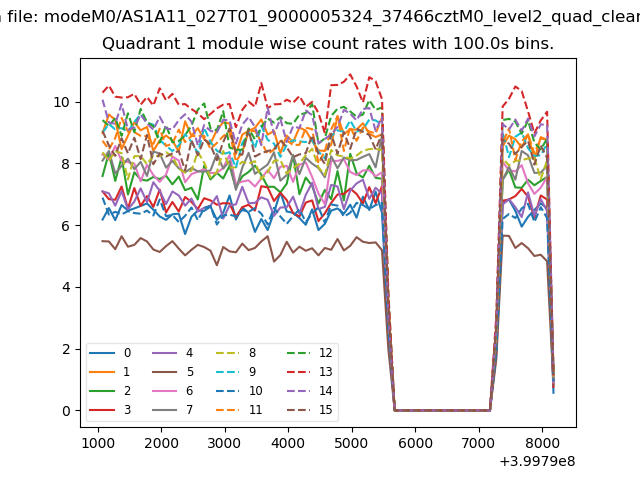
| Module-wise count rates for Quadrant A Data is divided into 100 sec bins |
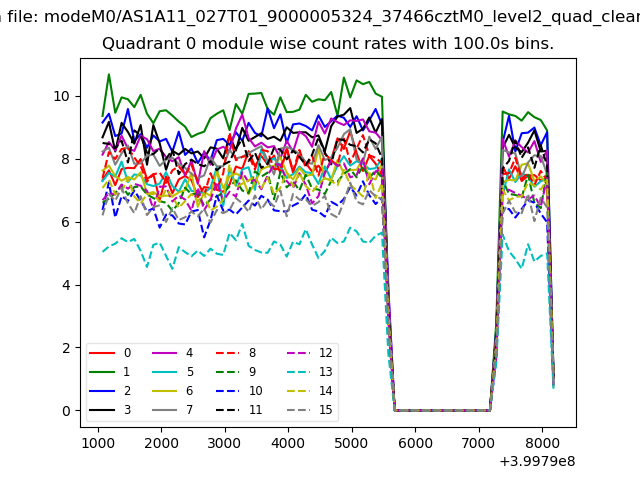 |
 |
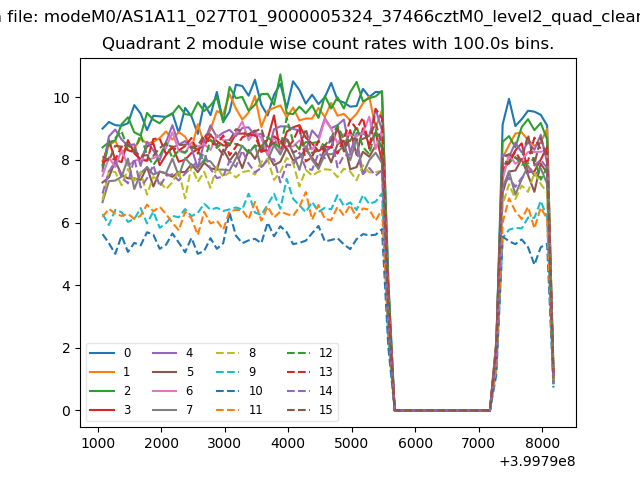
| Module-wise count rates for Quadrant B Data is divided into 100 sec bins |
 |
 |
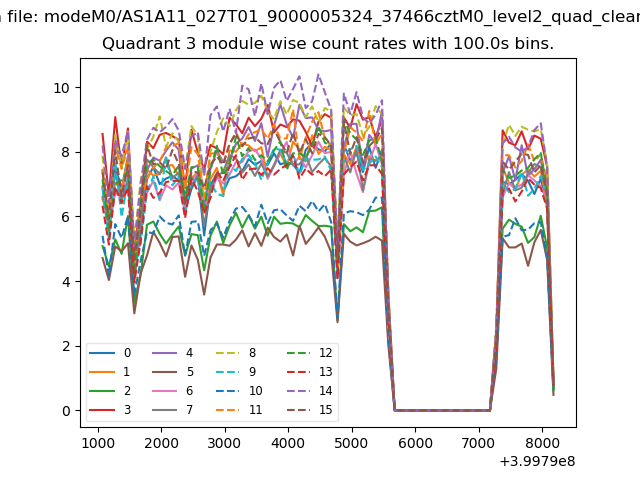
| Module-wise count rates for Quadrant C Data is divided into 100 sec bins |
 |
 |
| Module-wise count rates for Quadrant D Data is divided into 100 sec bins |
 |
 |
| Parameter | Plot |
|---|---|
| CZT HV Monitor | 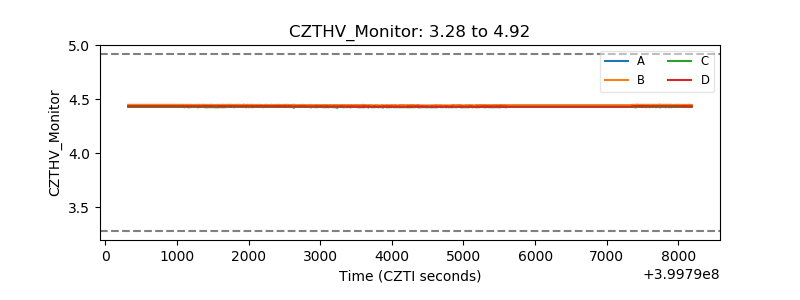 |
| D_VDD | 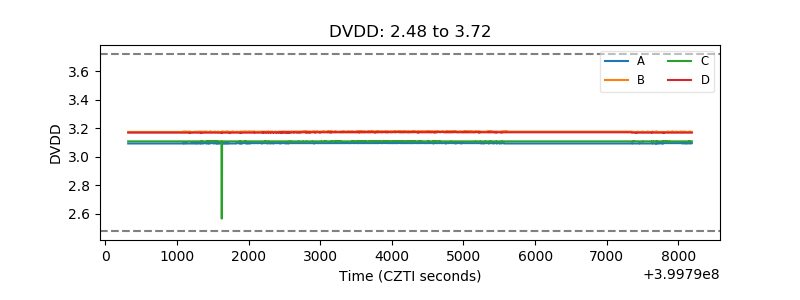 |
| Temperature 1 | 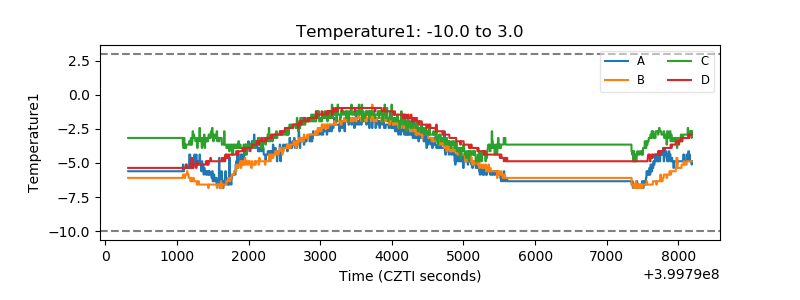 |
| Veto HV Monitor | 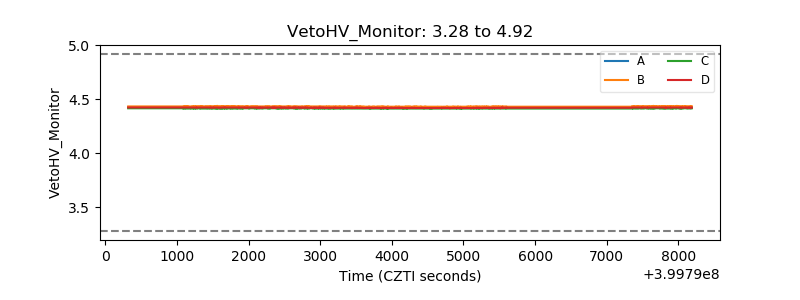 |
| Veto LLD | 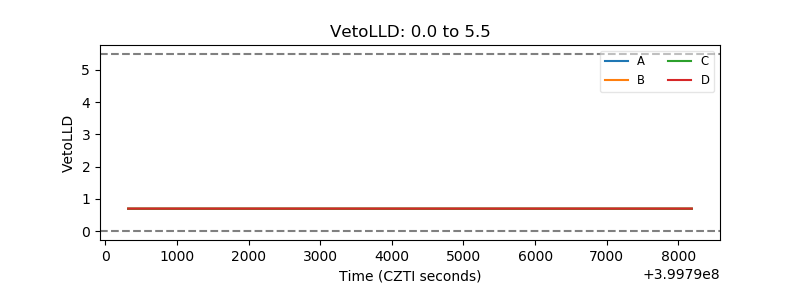 |
| Alpha Counter | 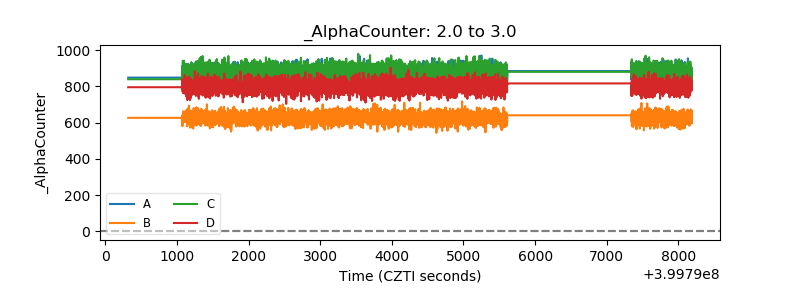 |
| _CPM_Rate | 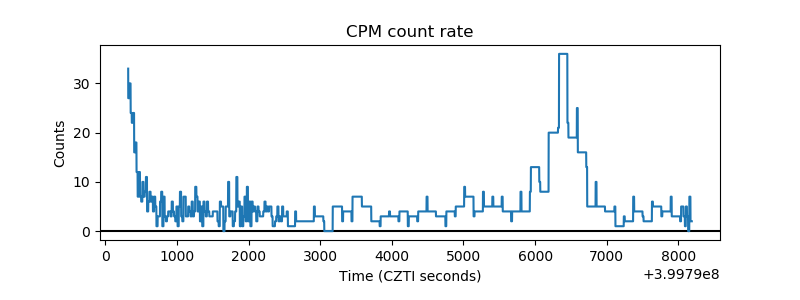 |
| CZT Counter | 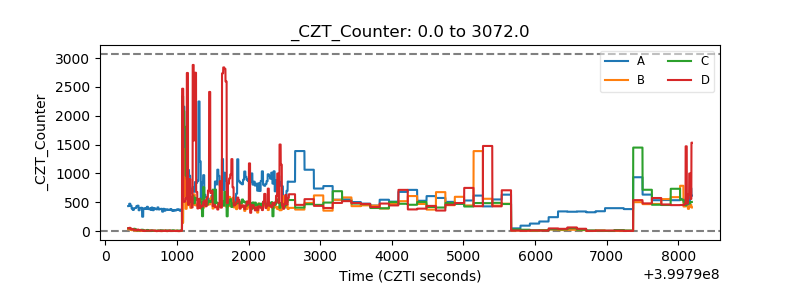 |
| +2.5 Volts monitor | 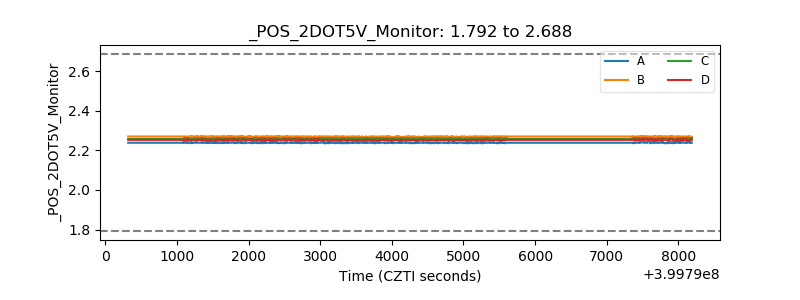 |
| +5 Volts monitor | 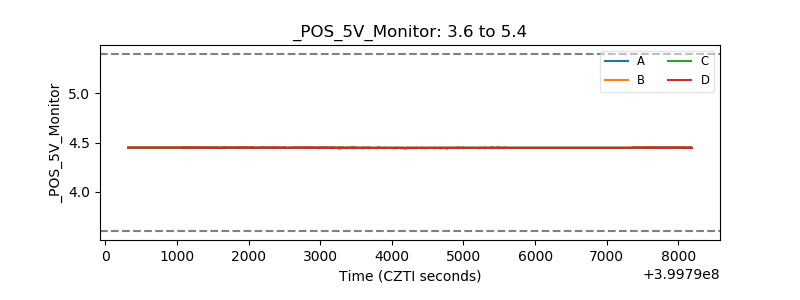 |
| _ROLL_ROT | 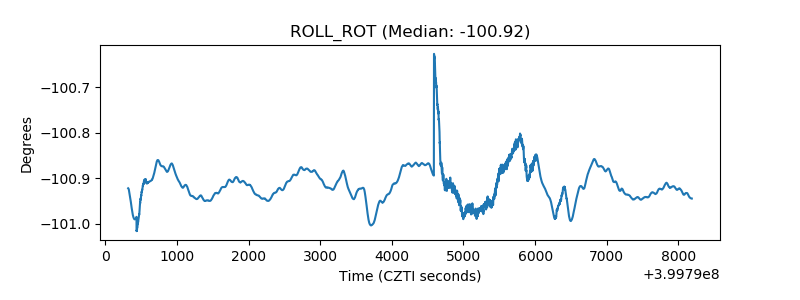 |
| _Roll_DEC | 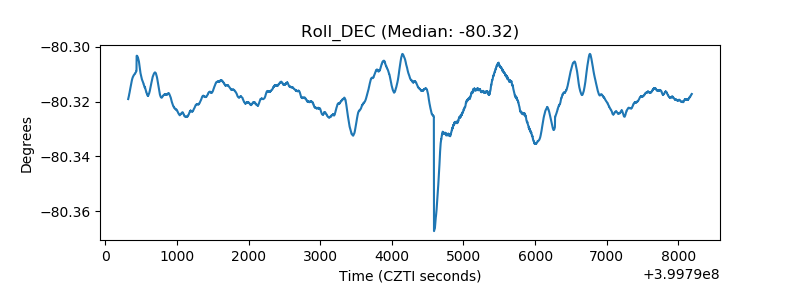 |
| _Roll_RA | 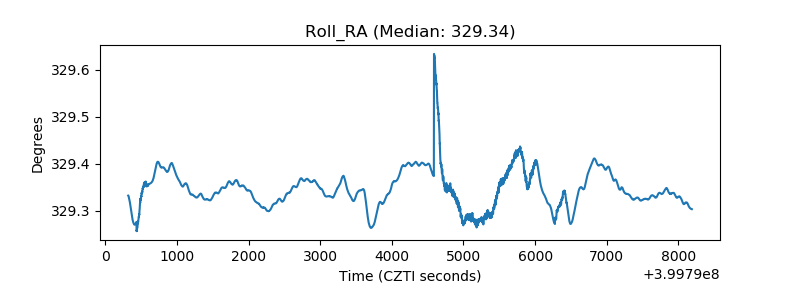 |
| Veto Counter | 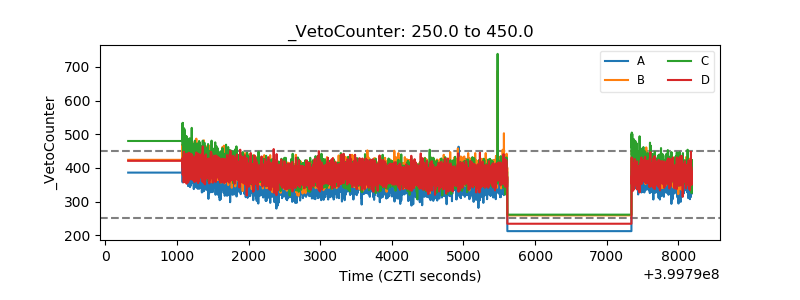 |