| Param | Original file | Final file |
|---|---|---|
| Filename | modeM0/AS1A11_027T01_9000005324_37467cztM0_level2.evt | modeM0/AS1A11_027T01_9000005324_37467cztM0_level2_quad_clean.evt |
| Size (bytes) | 464,103,360 | 104,333,760 |
| Size | 442.6 MB | 99.5 MB |
| Events in quadrant A | 3,463,352 | 684,694 |
| Events in quadrant B | 2,928,195 | 708,933 |
| Events in quadrant C | 2,911,170 | 717,371 |
| Events in quadrant D | 4,364,890 | 649,481 |
| Mode SS | |||
|---|---|---|---|
| Quadrant | BADHDUFLAG | Total packets | Discarded packets |
| A | 0 | 116 | 0 |
| B | 0 | 116 | 0 |
| C | 0 | 116 | 0 |
| D | 0 | 116 | 0 |
| Mode M9 | |||
|---|---|---|---|
| Quadrant | BADHDUFLAG | Total packets | Discarded packets |
| A | 0 | 18 | 0 |
| B | 0 | 18 | 0 |
| C | 0 | 18 | 0 |
| D | 0 | 19 | 0 |
| Mode M0 | |||
|---|---|---|---|
| Quadrant | BADHDUFLAG | Total packets | Discarded packets |
| A | 0 | 14038 | 3 |
| B | 0 | 12500 | 2 |
| C | 0 | 12025 | 2 |
| D | 0 | 16890 | 2 |
| Quadrant | Total seconds | Saturated seconds | Saturation percentage |
|---|---|---|---|
| A | 5710 | 16 | 0.280210% |
| B | 5710 | 48 | 0.840630% |
| C | 5710 | 34 | 0.595447% |
| D | 5710 | 534 | 9.352014% |
Noise dominated data is calculated using 1-second bins in cleaned event files. If a bin has >2000 counts, and if more than 50% of those come from <1% of pixels, then it is considered to be noise-dominated and hence unusable.
| Quadrant | # 1 sec bins | Bins with >0 counts | Bins with >2000 counts | High rate bins dominated by noise | Noise dominated (total time) | Noise dominated (detector-on time) | Marked lightcurve |
|---|---|---|---|---|---|---|---|
| A | 7142 | 5711 | 7 | 7 | 0.10% | 0.12% | 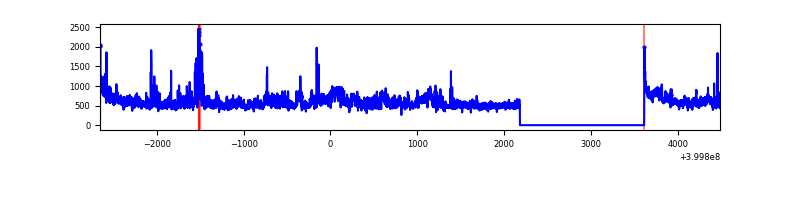 |
| B | 7142 | 5711 | 30 | 30 | 0.42% | 0.53% | 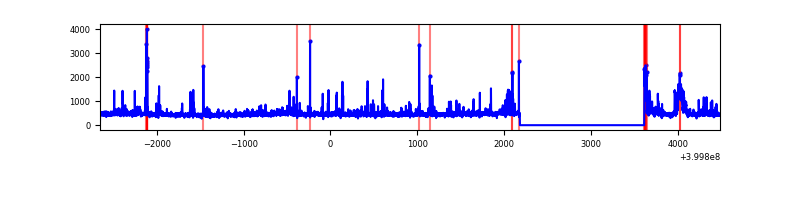 |
| C | 7142 | 5711 | 24 | 24 | 0.34% | 0.42% | 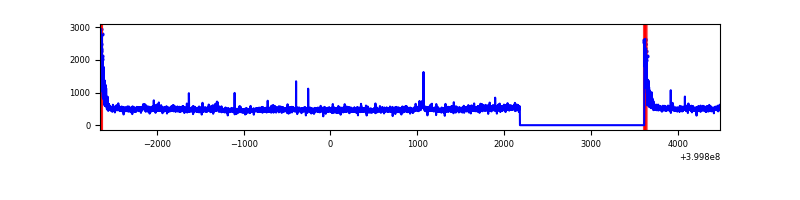 |
| D | 7142 | 5711 | 469 | 469 | 6.57% | 8.21% | 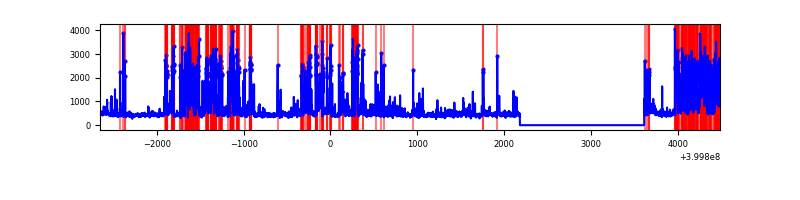 |
Top three noisy pixels from each quadrant. If the there are fewer than three noisy pixels in the level2.evt file, extra rows are filled as -1
| Pixel properties | Quadrant properties | ||||||
|---|---|---|---|---|---|---|---|
| Quadrant | DetID | PixID | Counts | Sigma | Mean | Median | Sigma |
| A | 15 | 222 | 560693 | 4402.01 | 631 | 617 | 127.2 |
| A | 10 | 83 | 294404 | 2309.07 | 631 | 617 | 127.2 |
| A | 13 | 248 | 90156 | 703.75 | 631 | 617 | 127.2 |
| B | 5 | 173 | 162737 | 1341.42 | 631 | 613 | 120.9 |
| B | 5 | 172 | 138880 | 1144.02 | 631 | 613 | 120.9 |
| B | 0 | 190 | 36564 | 297.46 | 631 | 613 | 120.9 |
| C | 15 | 214 | 243232 | 1680.32 | 624 | 628 | 144.4 |
| C | 0 | 10 | 137109 | 945.29 | 624 | 628 | 144.4 |
| C | 14 | 254 | 72934 | 500.8 | 624 | 628 | 144.4 |
| D | 13 | 249 | 1289848 | 8810.14 | 600 | 581 | 146.3 |
| D | 2 | 250 | 421885 | 2878.96 | 600 | 581 | 146.3 |
| D | 2 | 249 | 98730 | 670.7 | 600 | 581 | 146.3 |
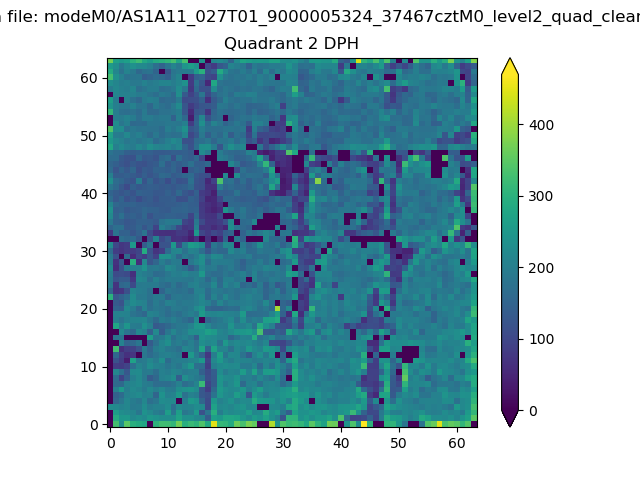
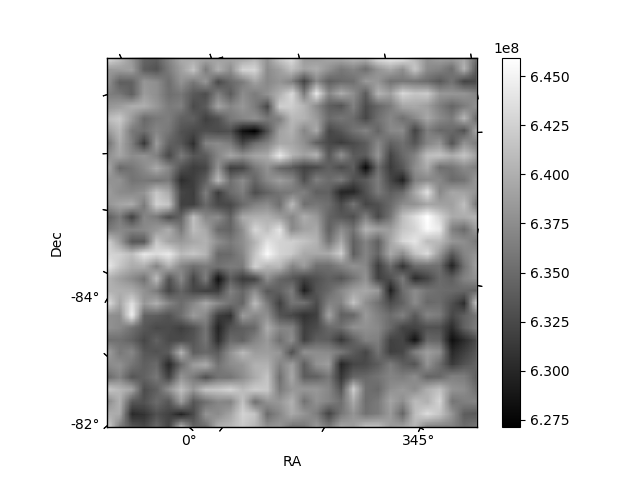
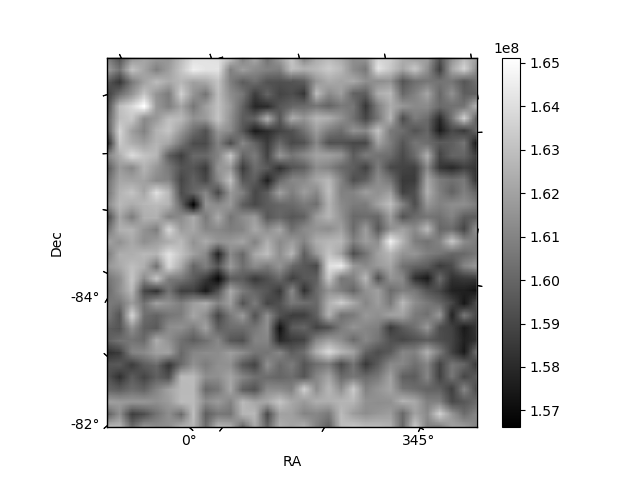
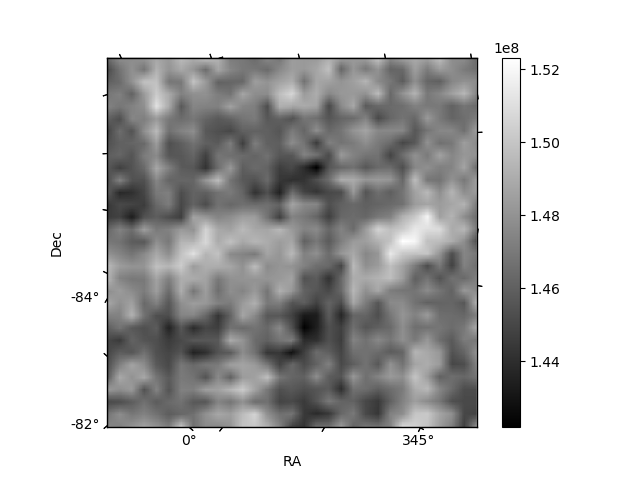
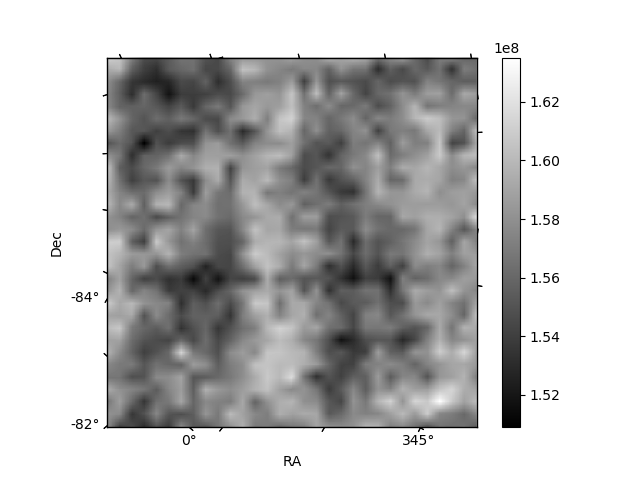
Histogram calculated using DETX and DETY for each event in the final _common_clean file
| Quadrant A | 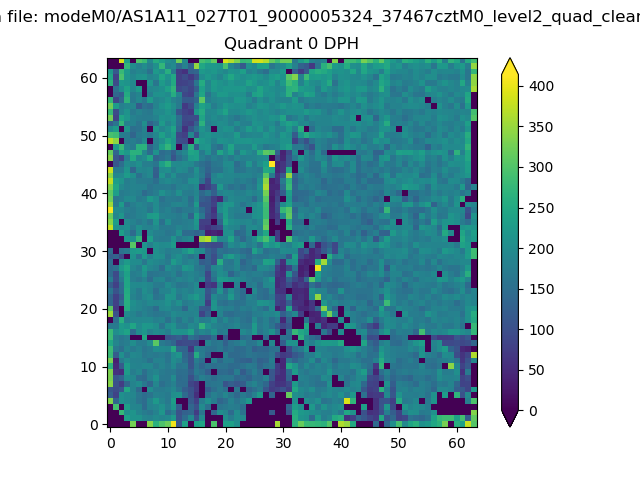 |
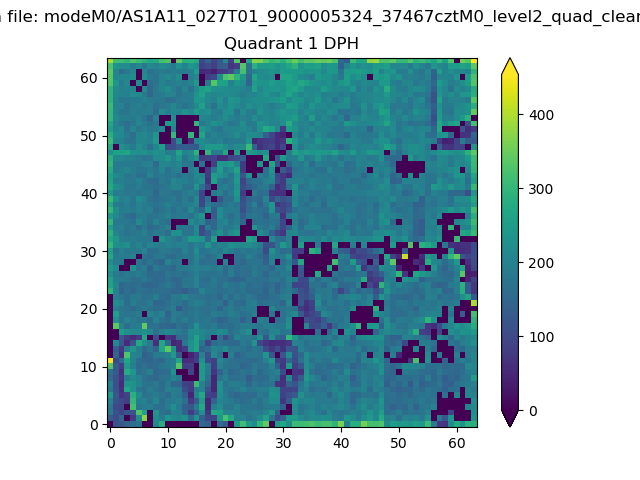 |
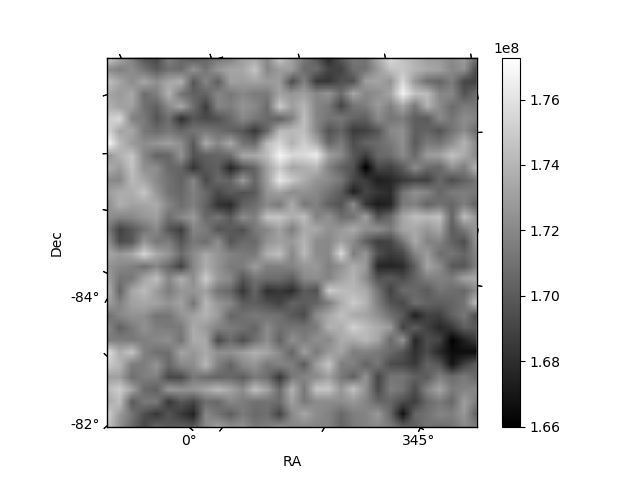
Quadrant B |
|---|---|---|---|
| Quadrant D | 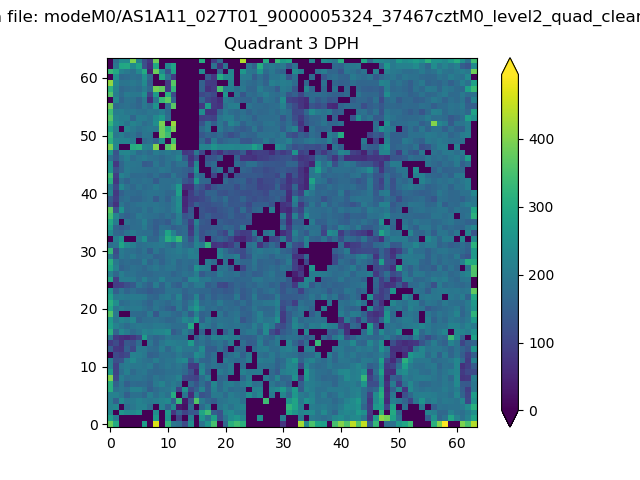 |
 |
Quadrant C |
| Plot type | Count rate plots | Images |
|---|---|---|
| Comparison with Poisson distribution Blue bars denote a histogram of data divided into 1 sec bins. Red curve is a Poisson curve with rate = median count rate of data. |
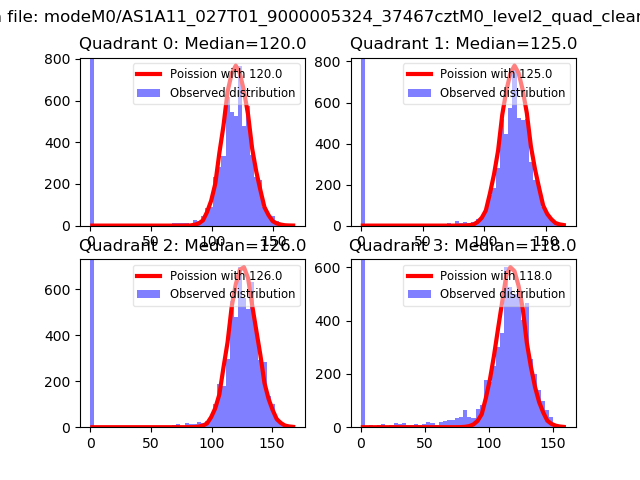 |
 |
| Quadrant-wise count rates Data is divided into 100 sec bins |
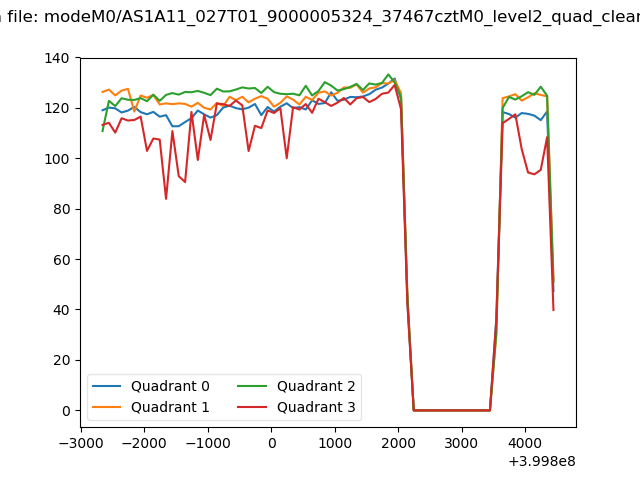 |
|
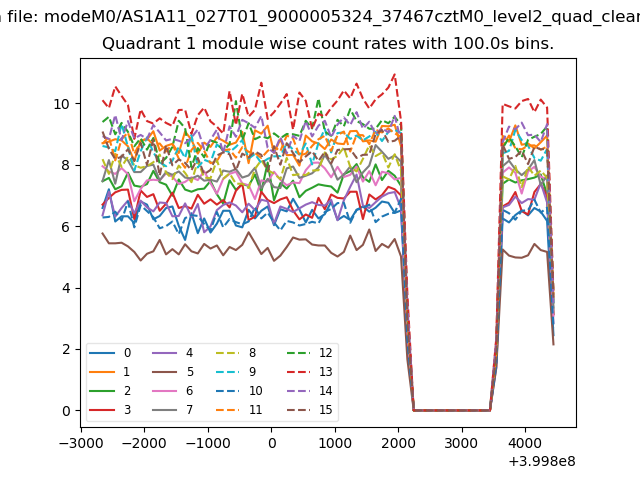
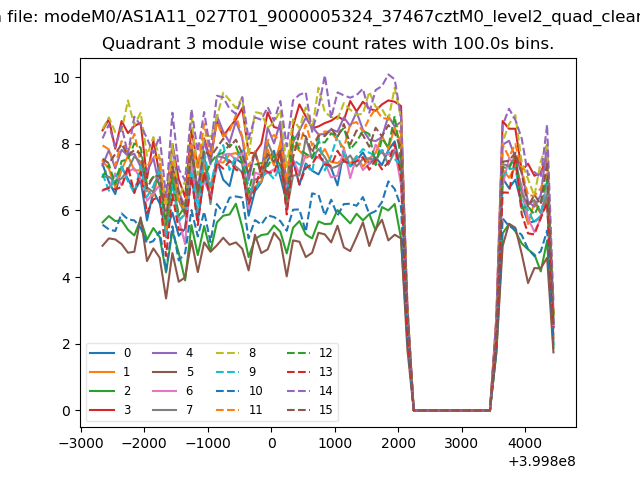
| Module-wise count rates for Quadrant A Data is divided into 100 sec bins |
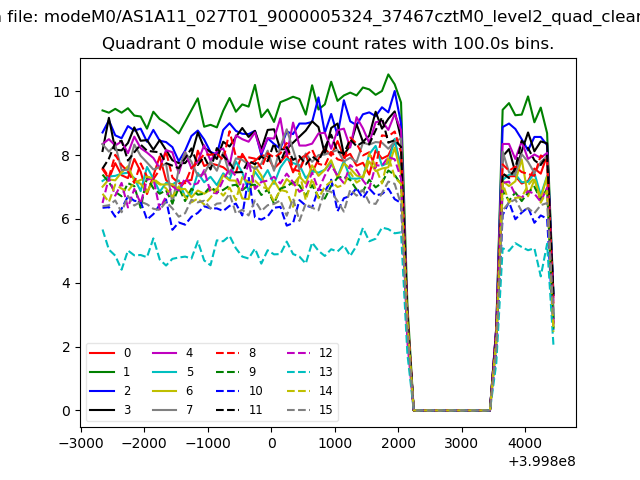 |
 |
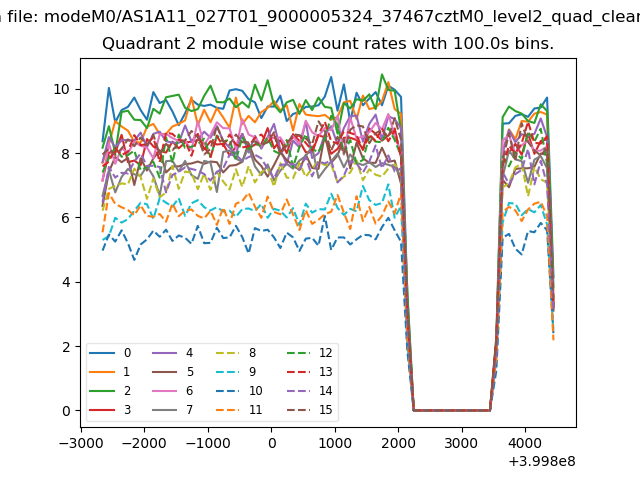
| Module-wise count rates for Quadrant B Data is divided into 100 sec bins |
 |
 |
| Module-wise count rates for Quadrant C Data is divided into 100 sec bins |
 |
 |
| Module-wise count rates for Quadrant D Data is divided into 100 sec bins |
 |
 |
| Parameter | Plot |
|---|---|
| CZT HV Monitor | 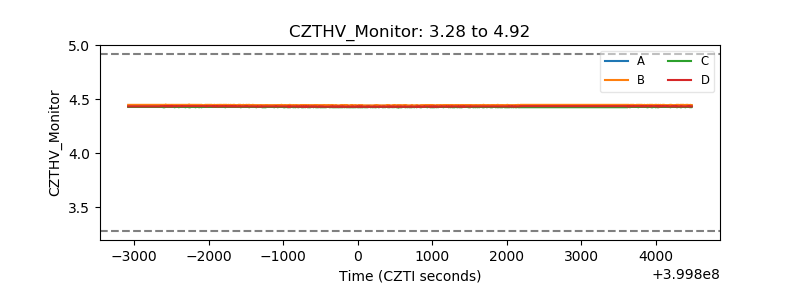 |
| D_VDD | 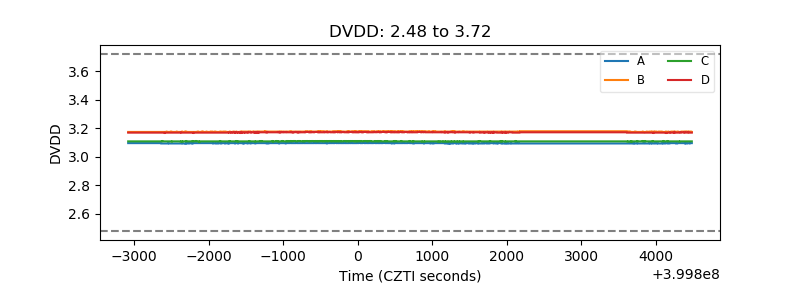 |
| Temperature 1 | 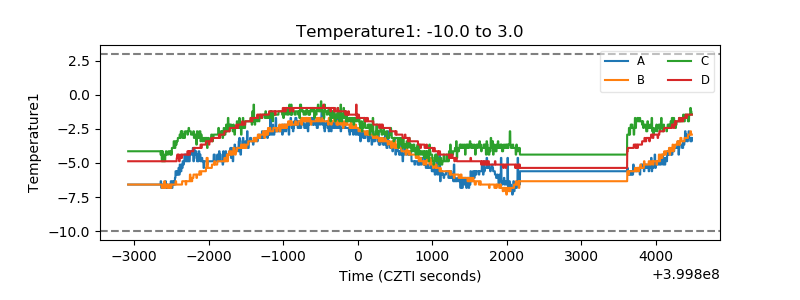 |
| Veto HV Monitor | 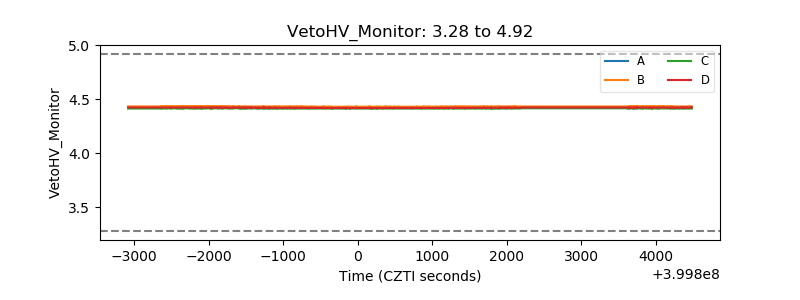 |
| Veto LLD | 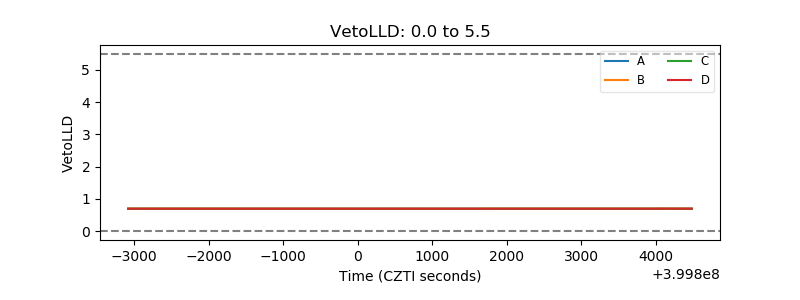 |
| Alpha Counter | 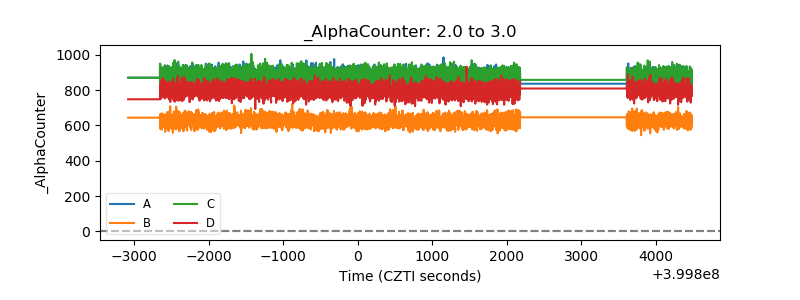 |
| _CPM_Rate | 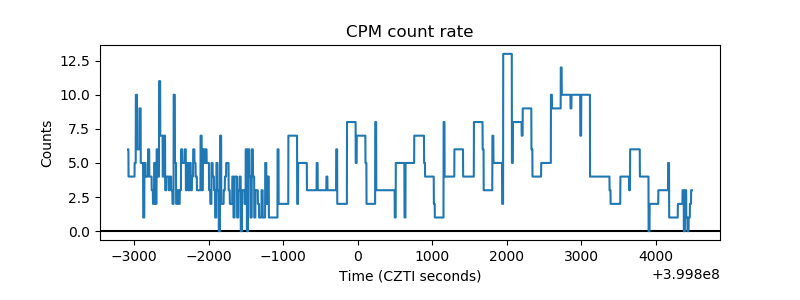 |
| CZT Counter | 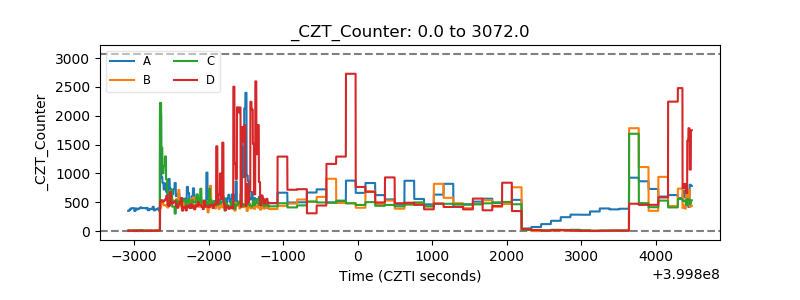 |
| +2.5 Volts monitor | 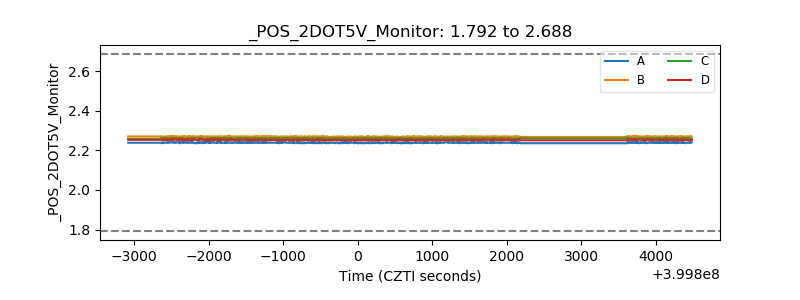 |
| +5 Volts monitor | 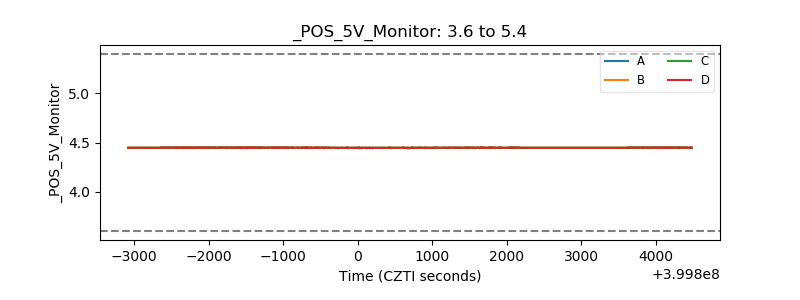 |
| _ROLL_ROT | 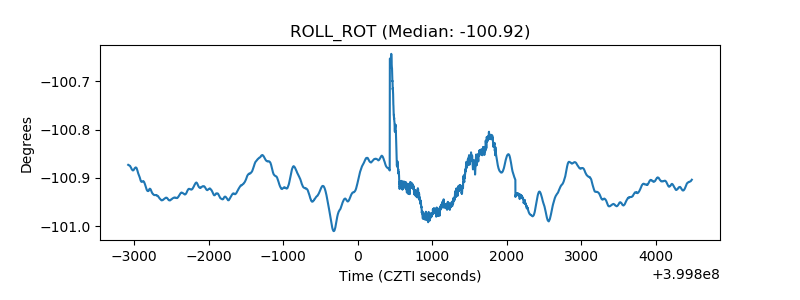 |
| _Roll_DEC | 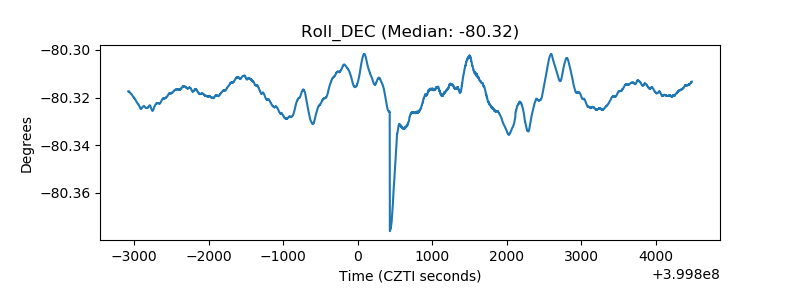 |
| _Roll_RA | 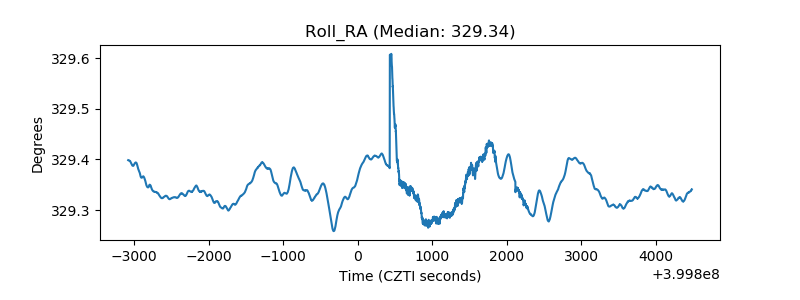 |
| Veto Counter |  |