| Param | Original file | Final file |
|---|---|---|
| Filename | modeM0/AS1A11_027T01_9000005324_37471cztM0_level2.evt | modeM0/AS1A11_027T01_9000005324_37471cztM0_level2_quad_clean.evt |
| Size (bytes) | 1,632,317,760 | 373,763,520 |
| Size | 1.5 GB | 356.4 MB |
| Events in quadrant A | 12,639,230 | 2,459,233 |
| Events in quadrant B | 10,909,973 | 2,513,278 |
| Events in quadrant C | 11,186,348 | 2,536,567 |
| Events in quadrant D | 13,302,906 | 2,386,937 |
| Mode SS | |||
|---|---|---|---|
| Quadrant | BADHDUFLAG | Total packets | Discarded packets |
| A | 0 | 422 | 0 |
| B | 0 | 422 | 0 |
| C | 0 | 422 | 0 |
| D | 0 | 422 | 0 |
| Mode M9 | |||
|---|---|---|---|
| Quadrant | BADHDUFLAG | Total packets | Discarded packets |
| A | 0 | 60 | 0 |
| B | 0 | 60 | 0 |
| C | 0 | 60 | 0 |
| D | 0 | 61 | 0 |
| Mode M0 | |||
|---|---|---|---|
| Quadrant | BADHDUFLAG | Total packets | Discarded packets |
| A | 0 | 51269 | 6 |
| B | 0 | 46099 | 5 |
| C | 0 | 46172 | 5 |
| D | 0 | 53977 | 5 |
| Quadrant | Total seconds | Saturated seconds | Saturation percentage |
|---|---|---|---|
| A | 20702 | 149 | 0.719737% |
| B | 20702 | 319 | 1.540914% |
| C | 20702 | 358 | 1.729302% |
| D | 20702 | 980 | 4.733842% |
Noise dominated data is calculated using 1-second bins in cleaned event files. If a bin has >2000 counts, and if more than 50% of those come from <1% of pixels, then it is considered to be noise-dominated and hence unusable.
| Quadrant | # 1 sec bins | Bins with >0 counts | Bins with >2000 counts | High rate bins dominated by noise | Noise dominated (total time) | Noise dominated (detector-on time) | Marked lightcurve |
|---|---|---|---|---|---|---|---|
| A | 26194 | 20706 | 111 | 111 | 0.42% | 0.54% | 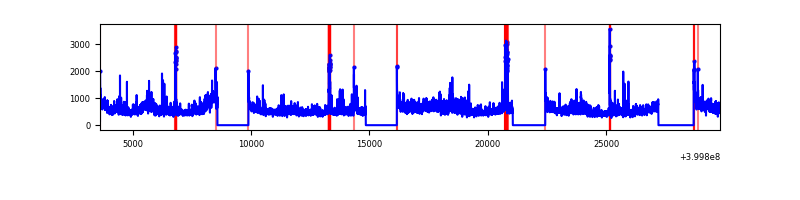 |
| B | 26194 | 20706 | 215 | 215 | 0.82% | 1.04% | 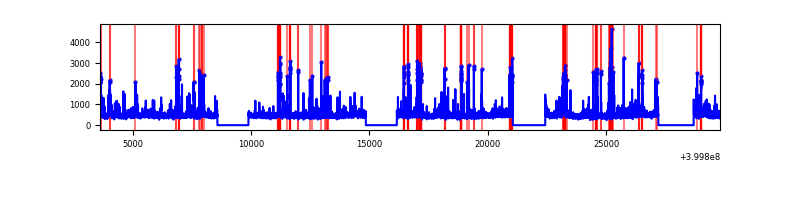 |
| C | 26194 | 20706 | 304 | 304 | 1.16% | 1.47% | 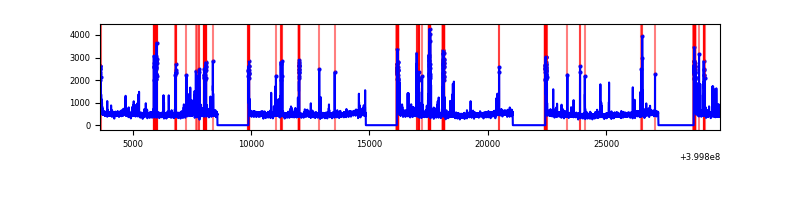 |
| D | 26194 | 20705 | 848 | 848 | 3.24% | 4.10% | 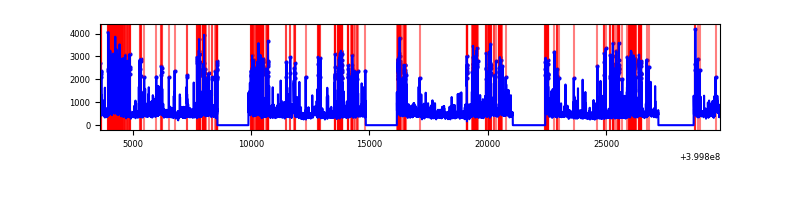 |
Top three noisy pixels from each quadrant. If the there are fewer than three noisy pixels in the level2.evt file, extra rows are filled as -1
| Pixel properties | Quadrant properties | ||||||
|---|---|---|---|---|---|---|---|
| Quadrant | DetID | PixID | Counts | Sigma | Mean | Median | Sigma |
| A | 15 | 222 | 2156800 | 4708.56 | 2282 | 2235 | 457.6 |
| A | 10 | 83 | 955342 | 2082.91 | 2282 | 2235 | 457.6 |
| A | 13 | 248 | 279247 | 605.38 | 2282 | 2235 | 457.6 |
| B | 5 | 172 | 565205 | 1302.22 | 2282 | 2219 | 432.3 |
| B | 5 | 173 | 232124 | 531.78 | 2282 | 2219 | 432.3 |
| B | 5 | 184 | 216131 | 494.79 | 2282 | 2219 | 432.3 |
| C | 14 | 254 | 878256 | 1696.94 | 2238 | 2254 | 516.2 |
| C | 15 | 214 | 872604 | 1685.99 | 2238 | 2254 | 516.2 |
| C | 0 | 10 | 463507 | 893.51 | 2238 | 2254 | 516.2 |
| D | 13 | 249 | 2627123 | 4904.7 | 2203 | 2139 | 535.2 |
| D | 2 | 249 | 907082 | 1690.86 | 2203 | 2139 | 535.2 |
| D | 12 | 233 | 264545 | 490.3 | 2203 | 2139 | 535.2 |
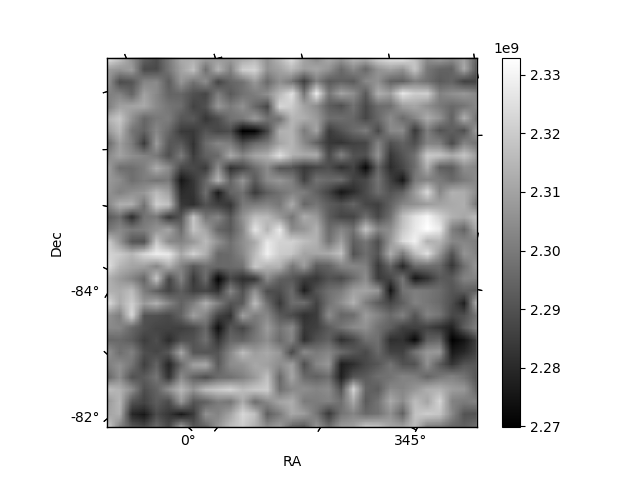
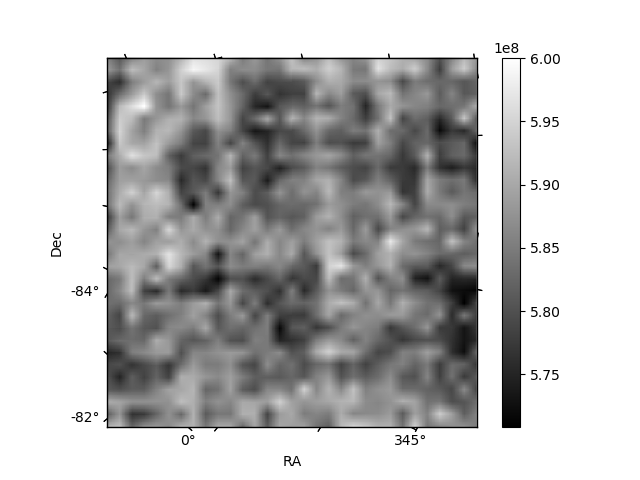
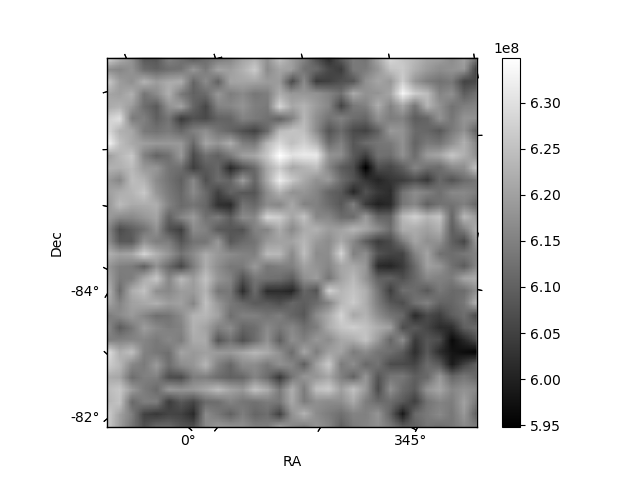
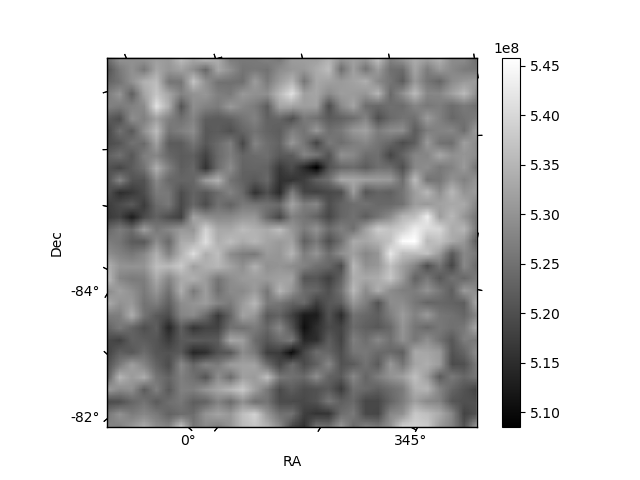
Histogram calculated using DETX and DETY for each event in the final _common_clean file
| Quadrant A | 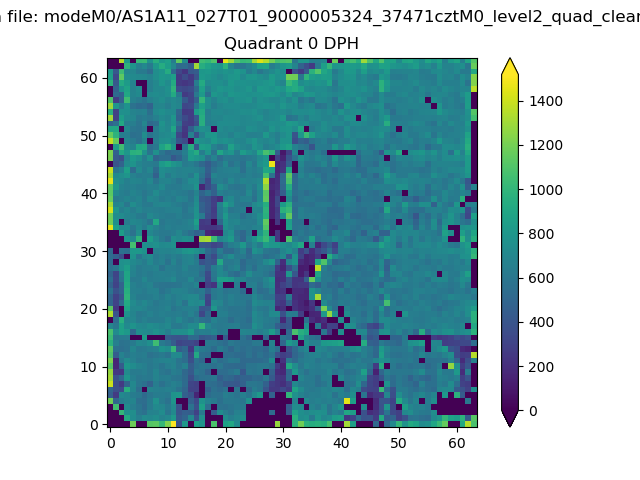 |
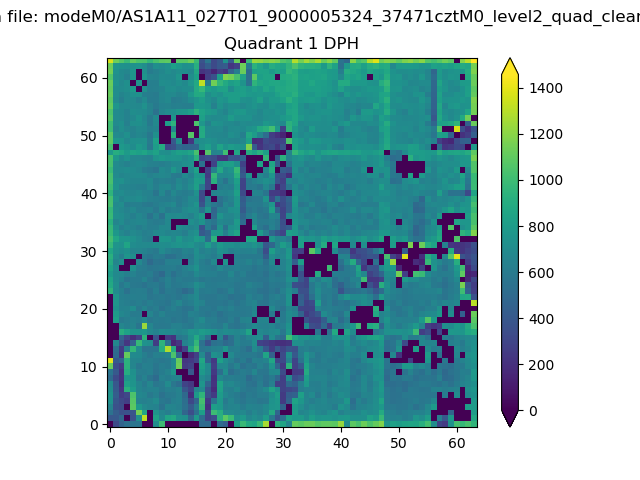 |
Quadrant B |
|---|---|---|---|
| Quadrant D |  |
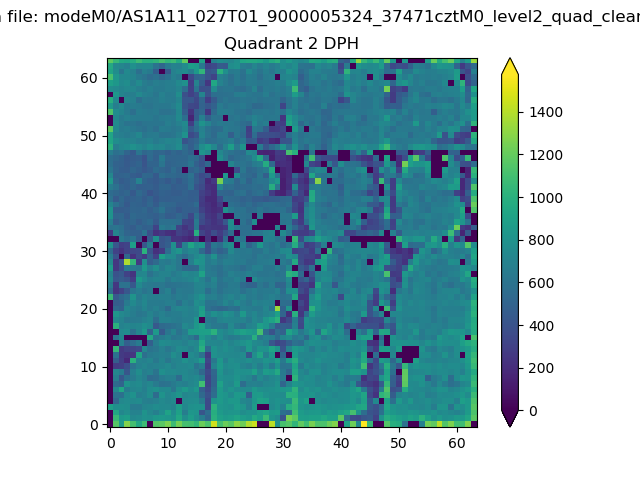 |
Quadrant C |
| Plot type | Count rate plots | Images |
|---|---|---|
| Comparison with Poisson distribution Blue bars denote a histogram of data divided into 1 sec bins. Red curve is a Poisson curve with rate = median count rate of data. |
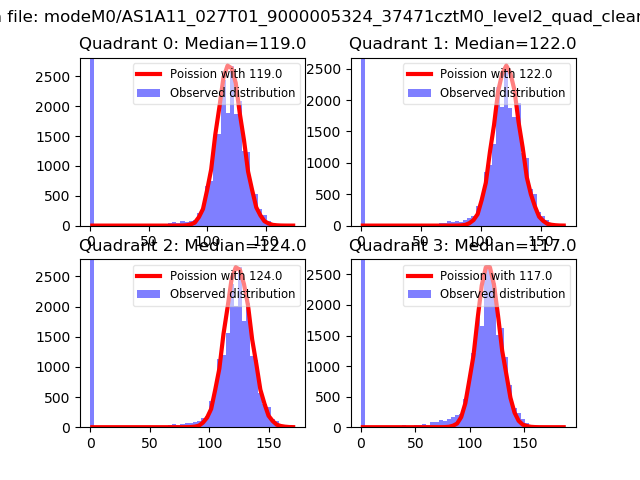 |
 |
| Quadrant-wise count rates Data is divided into 100 sec bins |
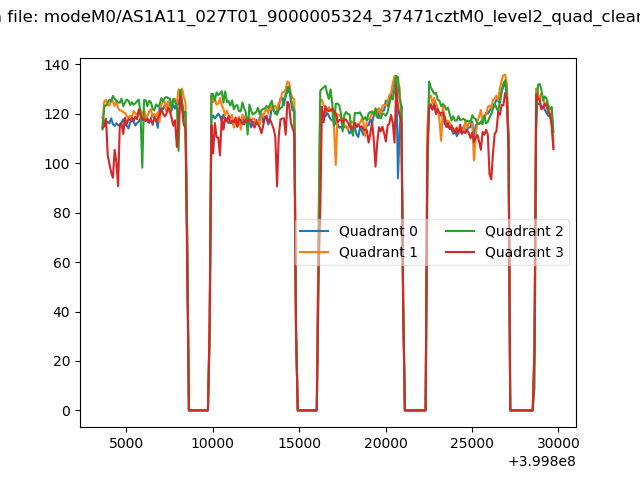 |
|
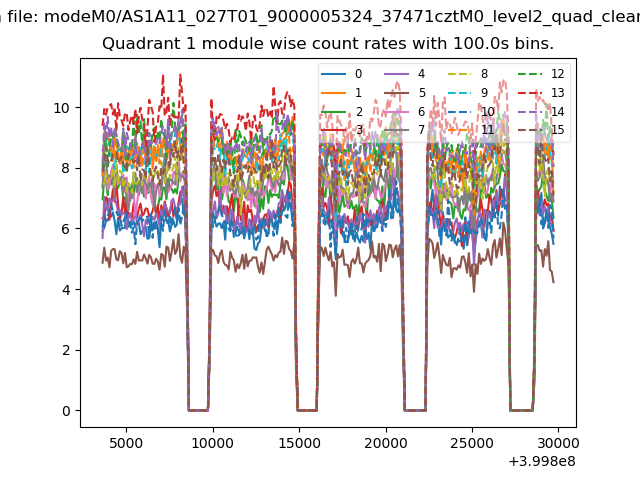
| Module-wise count rates for Quadrant A Data is divided into 100 sec bins |
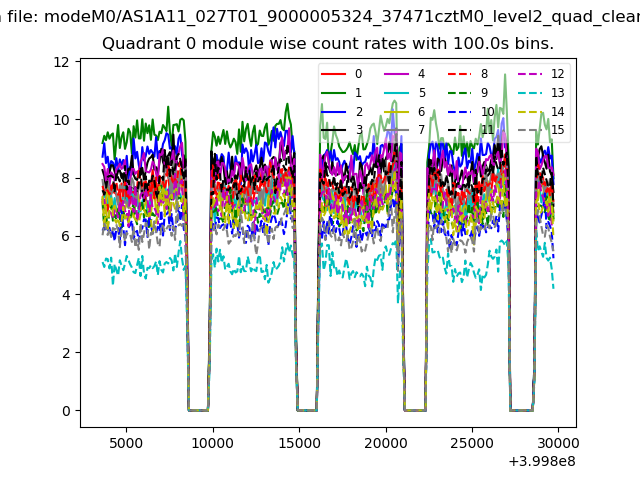 |
 |
| Module-wise count rates for Quadrant B Data is divided into 100 sec bins |
 |
 |
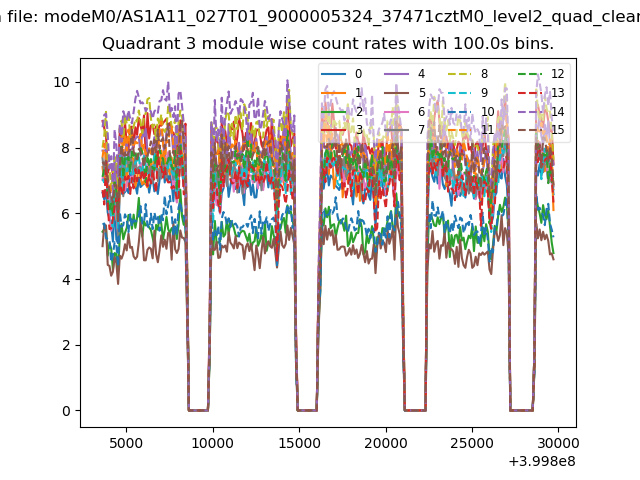
| Module-wise count rates for Quadrant C Data is divided into 100 sec bins |
 |
 |
| Module-wise count rates for Quadrant D Data is divided into 100 sec bins |
 |
 |
| Parameter | Plot |
|---|---|
| CZT HV Monitor | 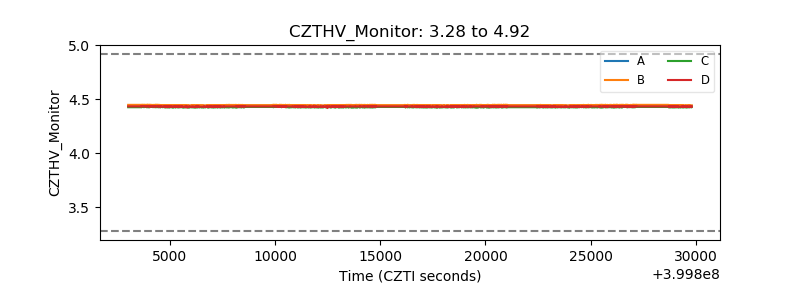 |
| D_VDD | 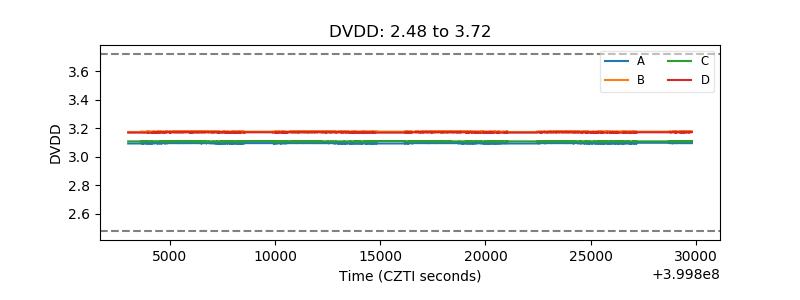 |
| Temperature 1 | 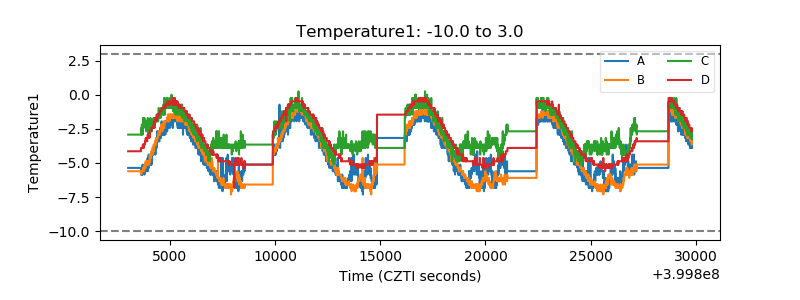 |
| Veto HV Monitor | 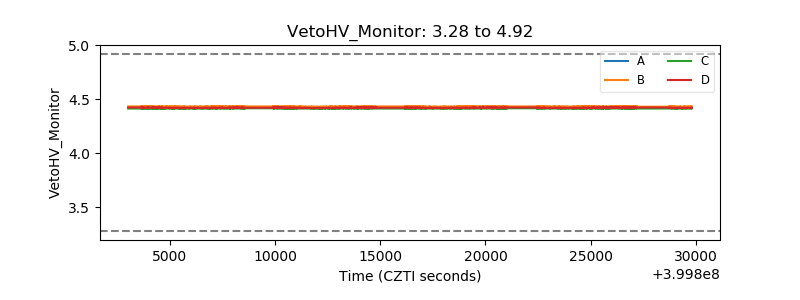 |
| Veto LLD | 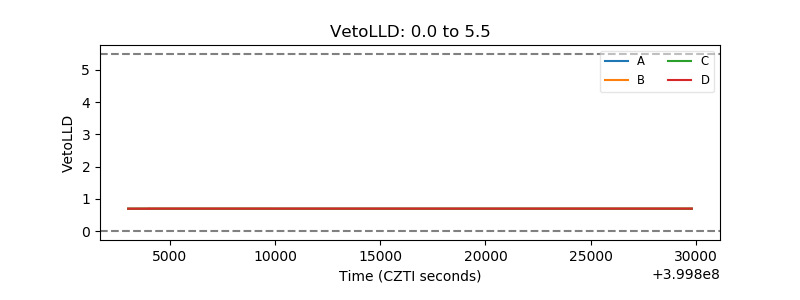 |
| Alpha Counter | 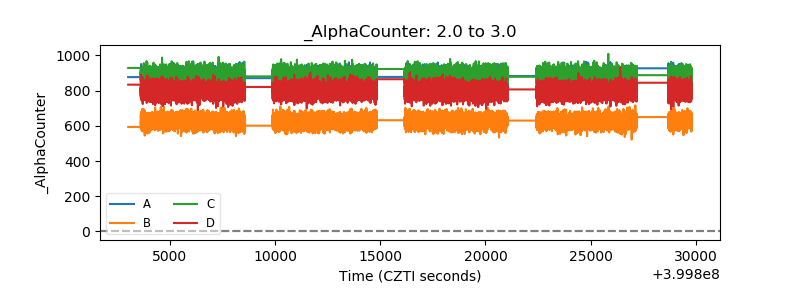 |
| _CPM_Rate | 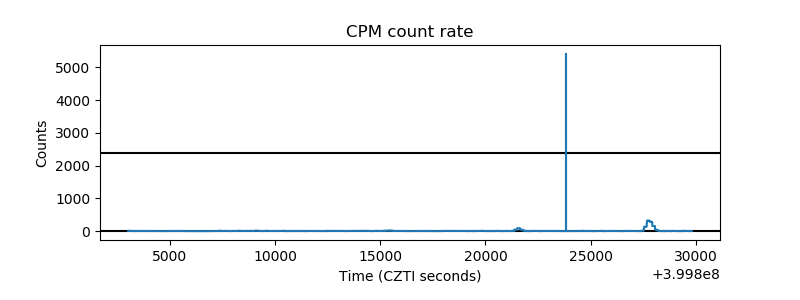 |
| CZT Counter | 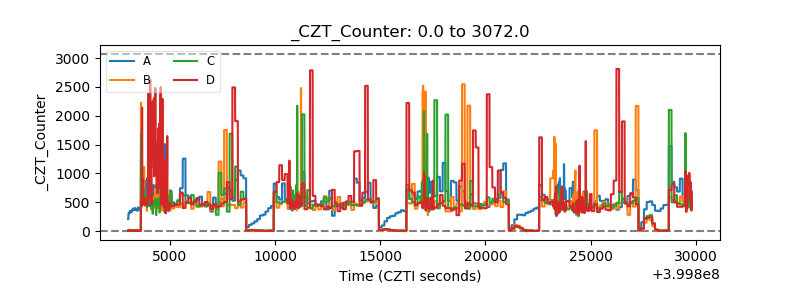 |
| +2.5 Volts monitor | 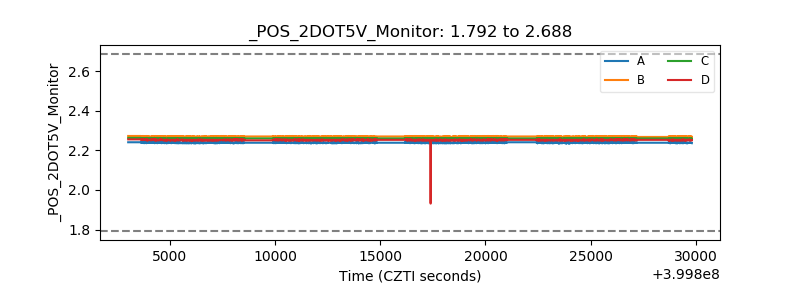 |
| +5 Volts monitor | 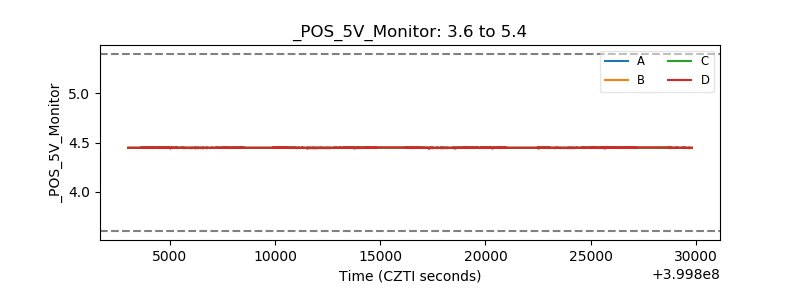 |
| _ROLL_ROT | 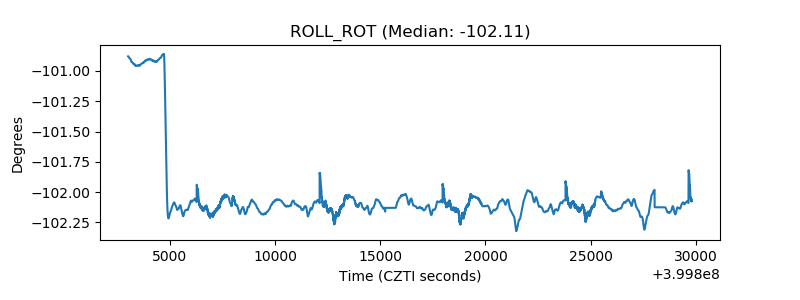 |
| _Roll_DEC | 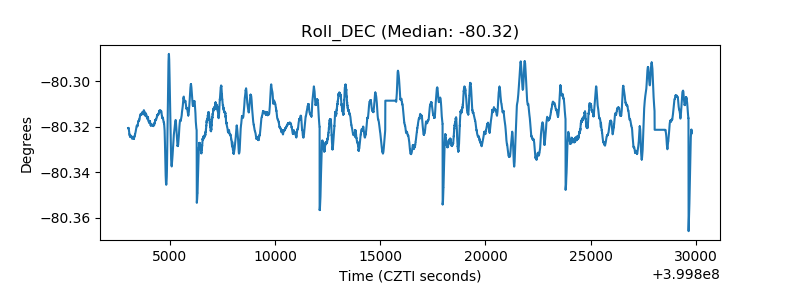 |
| _Roll_RA | 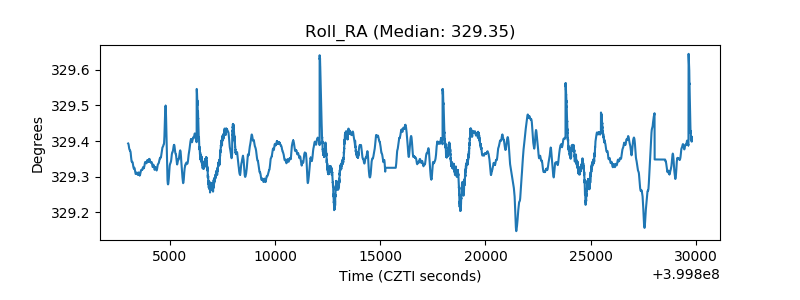 |
| Veto Counter | 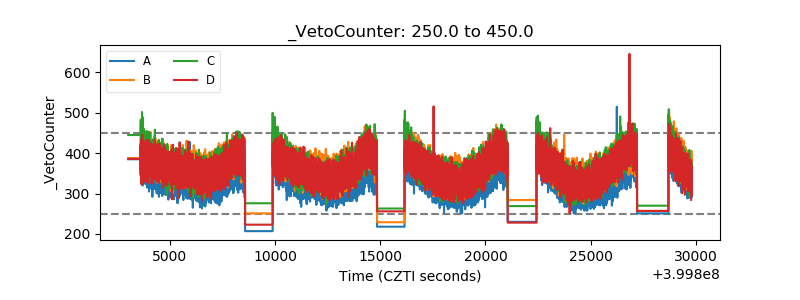 |