| Param | Original file | Final file |
|---|---|---|
| Filename | modeM0/AS1A11_027T01_9000005324_37472cztM0_level2.evt | modeM0/AS1A11_027T01_9000005324_37472cztM0_level2_quad_clean.evt |
| Size (bytes) | 428,448,960 | 99,976,320 |
| Size | 408.6 MB | 95.3 MB |
| Events in quadrant A | 3,500,855 | 660,808 |
| Events in quadrant B | 2,886,109 | 674,666 |
| Events in quadrant C | 2,965,981 | 669,515 |
| Events in quadrant D | 3,249,059 | 638,017 |
| Mode SS | |||
|---|---|---|---|
| Quadrant | BADHDUFLAG | Total packets | Discarded packets |
| A | 0 | 112 | 0 |
| B | 0 | 112 | 0 |
| C | 0 | 112 | 0 |
| D | 0 | 112 | 0 |
| Mode M9 | |||
|---|---|---|---|
| Quadrant | BADHDUFLAG | Total packets | Discarded packets |
| A | 0 | 19 | 0 |
| B | 0 | 19 | 0 |
| C | 0 | 19 | 0 |
| D | 0 | 20 | 0 |
| Mode M0 | |||
|---|---|---|---|
| Quadrant | BADHDUFLAG | Total packets | Discarded packets |
| A | 0 | 14077 | 3 |
| B | 0 | 12309 | 2 |
| C | 0 | 12320 | 2 |
| D | 0 | 13417 | 2 |
| Quadrant | Total seconds | Saturated seconds | Saturation percentage |
|---|---|---|---|
| A | 5499 | 33 | 0.600109% |
| B | 5499 | 79 | 1.436625% |
| C | 5499 | 116 | 2.109474% |
| D | 5499 | 158 | 2.873250% |
Noise dominated data is calculated using 1-second bins in cleaned event files. If a bin has >2000 counts, and if more than 50% of those come from <1% of pixels, then it is considered to be noise-dominated and hence unusable.
| Quadrant | # 1 sec bins | Bins with >0 counts | Bins with >2000 counts | High rate bins dominated by noise | Noise dominated (total time) | Noise dominated (detector-on time) | Marked lightcurve |
|---|---|---|---|---|---|---|---|
| A | 7113 | 5500 | 11 | 11 | 0.15% | 0.20% | 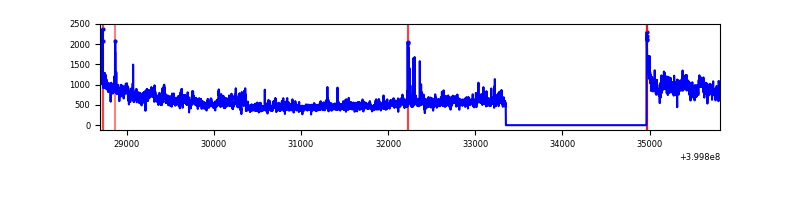 |
| B | 7113 | 5500 | 50 | 50 | 0.70% | 0.91% | 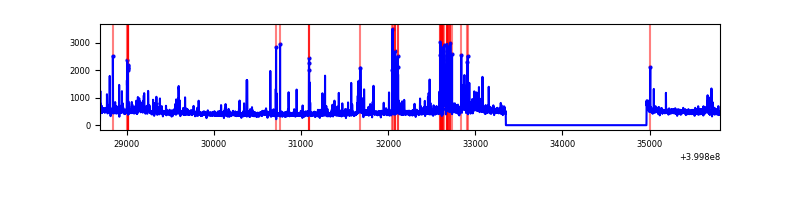 |
| C | 7113 | 5500 | 103 | 103 | 1.45% | 1.87% | 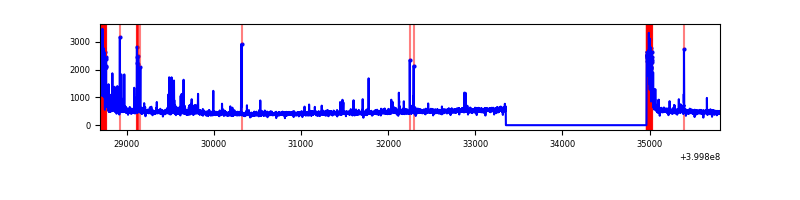 |
| D | 7113 | 5500 | 160 | 160 | 2.25% | 2.91% | 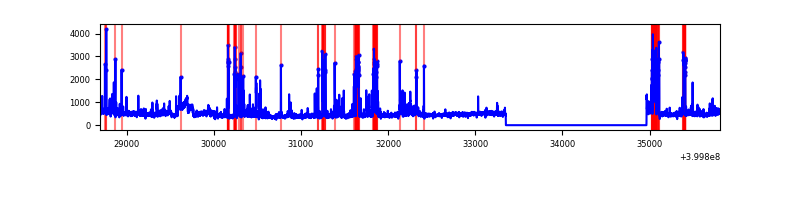 |
Top three noisy pixels from each quadrant. If the there are fewer than three noisy pixels in the level2.evt file, extra rows are filled as -1
| Pixel properties | Quadrant properties | ||||||
|---|---|---|---|---|---|---|---|
| Quadrant | DetID | PixID | Counts | Sigma | Mean | Median | Sigma |
| A | 15 | 222 | 733393 | 5919.99 | 609 | 597 | 123.8 |
| A | 10 | 83 | 304868 | 2458.09 | 609 | 597 | 123.8 |
| A | 13 | 248 | 36051 | 286.42 | 609 | 597 | 123.8 |
| B | 5 | 172 | 167568 | 1421.98 | 607 | 590 | 117.4 |
| B | 4 | 81 | 144392 | 1224.62 | 607 | 590 | 117.4 |
| B | 4 | 232 | 34967 | 292.75 | 607 | 590 | 117.4 |
| C | 0 | 10 | 259043 | 1876.33 | 590 | 594 | 137.7 |
| C | 15 | 214 | 233421 | 1690.32 | 590 | 594 | 137.7 |
| C | 14 | 254 | 112865 | 815.08 | 590 | 594 | 137.7 |
| D | 13 | 249 | 380852 | 2684.03 | 584 | 567 | 141.7 |
| D | 12 | 233 | 176895 | 1244.51 | 584 | 567 | 141.7 |
| D | 12 | 227 | 125658 | 882.88 | 584 | 567 | 141.7 |
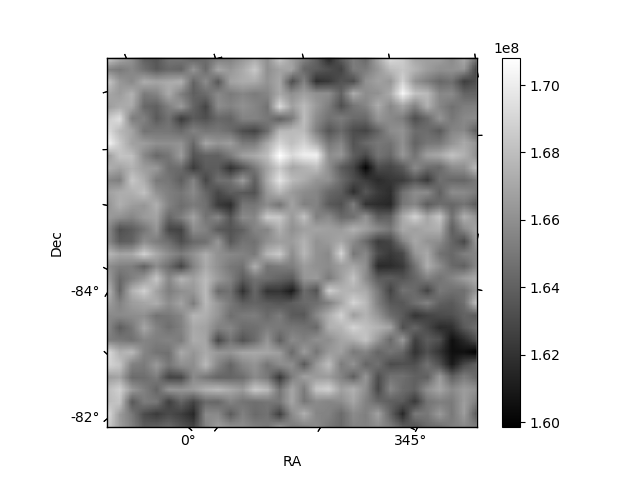
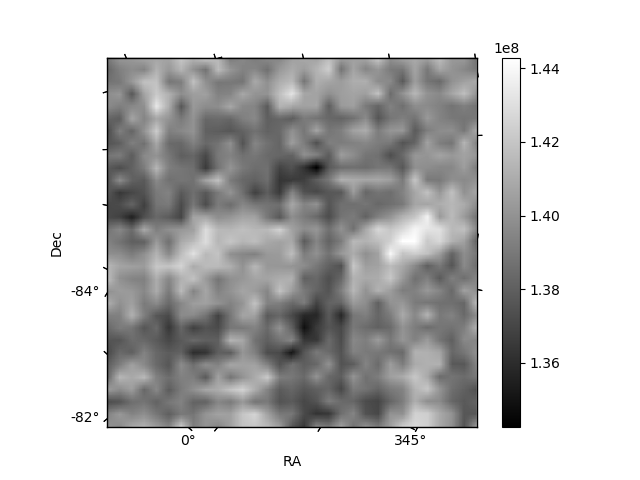
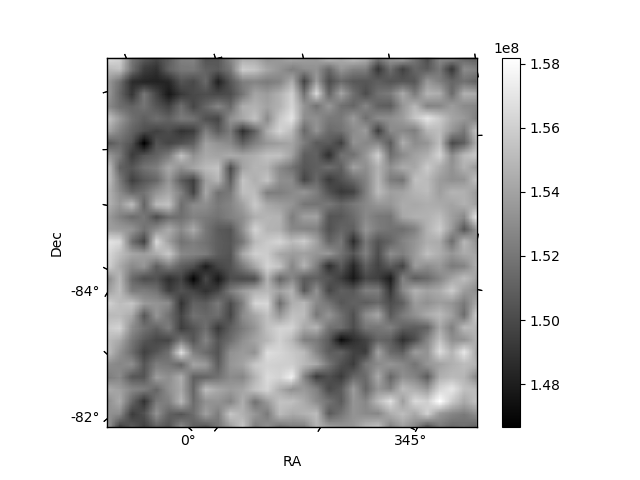
Histogram calculated using DETX and DETY for each event in the final _common_clean file
| Quadrant A | 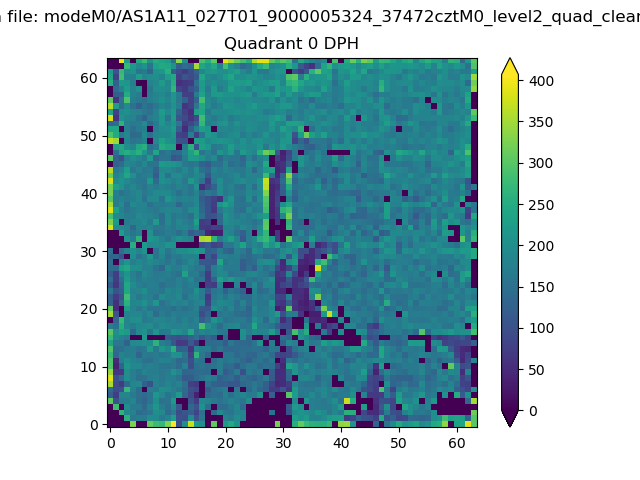 |
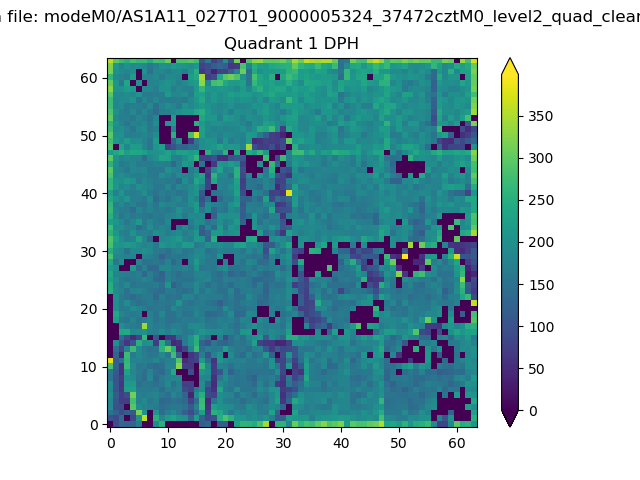 |
Quadrant B |
|---|---|---|---|
| Quadrant D | 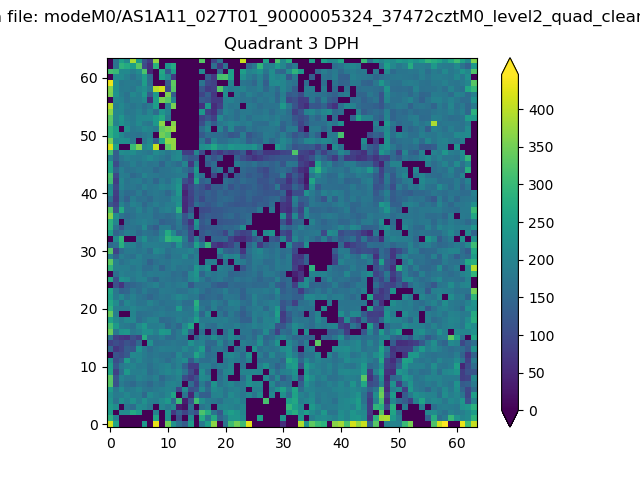 |
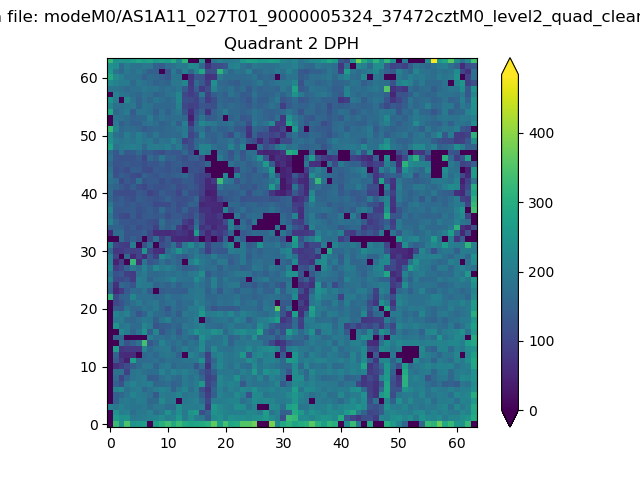 |
Quadrant C |
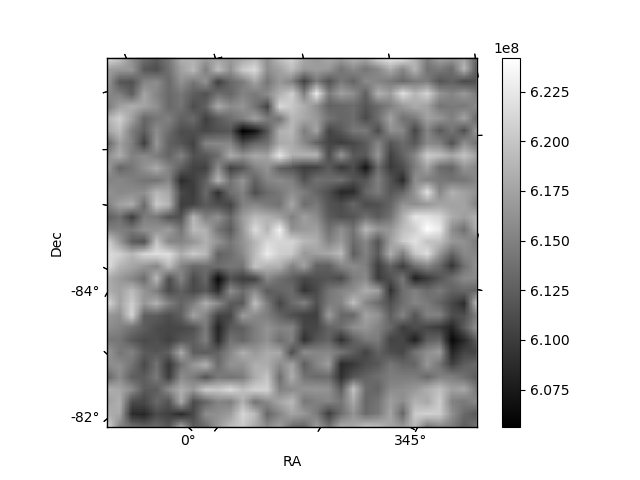
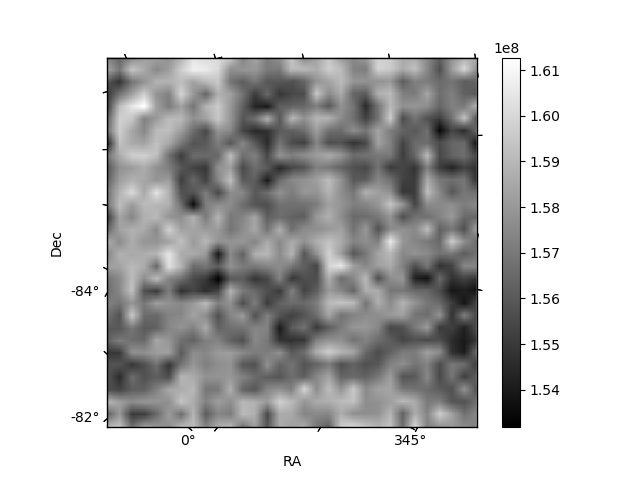
| Plot type | Count rate plots | Images |
|---|---|---|
| Comparison with Poisson distribution Blue bars denote a histogram of data divided into 1 sec bins. Red curve is a Poisson curve with rate = median count rate of data. |
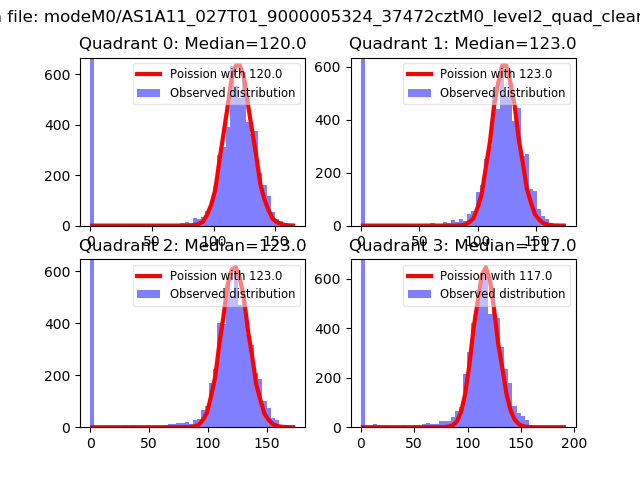 |
 |
| Quadrant-wise count rates Data is divided into 100 sec bins |
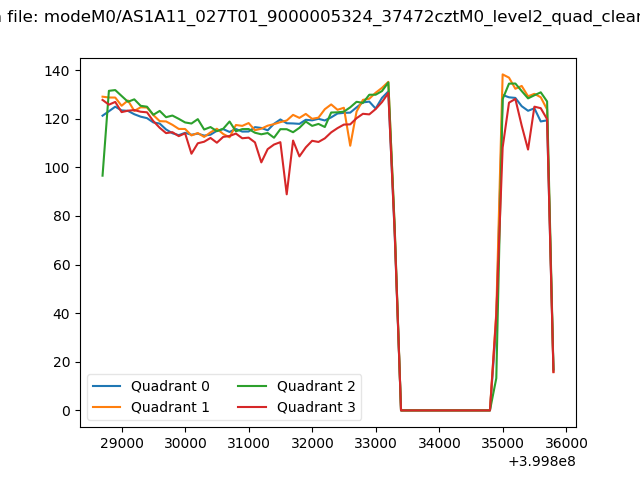 |
|
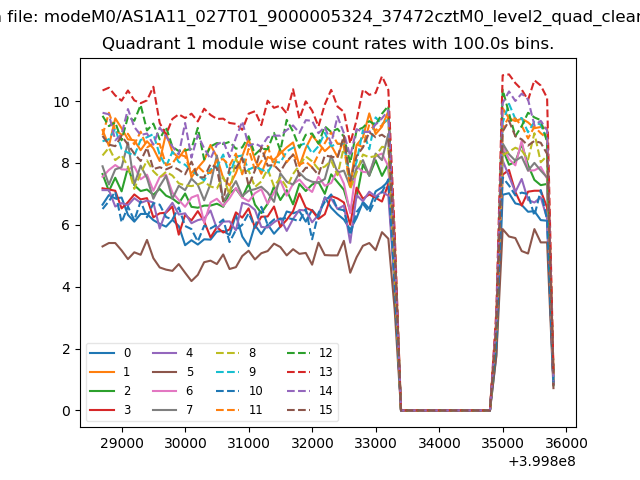
| Module-wise count rates for Quadrant A Data is divided into 100 sec bins |
 |
 |
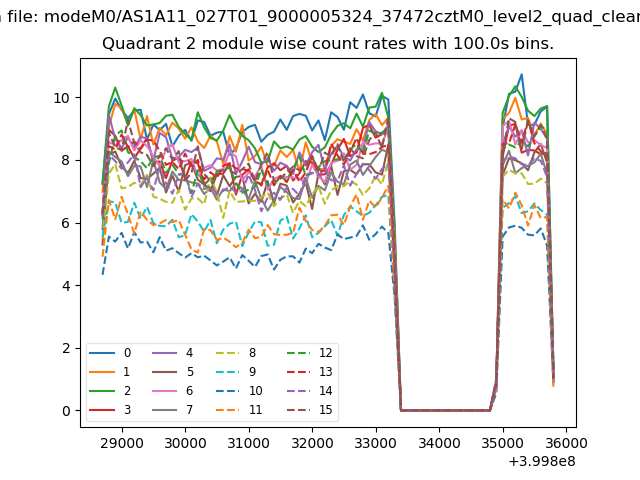
| Module-wise count rates for Quadrant B Data is divided into 100 sec bins |
 |
 |
| Module-wise count rates for Quadrant C Data is divided into 100 sec bins |
 |
 |
| Module-wise count rates for Quadrant D Data is divided into 100 sec bins |
 |
 |
| Parameter | Plot |
|---|---|
| CZT HV Monitor | 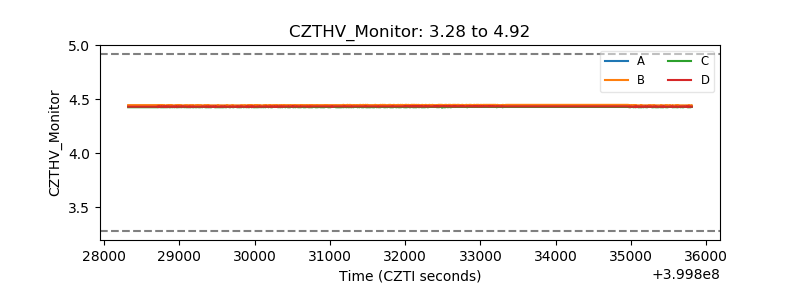 |
| D_VDD | 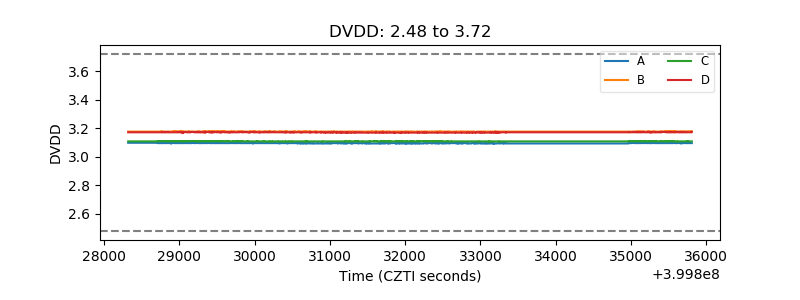 |
| Temperature 1 | 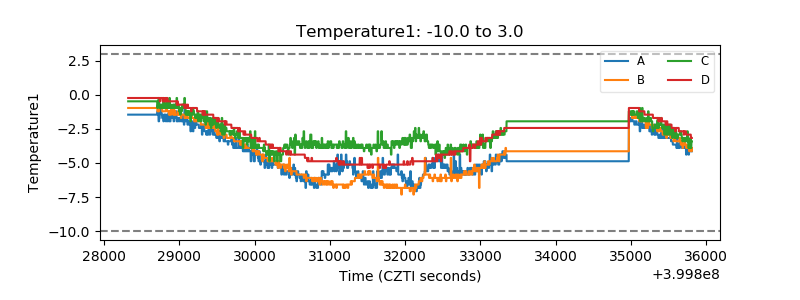 |
| Veto HV Monitor | 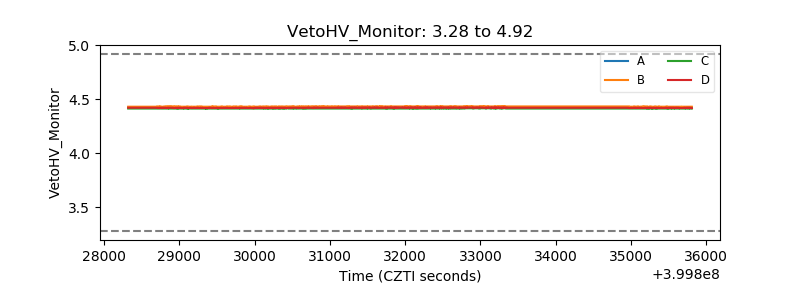 |
| Veto LLD | 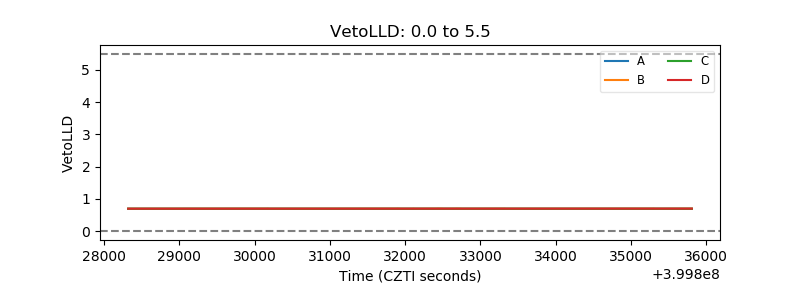 |
| Alpha Counter | 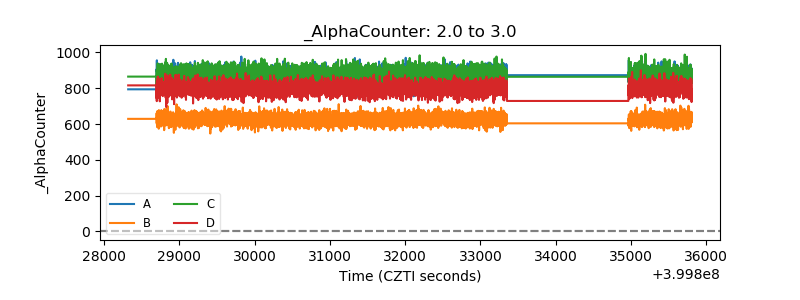 |
| _CPM_Rate | 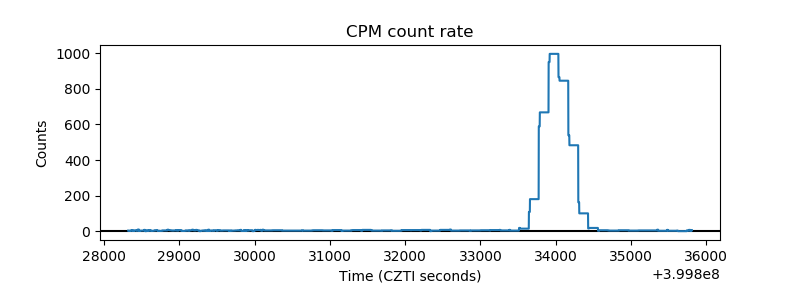 |
| CZT Counter | 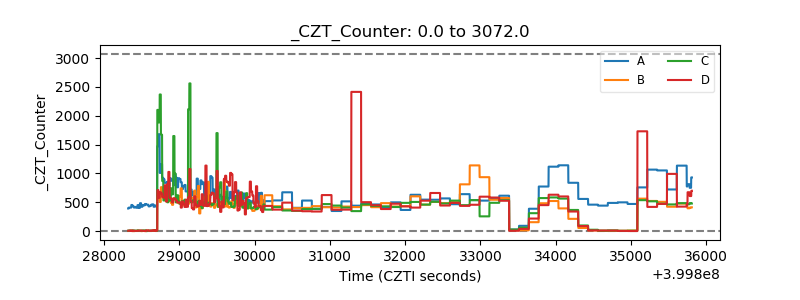 |
| +2.5 Volts monitor | 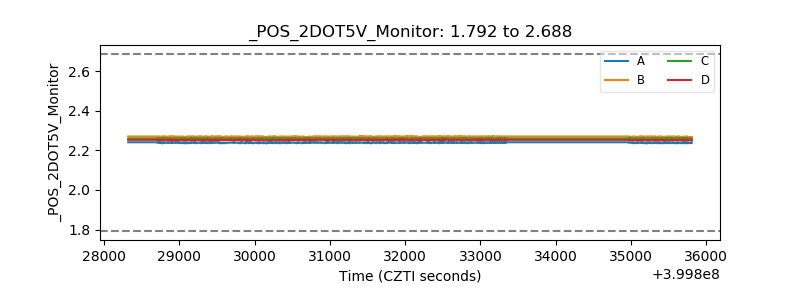 |
| +5 Volts monitor | 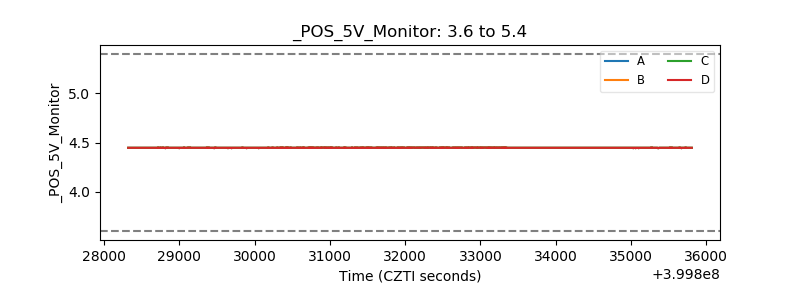 |
| _ROLL_ROT | 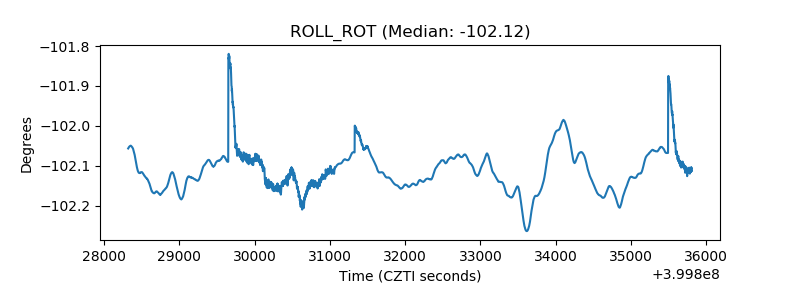 |
| _Roll_DEC | 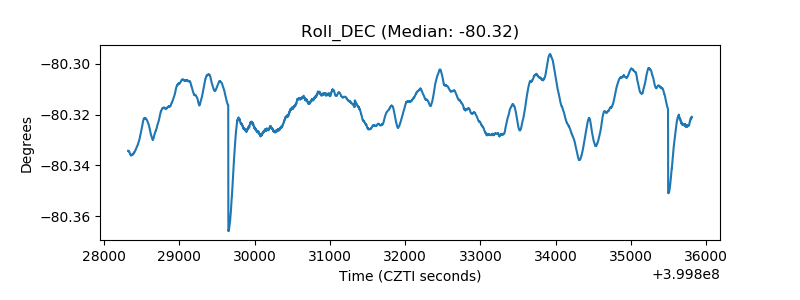 |
| _Roll_RA | 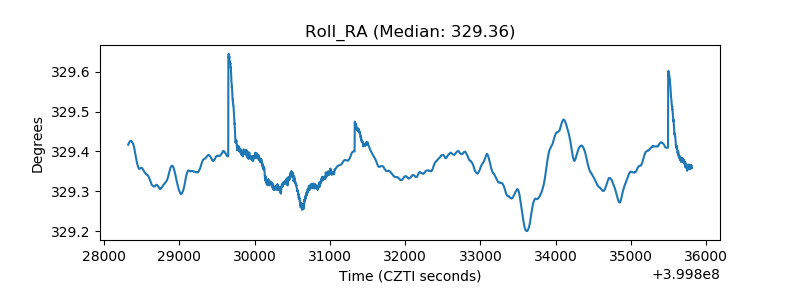 |
| Veto Counter | 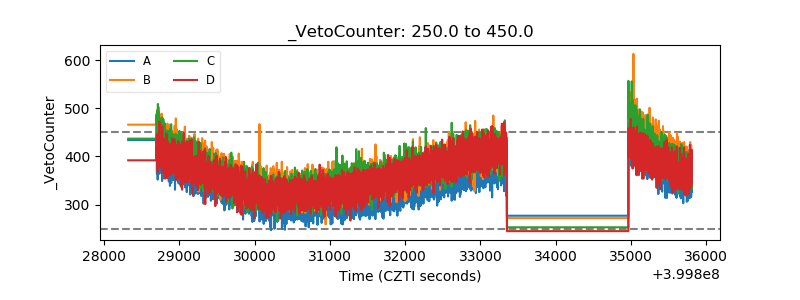 |