| Param | Original file | Final file |
|---|---|---|
| Filename | modeM0/AS1A11_027T01_9000005324_37475cztM0_level2.evt | modeM0/AS1A11_027T01_9000005324_37475cztM0_level2_quad_clean.evt |
| Size (bytes) | 421,341,120 | 97,107,840 |
| Size | 401.8 MB | 92.6 MB |
| Events in quadrant A | 3,561,110 | 647,156 |
| Events in quadrant B | 2,577,737 | 673,711 |
| Events in quadrant C | 2,815,765 | 651,316 |
| Events in quadrant D | 3,460,585 | 612,497 |
| Mode SS | |||
|---|---|---|---|
| Quadrant | BADHDUFLAG | Total packets | Discarded packets |
| A | 0 | 104 | 0 |
| B | 0 | 104 | 0 |
| C | 0 | 104 | 0 |
| D | 0 | 104 | 0 |
| Mode M9 | |||
|---|---|---|---|
| Quadrant | BADHDUFLAG | Total packets | Discarded packets |
| A | 0 | 25 | 0 |
| B | 0 | 25 | 0 |
| C | 0 | 25 | 0 |
| D | 0 | 26 | 0 |
| Mode M0 | |||
|---|---|---|---|
| Quadrant | BADHDUFLAG | Total packets | Discarded packets |
| A | 0 | 14238 | 3 |
| B | 0 | 11010 | 2 |
| C | 0 | 11479 | 2 |
| D | 0 | 13828 | 2 |
| Quadrant | Total seconds | Saturated seconds | Saturation percentage |
|---|---|---|---|
| A | 5080 | 40 | 0.787402% |
| B | 5080 | 35 | 0.688976% |
| C | 5080 | 133 | 2.618110% |
| D | 5080 | 252 | 4.960630% |
Noise dominated data is calculated using 1-second bins in cleaned event files. If a bin has >2000 counts, and if more than 50% of those come from <1% of pixels, then it is considered to be noise-dominated and hence unusable.
| Quadrant | # 1 sec bins | Bins with >0 counts | Bins with >2000 counts | High rate bins dominated by noise | Noise dominated (total time) | Noise dominated (detector-on time) | Marked lightcurve |
|---|---|---|---|---|---|---|---|
| A | 6964 | 5081 | 31 | 31 | 0.45% | 0.61% | 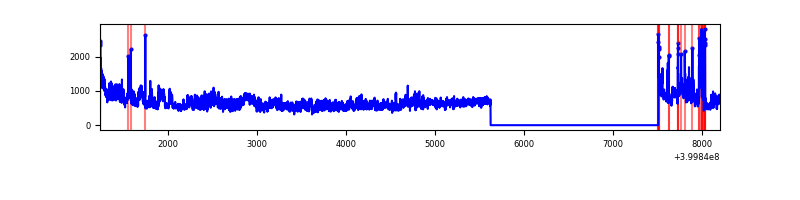 |
| B | 6964 | 5081 | 22 | 22 | 0.32% | 0.43% | 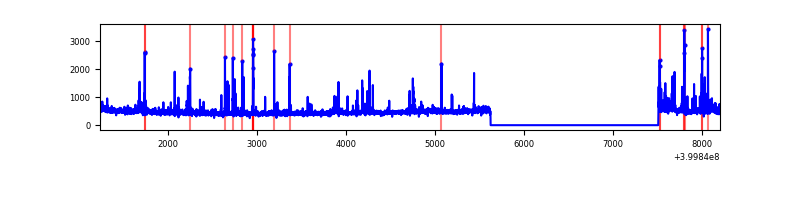 |
| C | 6964 | 5081 | 130 | 130 | 1.87% | 2.56% | 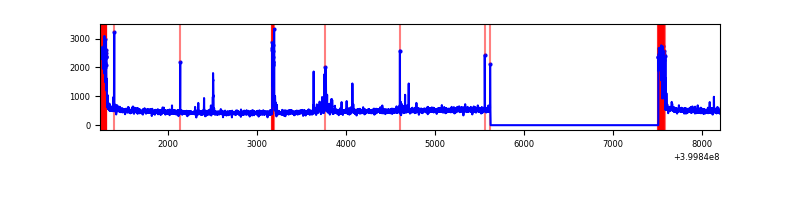 |
| D | 6964 | 5081 | 226 | 226 | 3.25% | 4.45% | 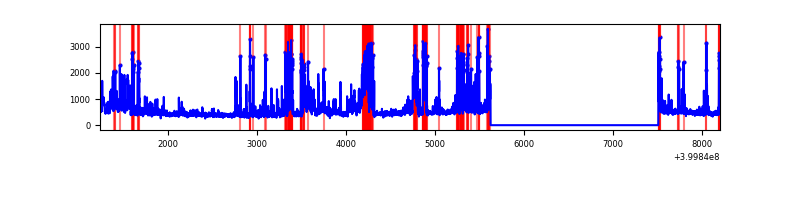 |
Top three noisy pixels from each quadrant. If the there are fewer than three noisy pixels in the level2.evt file, extra rows are filled as -1
| Pixel properties | Quadrant properties | ||||||
|---|---|---|---|---|---|---|---|
| Quadrant | DetID | PixID | Counts | Sigma | Mean | Median | Sigma |
| A | 15 | 222 | 873582 | 7608.64 | 571 | 560 | 114.7 |
| A | 10 | 83 | 281798 | 2451.07 | 571 | 560 | 114.7 |
| A | 9 | 143 | 79565 | 688.55 | 571 | 560 | 114.7 |
| B | 5 | 172 | 169264 | 1539.94 | 578 | 563 | 109.6 |
| B | 0 | 213 | 42402 | 381.92 | 578 | 563 | 109.6 |
| B | 0 | 229 | 31902 | 286.07 | 578 | 563 | 109.6 |
| C | 0 | 10 | 290756 | 2245.19 | 556 | 559 | 129.3 |
| C | 15 | 214 | 215073 | 1659.65 | 556 | 559 | 129.3 |
| C | 12 | 250 | 53364 | 408.54 | 556 | 559 | 129.3 |
| D | 13 | 249 | 924690 | 6899.7 | 547 | 531 | 133.9 |
| D | 12 | 227 | 135669 | 1008.93 | 547 | 531 | 133.9 |
| D | 2 | 153 | 89977 | 667.8 | 547 | 531 | 133.9 |
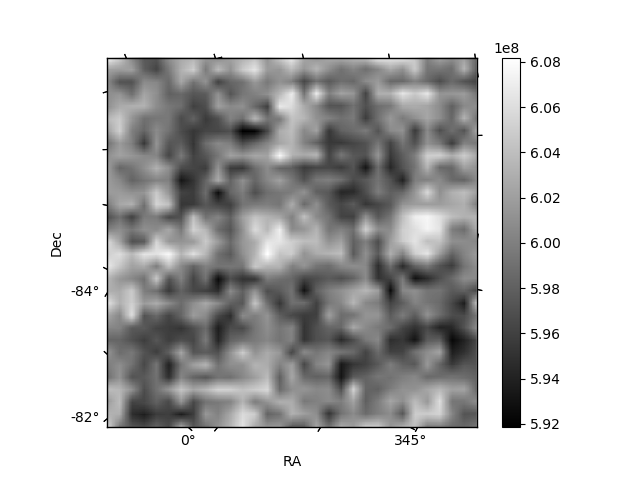
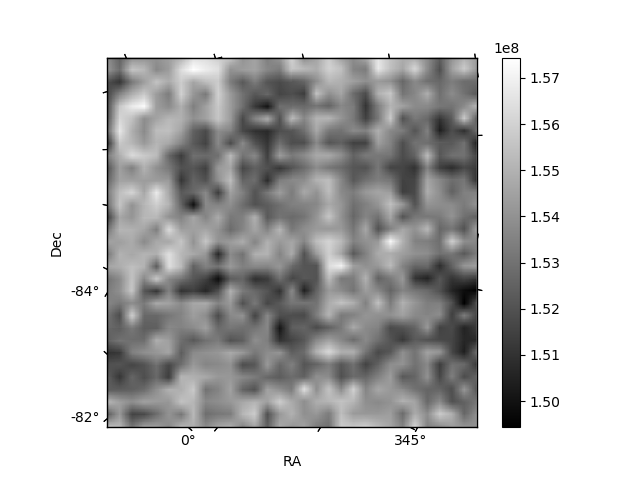
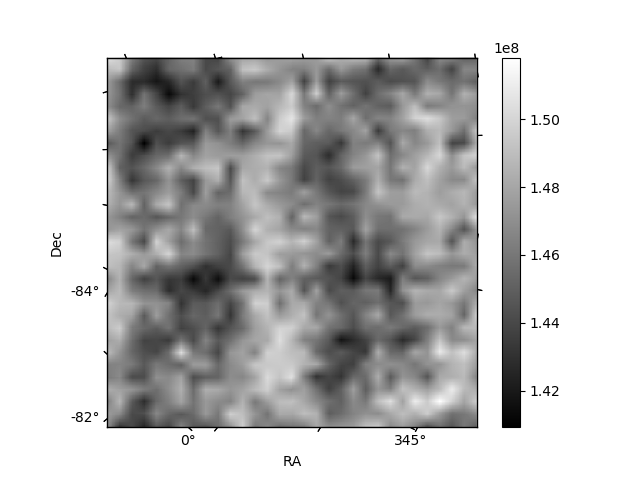
Histogram calculated using DETX and DETY for each event in the final _common_clean file
| Quadrant A | 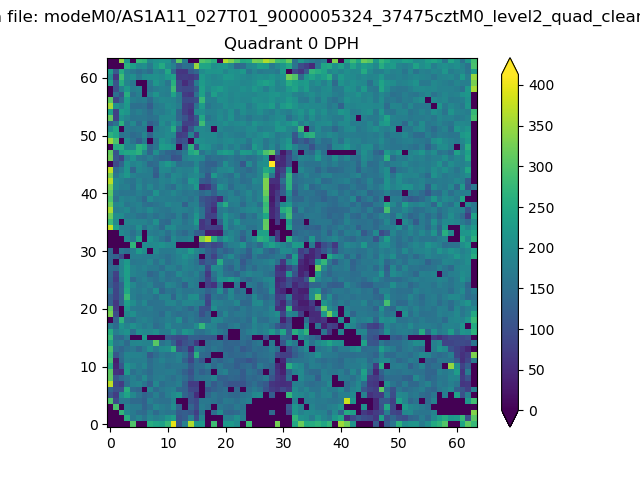 |
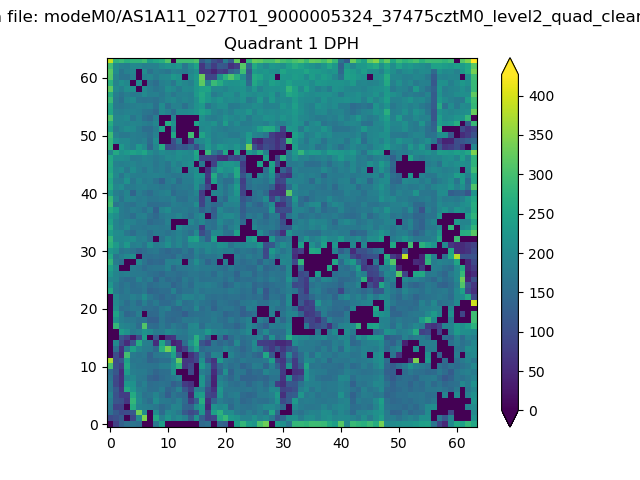 |
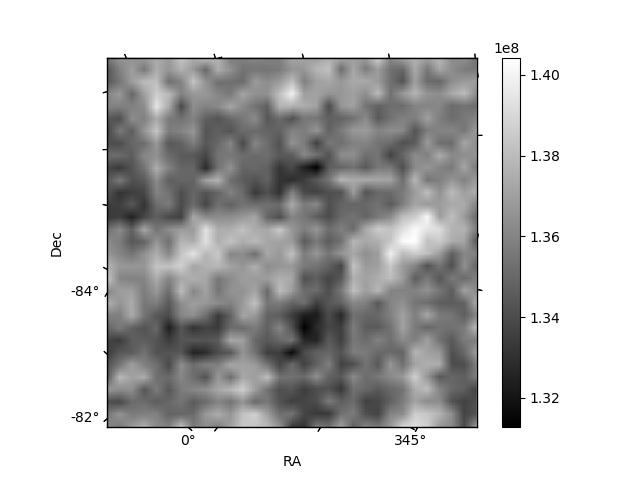
Quadrant B |
|---|---|---|---|
| Quadrant D | 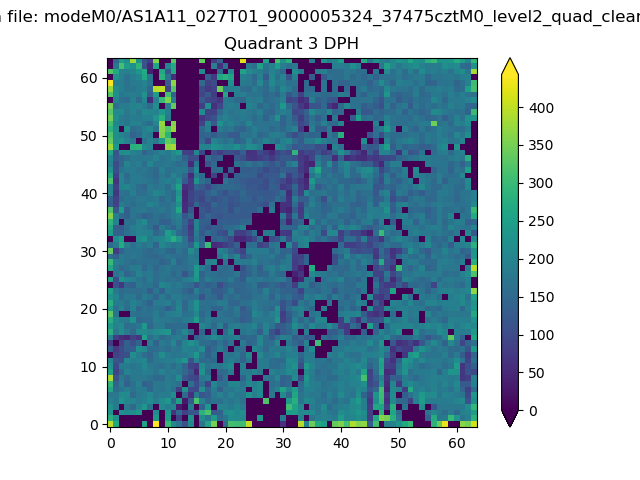 |
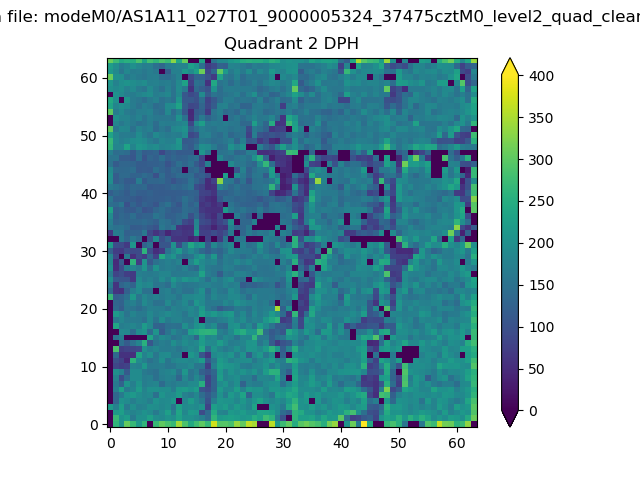 |
Quadrant C |
| Plot type | Count rate plots | Images |
|---|---|---|
| Comparison with Poisson distribution Blue bars denote a histogram of data divided into 1 sec bins. Red curve is a Poisson curve with rate = median count rate of data. |
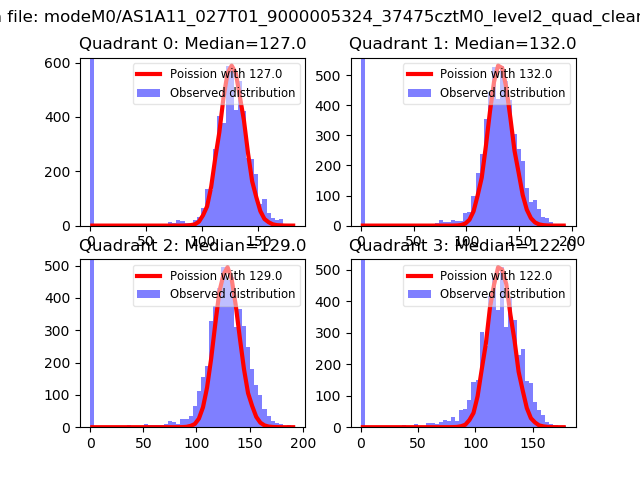 |
 |
| Quadrant-wise count rates Data is divided into 100 sec bins |
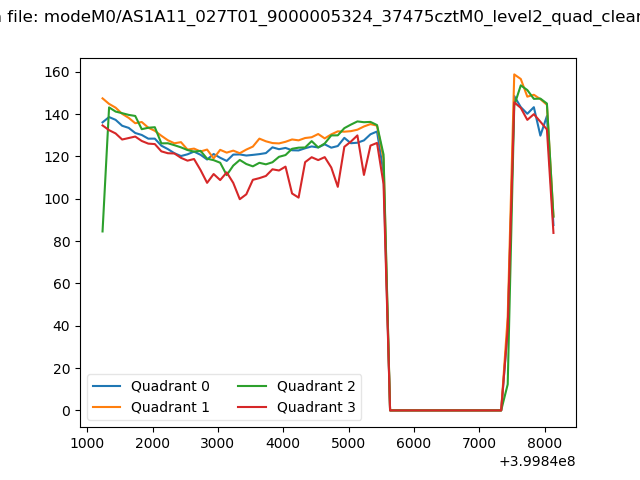 |
|
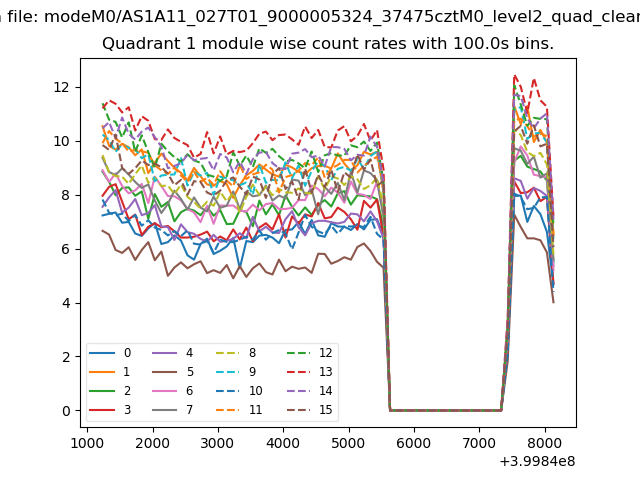
| Module-wise count rates for Quadrant A Data is divided into 100 sec bins |
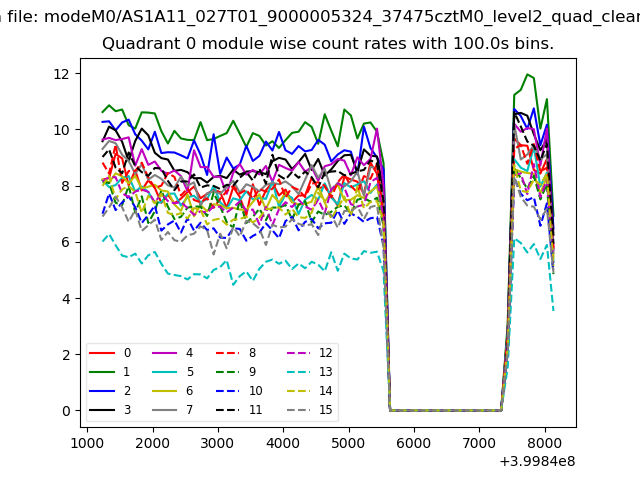 |
 |
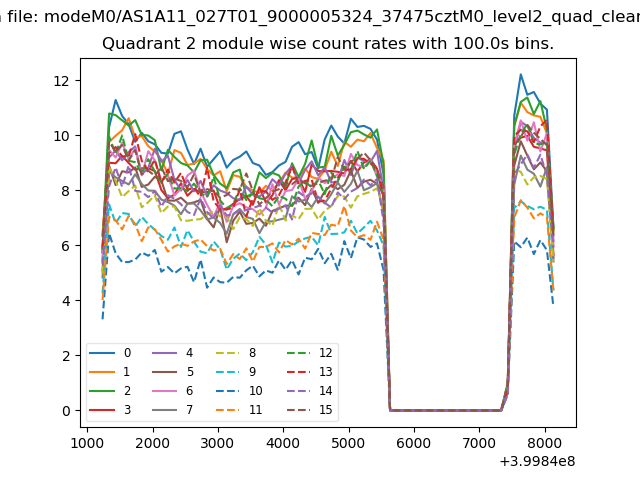
| Module-wise count rates for Quadrant B Data is divided into 100 sec bins |
 |
 |
| Module-wise count rates for Quadrant C Data is divided into 100 sec bins |
 |
 |
| Module-wise count rates for Quadrant D Data is divided into 100 sec bins |
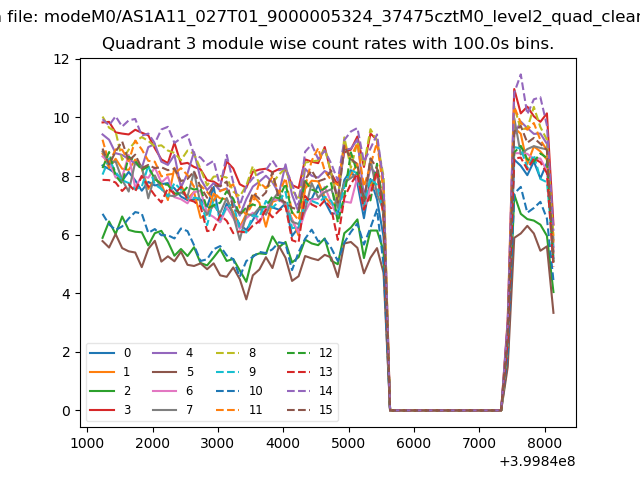 |
 |
| Parameter | Plot |
|---|---|
| CZT HV Monitor | 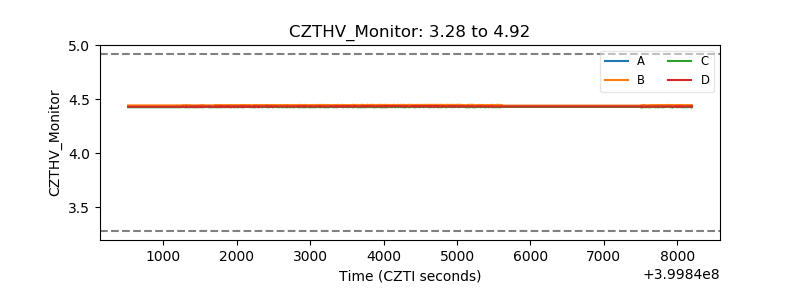 |
| D_VDD | 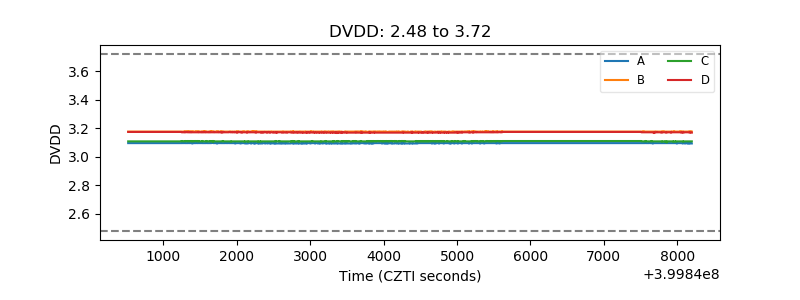 |
| Temperature 1 | 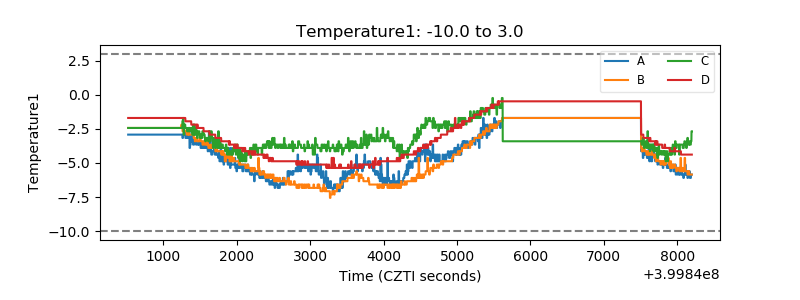 |
| Veto HV Monitor | 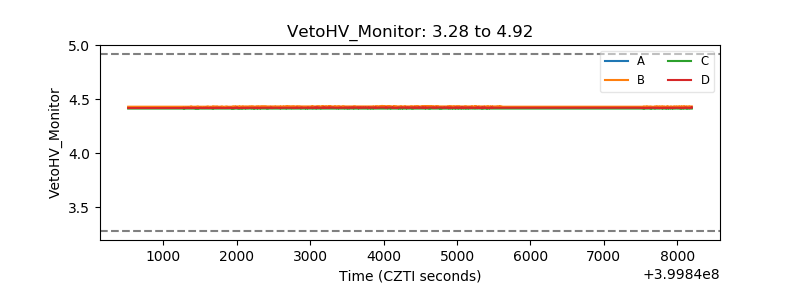 |
| Veto LLD | 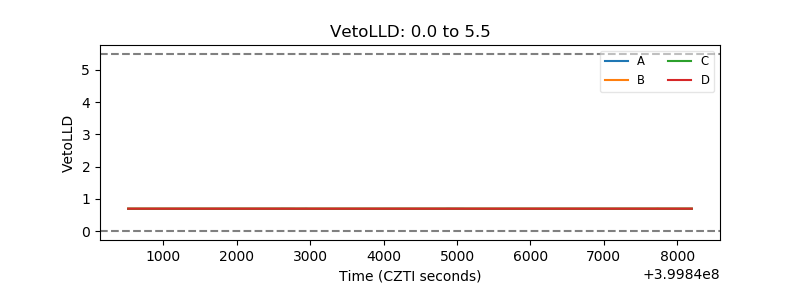 |
| Alpha Counter | 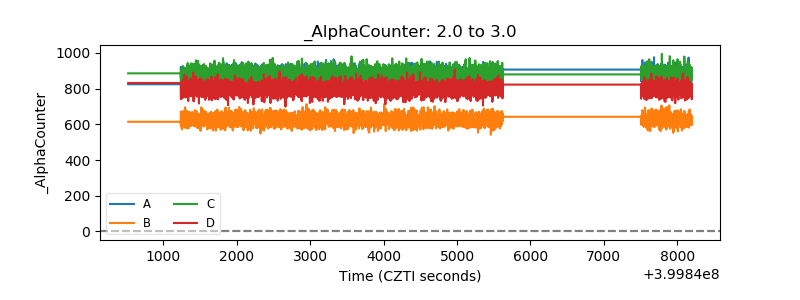 |
| _CPM_Rate | 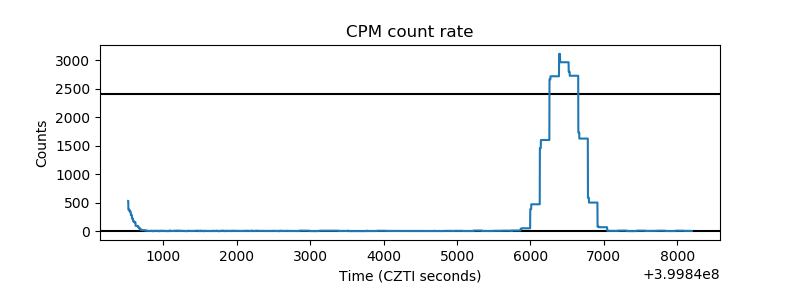 |
| CZT Counter | 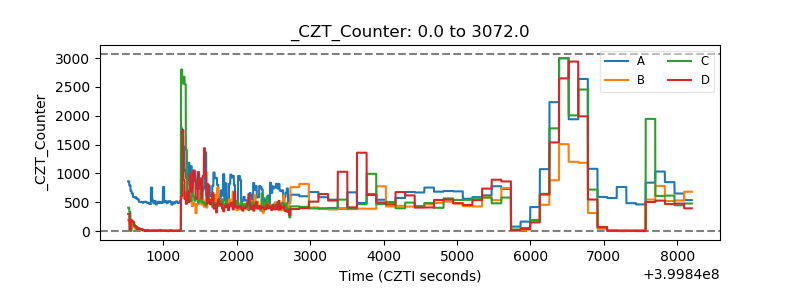 |
| +2.5 Volts monitor | 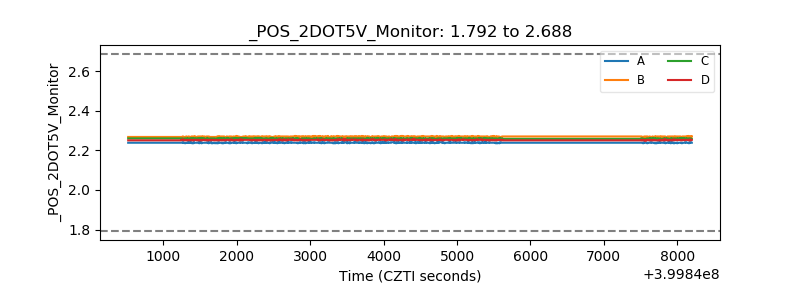 |
| +5 Volts monitor | 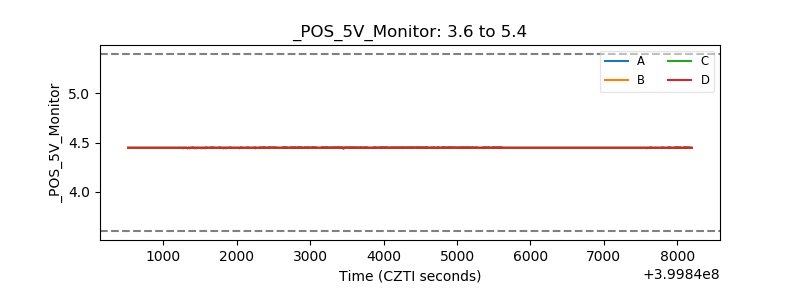 |
| _ROLL_ROT | 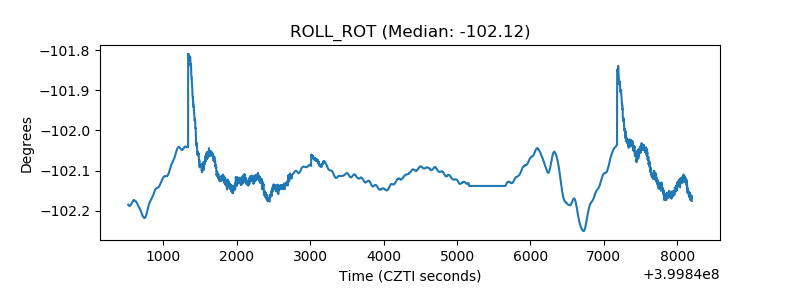 |
| _Roll_DEC | 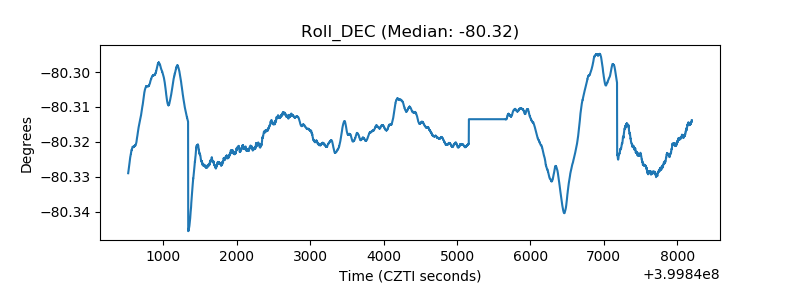 |
| _Roll_RA | 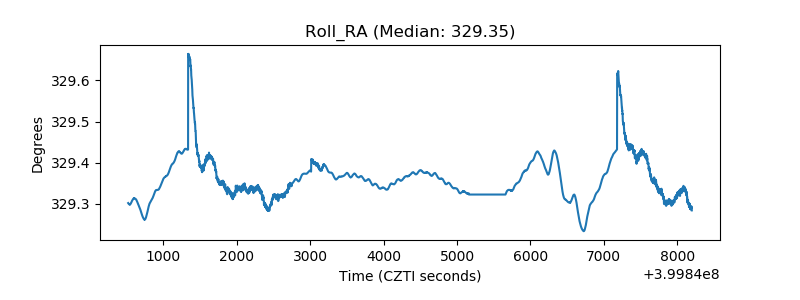 |
| Veto Counter | 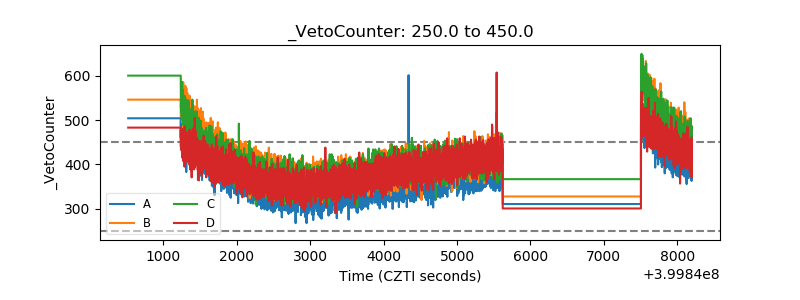 |