| Param | Original file | Final file |
|---|---|---|
| Filename | modeM0/AS1A11_027T01_9000005324_37476cztM0_level2.evt | modeM0/AS1A11_027T01_9000005324_37476cztM0_level2_quad_clean.evt |
| Size (bytes) | 416,171,520 | 101,059,200 |
| Size | 396.9 MB | 96.4 MB |
| Events in quadrant A | 3,367,937 | 675,768 |
| Events in quadrant B | 2,814,990 | 701,674 |
| Events in quadrant C | 3,019,221 | 681,622 |
| Events in quadrant D | 3,056,925 | 645,851 |
| Mode SS | |||
|---|---|---|---|
| Quadrant | BADHDUFLAG | Total packets | Discarded packets |
| A | 0 | 104 | 0 |
| B | 0 | 104 | 0 |
| C | 0 | 104 | 0 |
| D | 0 | 104 | 0 |
| Mode M9 | |||
|---|---|---|---|
| Quadrant | BADHDUFLAG | Total packets | Discarded packets |
| A | 0 | 37 | 0 |
| B | 0 | 37 | 0 |
| C | 0 | 37 | 0 |
| D | 0 | 37 | 0 |
| Mode M0 | |||
|---|---|---|---|
| Quadrant | BADHDUFLAG | Total packets | Discarded packets |
| A | 0 | 13519 | 3 |
| B | 0 | 11621 | 2 |
| C | 0 | 12002 | 2 |
| D | 0 | 12507 | 2 |
| Quadrant | Total seconds | Saturated seconds | Saturation percentage |
|---|---|---|---|
| A | 5071 | 36 | 0.709919% |
| B | 5071 | 88 | 1.735358% |
| C | 5071 | 171 | 3.372116% |
| D | 5071 | 143 | 2.819957% |
Noise dominated data is calculated using 1-second bins in cleaned event files. If a bin has >2000 counts, and if more than 50% of those come from <1% of pixels, then it is considered to be noise-dominated and hence unusable.
| Quadrant | # 1 sec bins | Bins with >0 counts | Bins with >2000 counts | High rate bins dominated by noise | Noise dominated (total time) | Noise dominated (detector-on time) | Marked lightcurve |
|---|---|---|---|---|---|---|---|
| A | 7073 | 5072 | 28 | 28 | 0.40% | 0.55% |  |
| B | 7073 | 5072 | 59 | 59 | 0.83% | 1.16% | 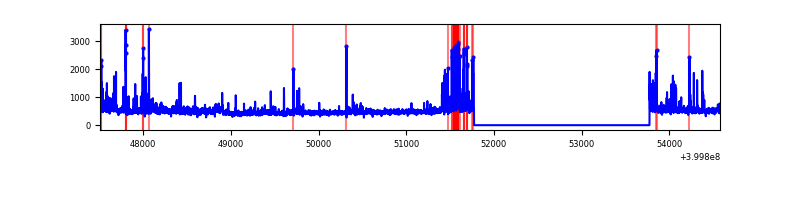 |
| C | 7073 | 5072 | 164 | 164 | 2.32% | 3.23% | 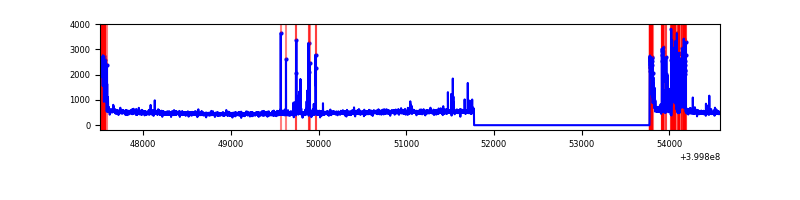 |
| D | 7073 | 5072 | 124 | 124 | 1.75% | 2.44% | 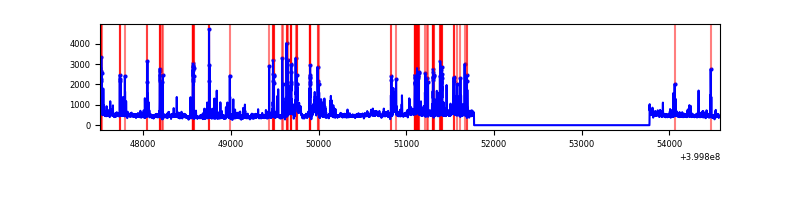 |
Top three noisy pixels from each quadrant. If the there are fewer than three noisy pixels in the level2.evt file, extra rows are filled as -1
| Pixel properties | Quadrant properties | ||||||
|---|---|---|---|---|---|---|---|
| Quadrant | DetID | PixID | Counts | Sigma | Mean | Median | Sigma |
| A | 15 | 222 | 574743 | 4919.47 | 584 | 574 | 116.7 |
| A | 10 | 83 | 270807 | 2315.35 | 584 | 574 | 116.7 |
| A | 6 | 10 | 81288 | 691.56 | 584 | 574 | 116.7 |
| B | 5 | 255 | 261021 | 2333.89 | 588 | 572 | 111.6 |
| B | 0 | 213 | 85017 | 756.71 | 588 | 572 | 111.6 |
| B | 5 | 172 | 83410 | 742.31 | 588 | 572 | 111.6 |
| C | 14 | 254 | 338403 | 2554.86 | 573 | 578 | 132.2 |
| C | 0 | 10 | 217723 | 1642.2 | 573 | 578 | 132.2 |
| C | 15 | 214 | 215224 | 1623.3 | 573 | 578 | 132.2 |
| D | 13 | 249 | 544355 | 4004.99 | 565 | 552 | 135.8 |
| D | 12 | 227 | 86626 | 633.92 | 565 | 552 | 135.8 |
| D | 2 | 153 | 68527 | 500.62 | 565 | 552 | 135.8 |
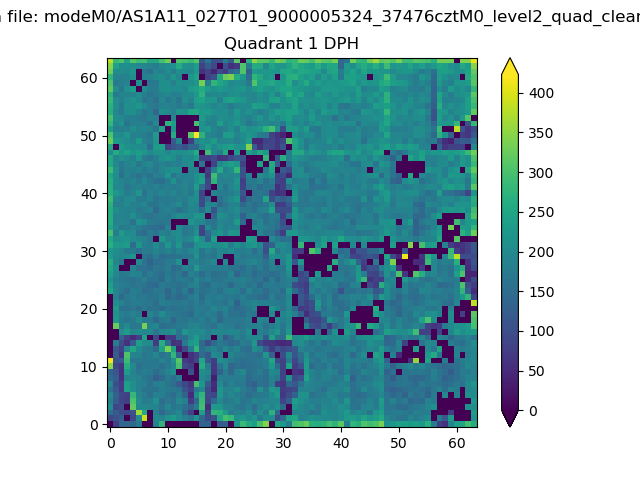
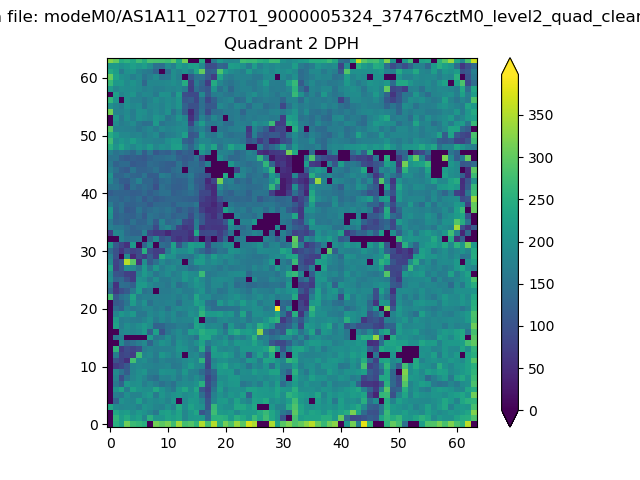
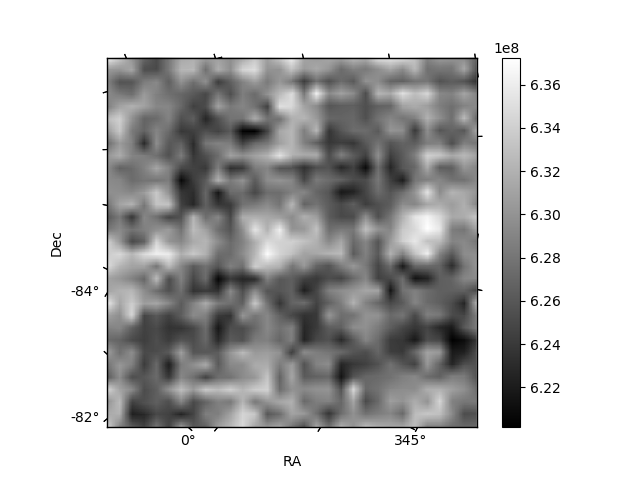
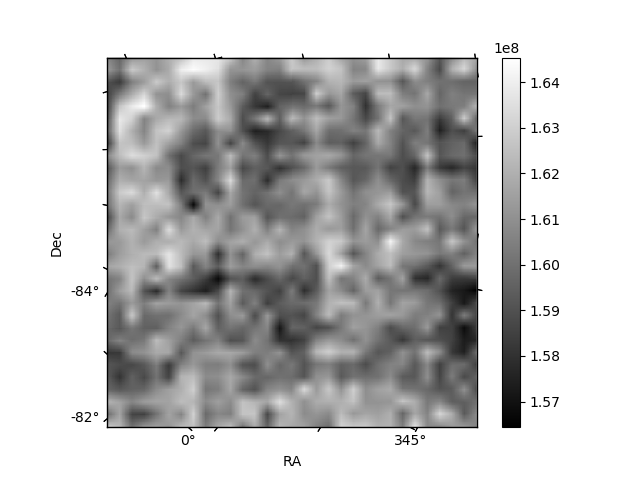
Histogram calculated using DETX and DETY for each event in the final _common_clean file
| Quadrant A | 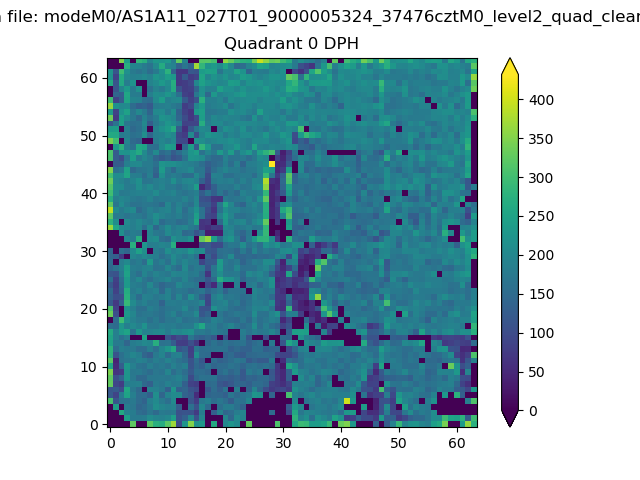 |
 |
Quadrant B |
|---|---|---|---|
| Quadrant D | 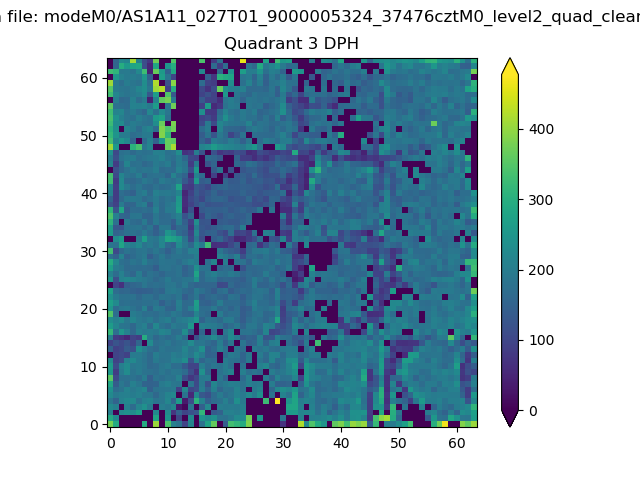 |
 |
Quadrant C |
| Plot type | Count rate plots | Images |
|---|---|---|
| Comparison with Poisson distribution Blue bars denote a histogram of data divided into 1 sec bins. Red curve is a Poisson curve with rate = median count rate of data. |
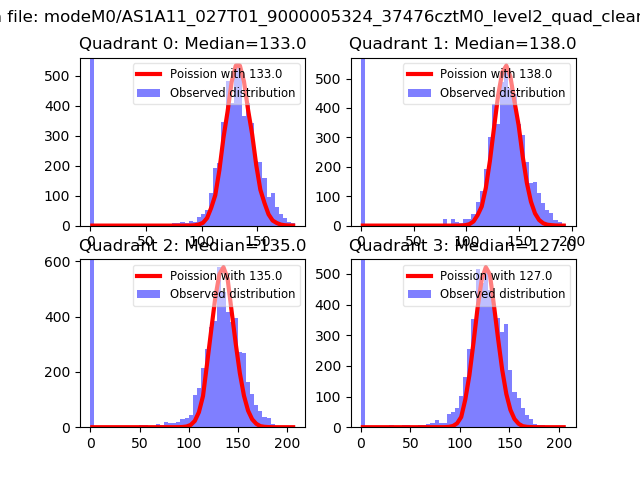 |
 |
| Quadrant-wise count rates Data is divided into 100 sec bins |
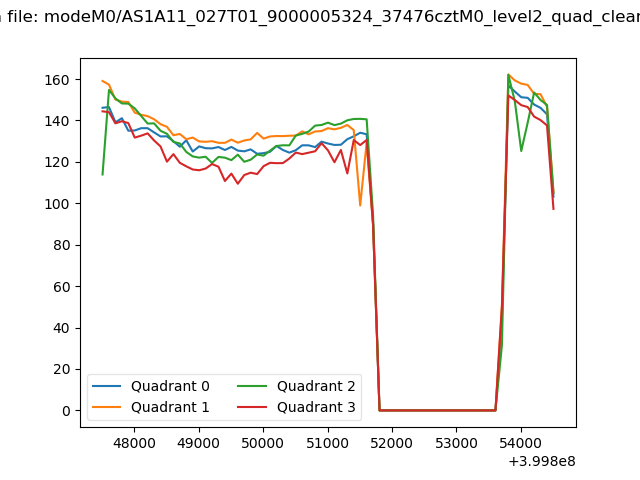 |
|
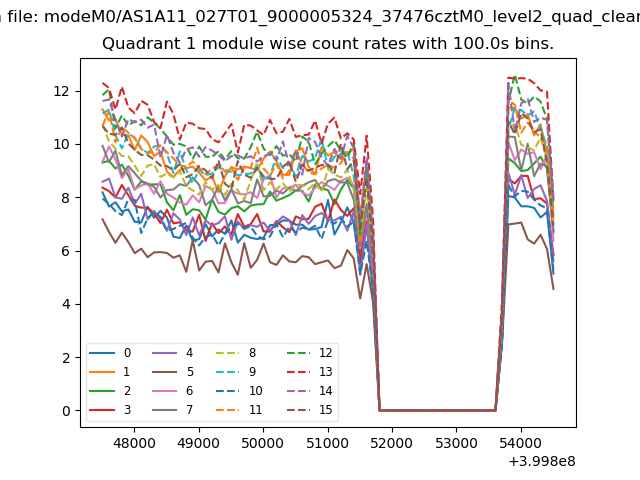
| Module-wise count rates for Quadrant A Data is divided into 100 sec bins |
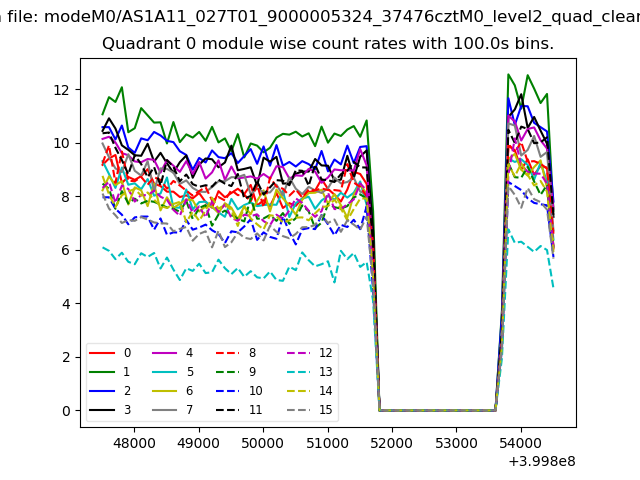 |
 |
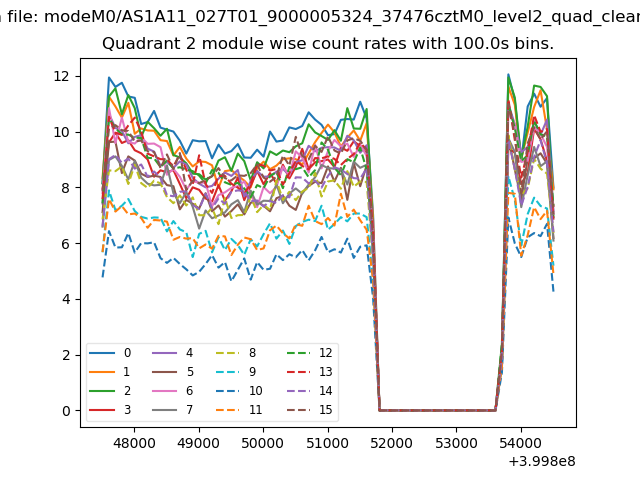
| Module-wise count rates for Quadrant B Data is divided into 100 sec bins |
 |
 |
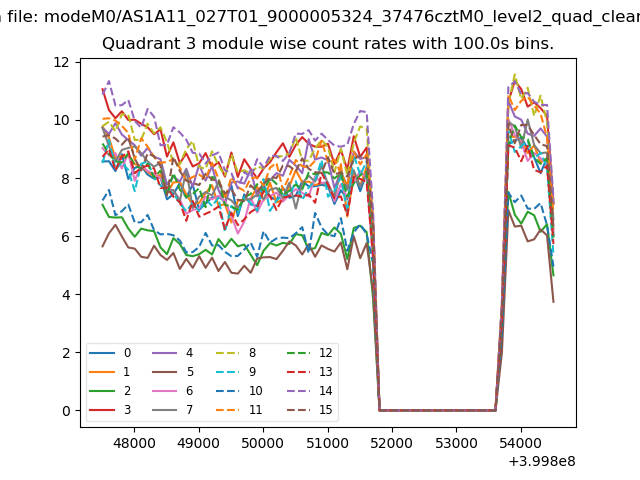
| Module-wise count rates for Quadrant C Data is divided into 100 sec bins |
 |
 |
| Module-wise count rates for Quadrant D Data is divided into 100 sec bins |
 |
 |
| Parameter | Plot |
|---|---|
| CZT HV Monitor |  |
| D_VDD | 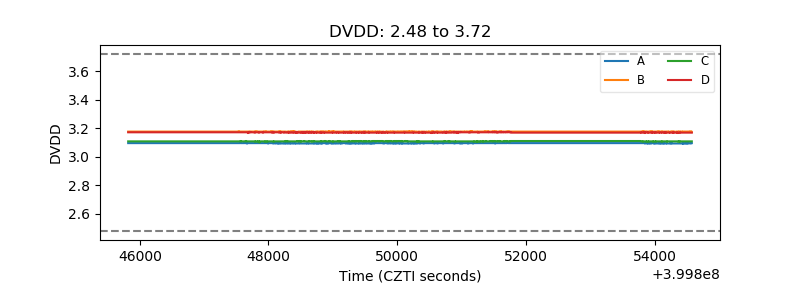 |
| Temperature 1 | 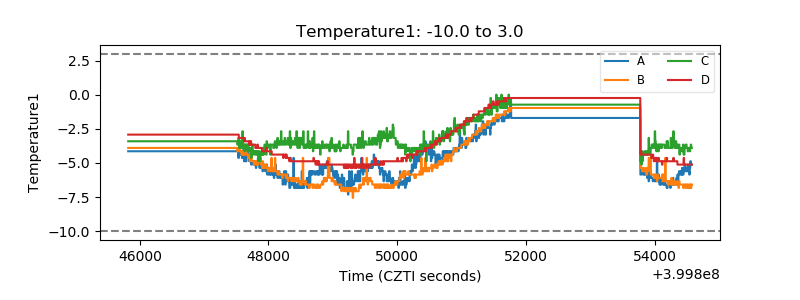 |
| Veto HV Monitor | 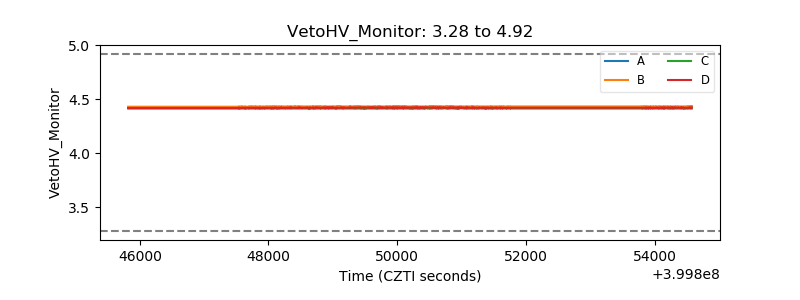 |
| Veto LLD | 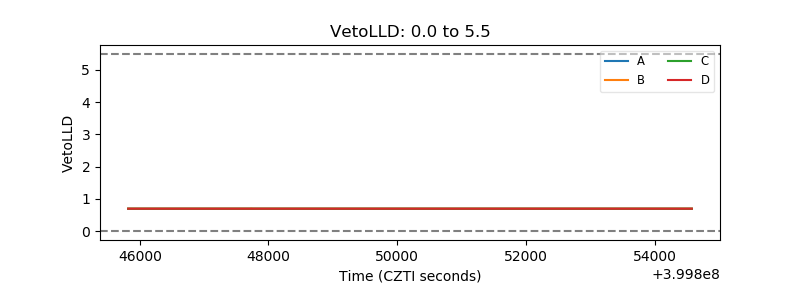 |
| Alpha Counter | 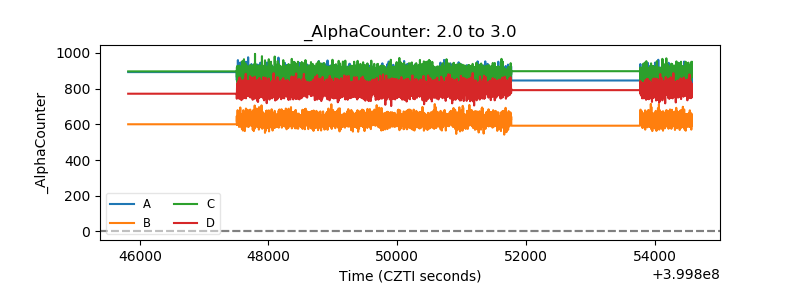 |
| _CPM_Rate | 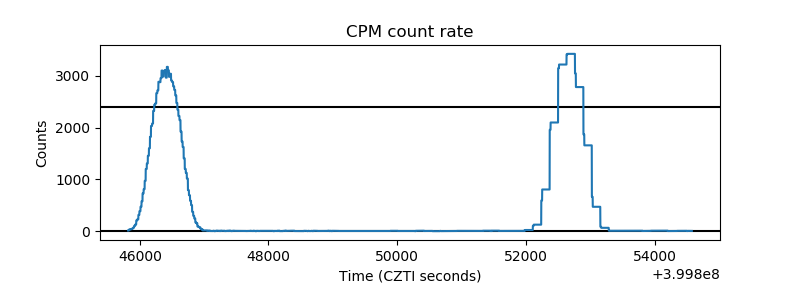 |
| CZT Counter | 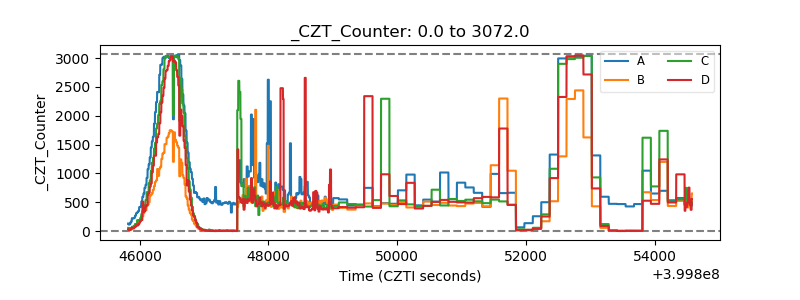 |
| +2.5 Volts monitor | 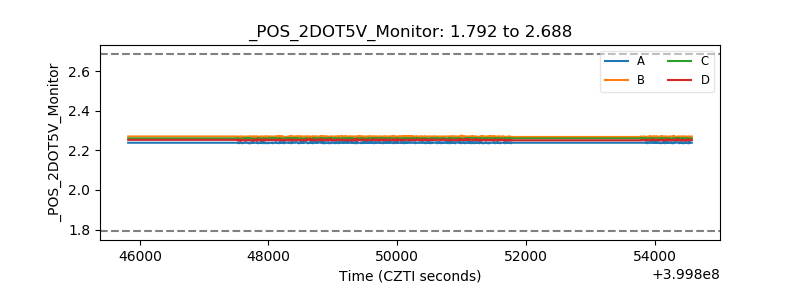 |
| +5 Volts monitor | 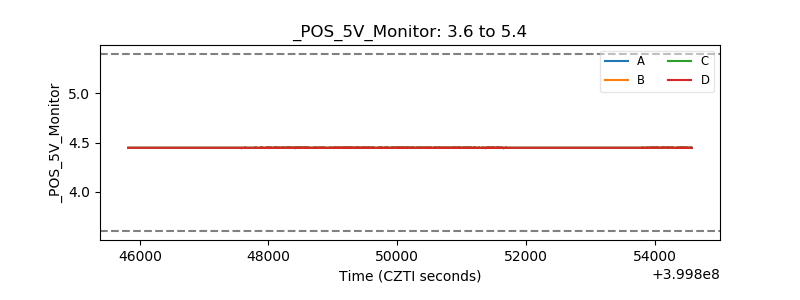 |
| _ROLL_ROT | 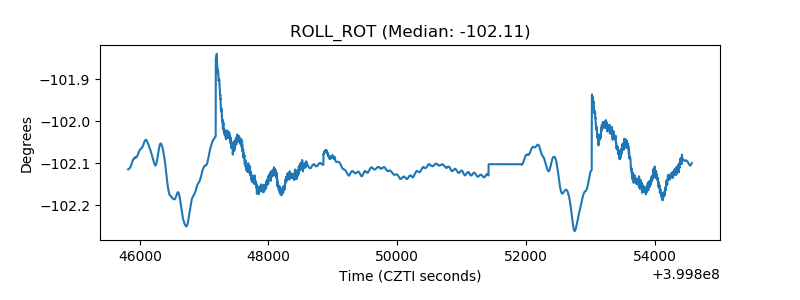 |
| _Roll_DEC | 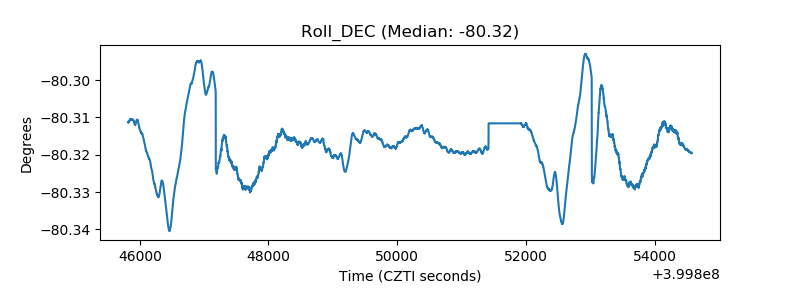 |
| _Roll_RA | 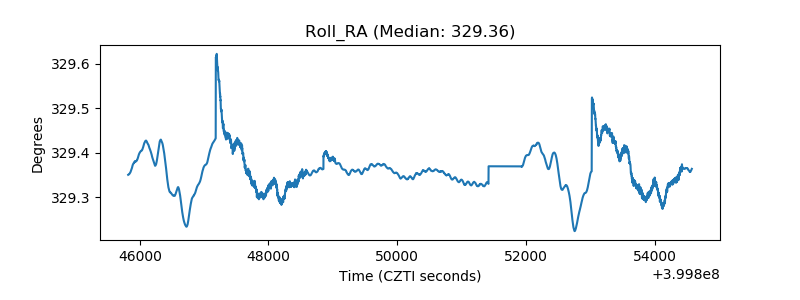 |
| Veto Counter | 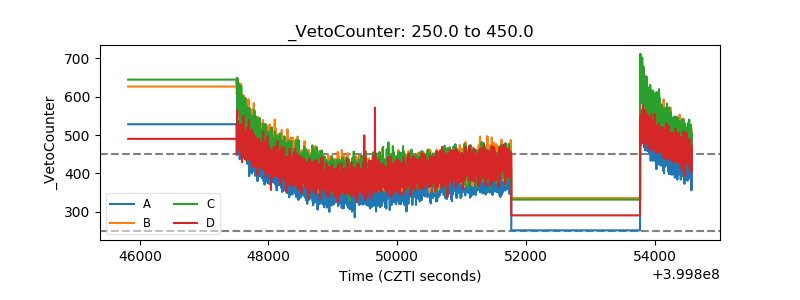 |