| Param | Original file | Final file |
|---|---|---|
| Filename | modeM0/AS1C07_001T11_9000005326cztM0_level2.fits | modeM0/AS1C07_001T11_9000005326cztM0_level2_quad_clean.evt |
| Size (bytes) | 608,423,040 | 943,044,480 |
| Size | 580.2 MB | 899.4 MB |
| Events in quadrant A | 3,593,380 | 6,149,300 |
| Events in quadrant B | 3,524,372 | 6,322,553 |
| Events in quadrant C | 3,625,454 | 6,135,419 |
| Events in quadrant D | 3,032,372 | 5,312,376 |
| Mode M0 | |||
|---|---|---|---|
| Quadrant | BADHDUFLAG | Total packets | Discarded packets |
| A | 0 | 180752 | 0 |
| B | 0 | 167697 | 0 |
| C | 0 | 154431 | 0 |
| D | 0 | 208538 | 0 |
| Mode M9 | |||
|---|---|---|---|
| Quadrant | BADHDUFLAG | Total packets | Discarded packets |
| A | 0 | 263 | 0 |
| B | 0 | 263 | 0 |
| C | 0 | 263 | 0 |
| D | 0 | 263 | 0 |
| Mode SS | |||
|---|---|---|---|
| Quadrant | BADHDUFLAG | Total packets | Discarded packets |
| A | 0 | 1388 | 0 |
| B | 0 | 1388 | 0 |
| C | 0 | 1388 | 0 |
| D | 0 | 1388 | 0 |
| Quadrant | Total seconds | Saturated seconds | Saturation percentage |
|---|---|---|---|
| A | 67719 | 3467 | 5.119686% |
| B | 67718 | 2683 | 3.962019% |
| C | 67719 | 1540 | 2.274103% |
| D | 67717 | 6490 | 9.584004% |
Noise dominated data is calculated using 1-second bins in cleaned event files. If a bin has >2000 counts, and if more than 50% of those come from <1% of pixels, then it is considered to be noise-dominated and hence unusable.
| Quadrant | # 1 sec bins | Bins with >0 counts | Bins with >2000 counts | High rate bins dominated by noise | Noise dominated (total time) | Noise dominated (detector-on time) | Marked lightcurve |
|---|---|---|---|---|---|---|---|
| A | 94157 | 67524 | 0 | 0 | 0.00% | 0.00% |  |
| B | 94157 | 67675 | 0 | 0 | 0.00% | 0.00% |  |
| C | 94157 | 67570 | 0 | 0 | 0.00% | 0.00% |  |
| D | 94157 | 67503 | 0 | 0 | 0.00% | 0.00% |  |
Top three noisy pixels from each quadrant. If the there are fewer than three noisy pixels in the level2.evt file, extra rows are filled as -1
| Pixel properties | Quadrant properties | ||||||
|---|---|---|---|---|---|---|---|
| Quadrant | DetID | PixID | Counts | Sigma | Mean | Median | Sigma |
| A | 7 | 110 | 2976 | 8.95 | 939 | 883 | 234.0 |
| A | 9 | 19 | 2951 | 8.84 | 939 | 883 | 234.0 |
| A | 0 | 29 | 2886 | 8.56 | 939 | 883 | 234.0 |
| B | 2 | 9 | 2951 | 11.47 | 935 | 896 | 179.1 |
| B | 3 | 80 | 2747 | 10.33 | 935 | 896 | 179.1 |
| B | 5 | 128 | 2534 | 9.14 | 935 | 896 | 179.1 |
| C | 1 | 81 | 3136 | 9.1 | 959 | 903 | 245.5 |
| C | 1 | 80 | 3023 | 8.64 | 959 | 903 | 245.5 |
| C | 3 | 203 | 2810 | 7.77 | 959 | 903 | 245.5 |
| D | 10 | 113 | 2302 | 6.5 | 866 | 791 | 232.4 |
| D | 7 | 3 | 2279 | 6.4 | 866 | 791 | 232.4 |
| D | 6 | 62 | 2194 | 6.04 | 866 | 791 | 232.4 |
Histogram calculated using DETX and DETY for each event in the final _common_clean file
| Quadrant A |  |
 |
Quadrant B |
|---|---|---|---|
| Quadrant D |  |
 |
Quadrant C |
| Plot type | Count rate plots | Images |
|---|---|---|
| Comparison with Poisson distribution Blue bars denote a histogram of data divided into 1 sec bins. Red curve is a Poisson curve with rate = median count rate of data. |
 |
 |
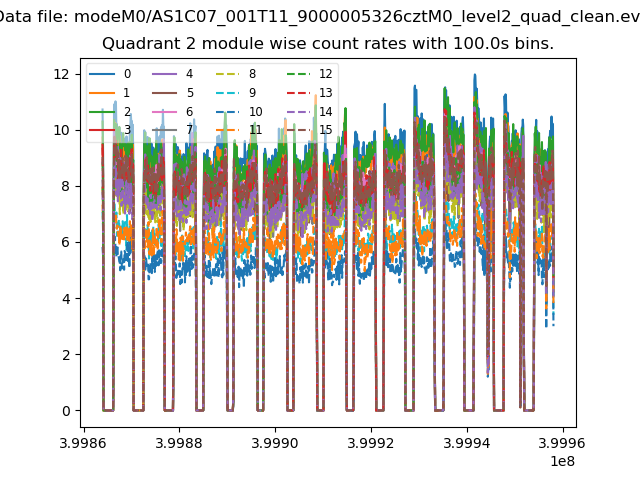
| Quadrant-wise count rates Data is divided into 100 sec bins |
 |
|
| Module-wise count rates for Quadrant A Data is divided into 100 sec bins |
 |
 |
| Module-wise count rates for Quadrant B Data is divided into 100 sec bins |
 |
 |
| Module-wise count rates for Quadrant C Data is divided into 100 sec bins |
 |
 |
| Module-wise count rates for Quadrant D Data is divided into 100 sec bins |
 |
 |
| Parameter | Plot |
|---|---|
| CZT HV Monitor |  |
| D_VDD | 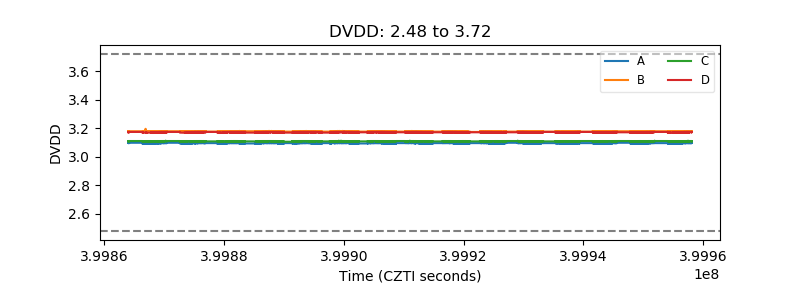 |
| Temperature 1 |  |
| Veto HV Monitor |  |
| Veto LLD | 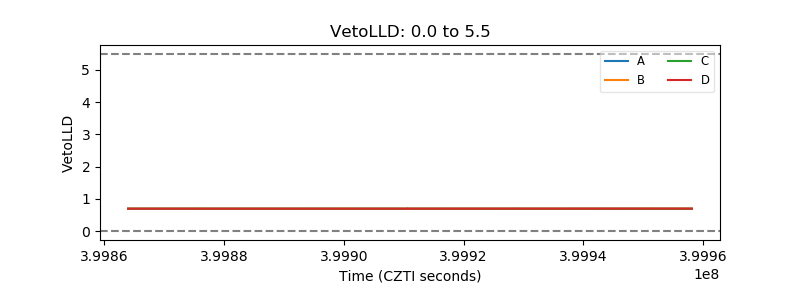 |
| Alpha Counter | 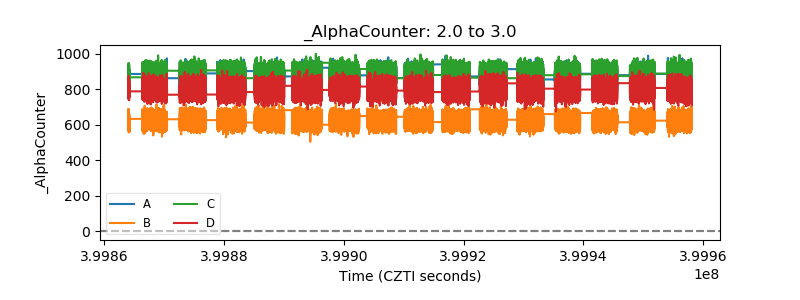 |
| _CPM_Rate |  |
| CZT Counter |  |
| +2.5 Volts monitor |  |
| +5 Volts monitor |  |
| _ROLL_ROT |  |
| _Roll_DEC |  |
| _Roll_RA |  |
| Veto Counter |  |