| Param | Original file | Final file |
|---|---|---|
| Filename | modeM0/AS1C07_001T11_9000005326_37478cztM0_level2.evt | modeM0/AS1C07_001T11_9000005326_37478cztM0_level2_quad_clean.evt |
| Size (bytes) | 100,964,160 | 23,693,760 |
| Size | 96.3 MB | 22.6 MB |
| Events in quadrant A | 686,325 | 158,598 |
| Events in quadrant B | 602,094 | 162,619 |
| Events in quadrant C | 663,169 | 160,835 |
| Events in quadrant D | 1,023,257 | 145,787 |
| Mode M0 | |||
|---|---|---|---|
| Quadrant | BADHDUFLAG | Total packets | Discarded packets |
| A | 0 | 2809 | 2 |
| B | 0 | 2507 | 1 |
| C | 0 | 2650 | 1 |
| D | 0 | 3879 | 1 |
| Mode M9 | |||
|---|---|---|---|
| Quadrant | BADHDUFLAG | Total packets | Discarded packets |
| A | 0 | 21 | 0 |
| B | 0 | 21 | 0 |
| C | 0 | 21 | 0 |
| D | 0 | 21 | 0 |
| Mode SS | |||
|---|---|---|---|
| Quadrant | BADHDUFLAG | Total packets | Discarded packets |
| A | 0 | 26 | 0 |
| B | 0 | 26 | 0 |
| C | 0 | 26 | 0 |
| D | 0 | 26 | 0 |
| Quadrant | Total seconds | Saturated seconds | Saturation percentage |
|---|---|---|---|
| A | 1177 | 2 | 0.169924% |
| B | 1177 | 8 | 0.679694% |
| C | 1177 | 12 | 1.019541% |
| D | 1177 | 118 | 10.025489% |
Noise dominated data is calculated using 1-second bins in cleaned event files. If a bin has >2000 counts, and if more than 50% of those come from <1% of pixels, then it is considered to be noise-dominated and hence unusable.
| Quadrant | # 1 sec bins | Bins with >0 counts | Bins with >2000 counts | High rate bins dominated by noise | Noise dominated (total time) | Noise dominated (detector-on time) | Marked lightcurve |
|---|---|---|---|---|---|---|---|
| A | 3330 | 1178 | 2 | 2 | 0.06% | 0.17% |  |
| B | 3330 | 1178 | 3 | 3 | 0.09% | 0.25% | 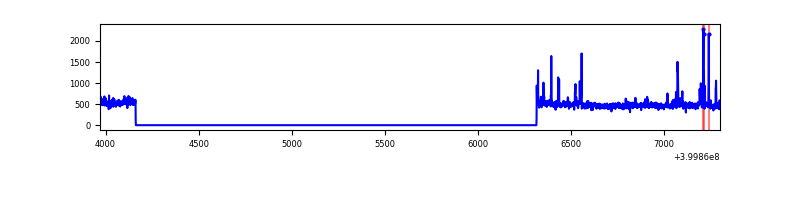 |
| C | 3330 | 1178 | 9 | 9 | 0.27% | 0.76% | 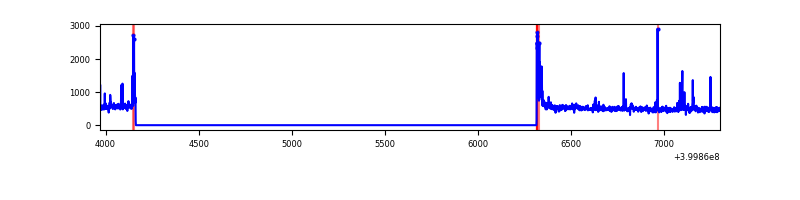 |
| D | 3330 | 1178 | 126 | 126 | 3.78% | 10.70% | 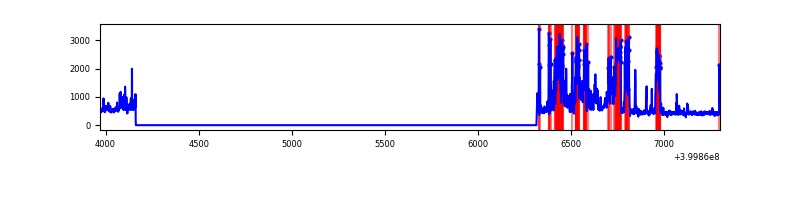 |
Top three noisy pixels from each quadrant. If the there are fewer than three noisy pixels in the level2.evt file, extra rows are filled as -1
| Pixel properties | Quadrant properties | ||||||
|---|---|---|---|---|---|---|---|
| Quadrant | DetID | PixID | Counts | Sigma | Mean | Median | Sigma |
| A | 10 | 83 | 99465 | 3371.16 | 137 | 134 | 29.5 |
| A | 15 | 222 | 46848 | 1585.41 | 137 | 134 | 29.5 |
| A | 15 | 174 | 3670 | 120.01 | 137 | 134 | 29.5 |
| B | 5 | 255 | 27892 | 987.09 | 138 | 135 | 28.1 |
| B | 0 | 190 | 11002 | 386.45 | 138 | 135 | 28.1 |
| B | 4 | 232 | 6287 | 218.78 | 138 | 135 | 28.1 |
| C | 15 | 214 | 53707 | 1618.31 | 136 | 136 | 33.1 |
| C | 14 | 254 | 38179 | 1149.23 | 136 | 136 | 33.1 |
| C | 0 | 10 | 36683 | 1104.04 | 136 | 136 | 33.1 |
| D | 2 | 249 | 182509 | 5631.46 | 128 | 124 | 32.4 |
| D | 13 | 249 | 155515 | 4797.97 | 128 | 124 | 32.4 |
| D | 13 | 171 | 111354 | 3434.42 | 128 | 124 | 32.4 |
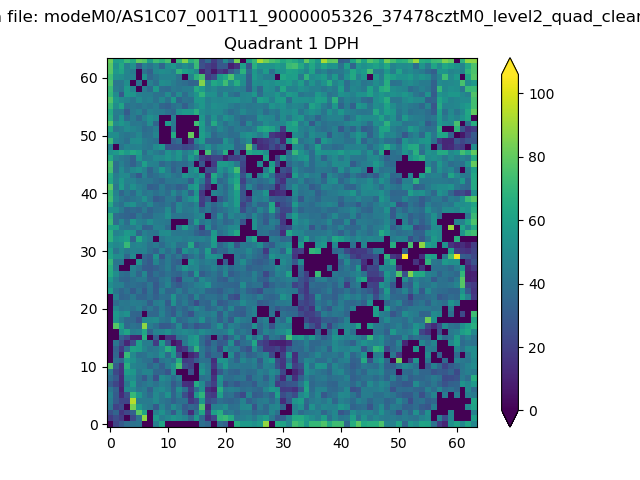
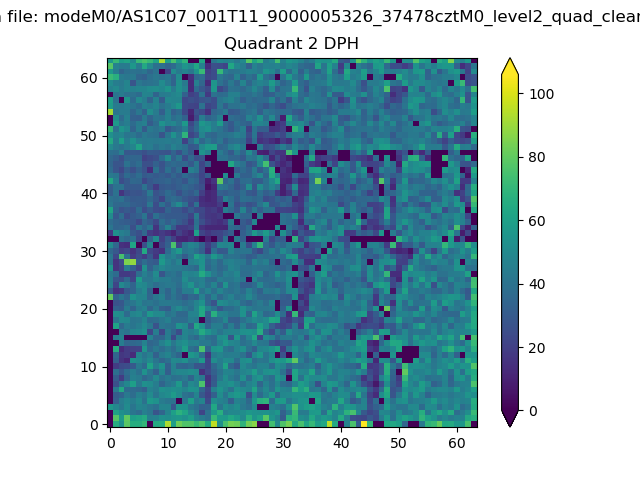
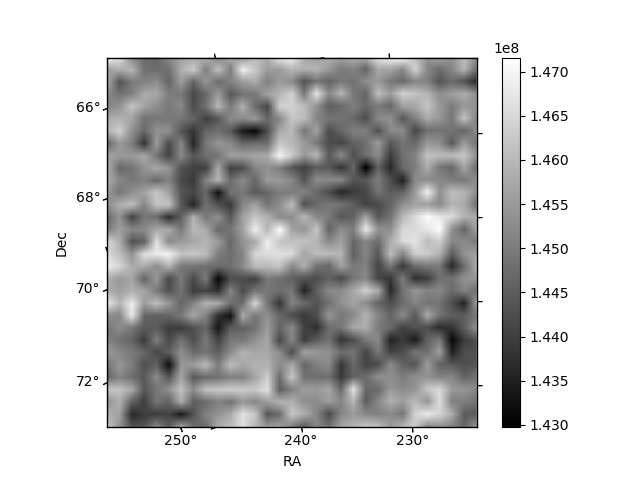
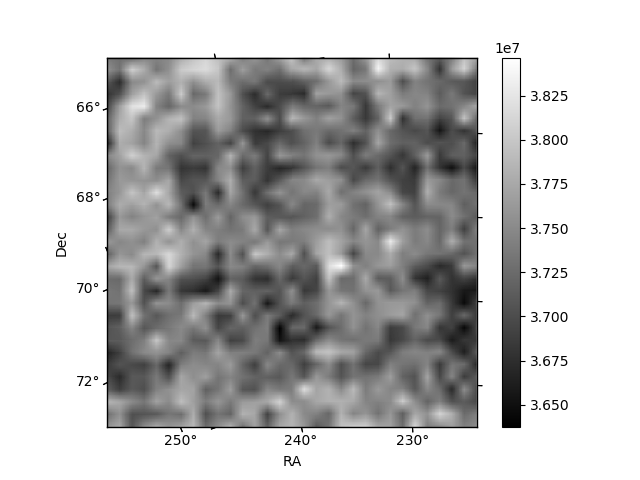
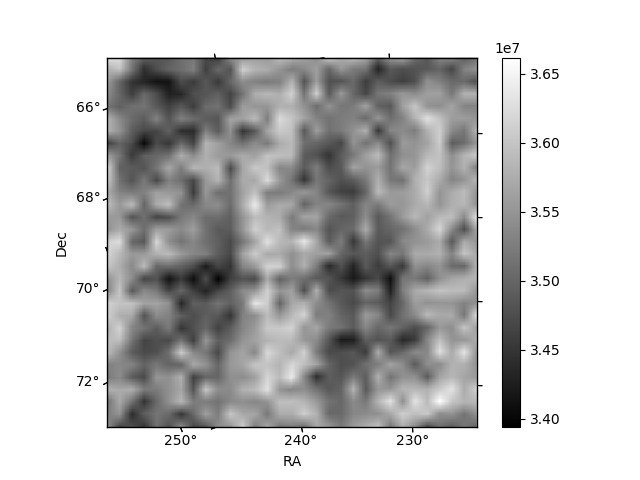
Histogram calculated using DETX and DETY for each event in the final _common_clean file
| Quadrant A | 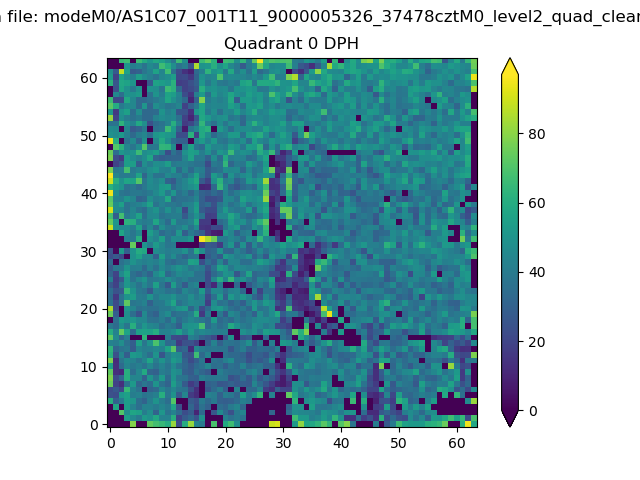 |
 |
Quadrant B |
|---|---|---|---|
| Quadrant D | 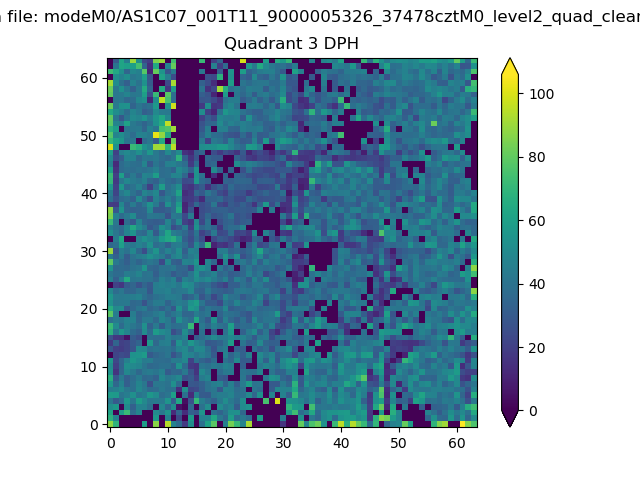 |
 |
Quadrant C |
| Plot type | Count rate plots | Images |
|---|---|---|
| Comparison with Poisson distribution Blue bars denote a histogram of data divided into 1 sec bins. Red curve is a Poisson curve with rate = median count rate of data. |
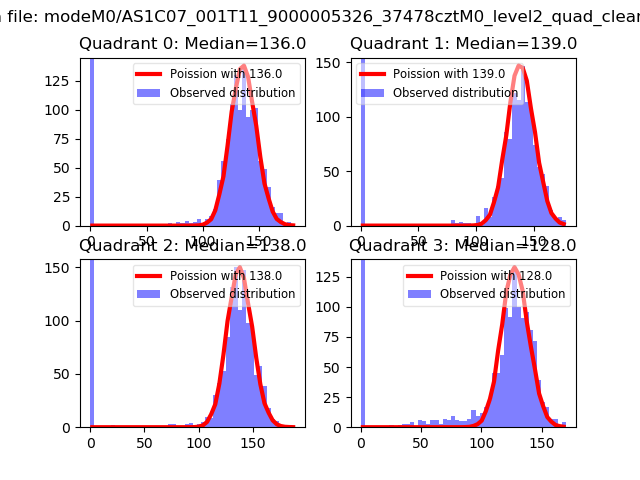 |
 |
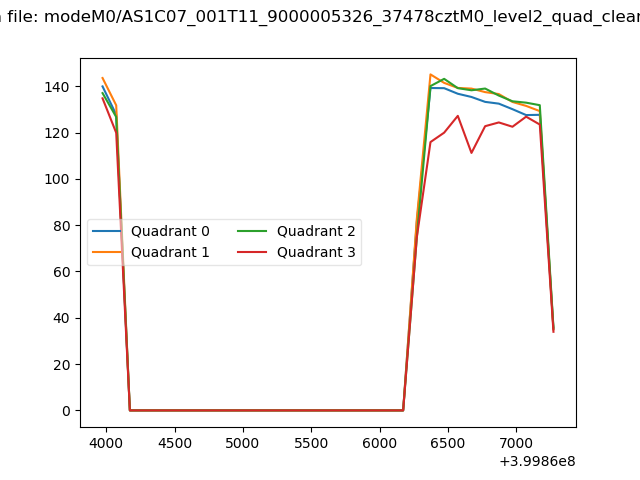
| Quadrant-wise count rates Data is divided into 100 sec bins |
 |
|
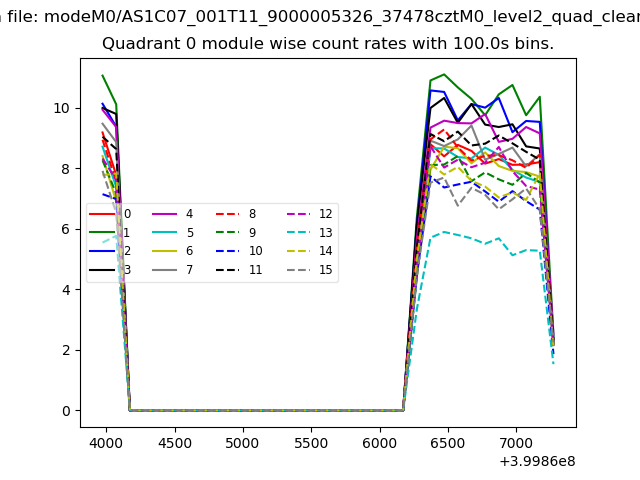
| Module-wise count rates for Quadrant A Data is divided into 100 sec bins |
 |
 |
| Module-wise count rates for Quadrant B Data is divided into 100 sec bins |
 |
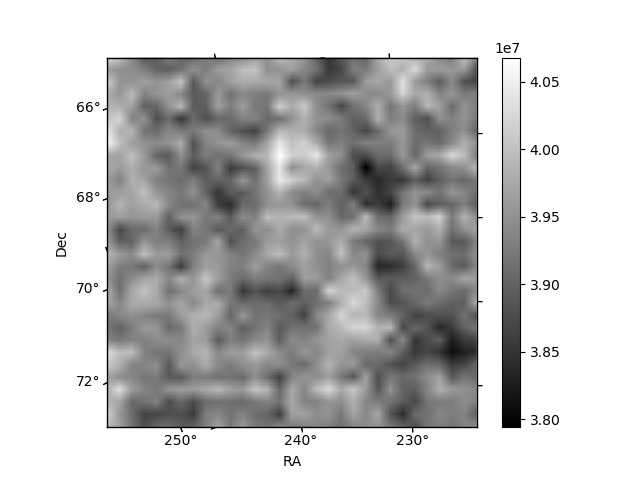 |
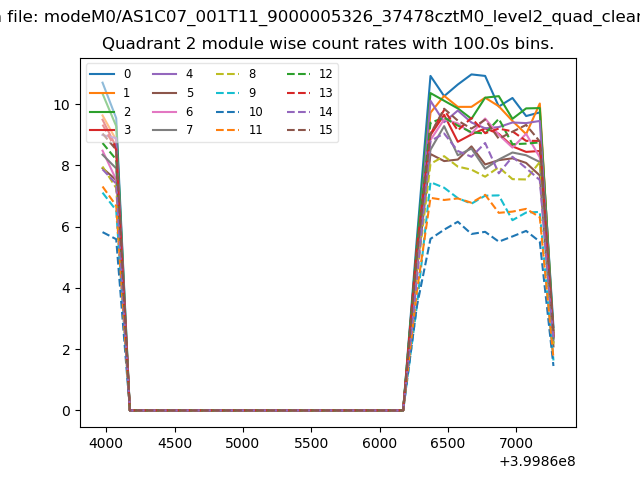
| Module-wise count rates for Quadrant C Data is divided into 100 sec bins |
 |
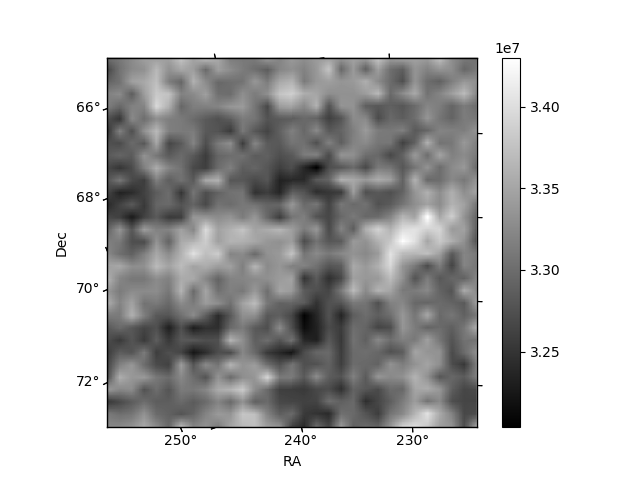 |
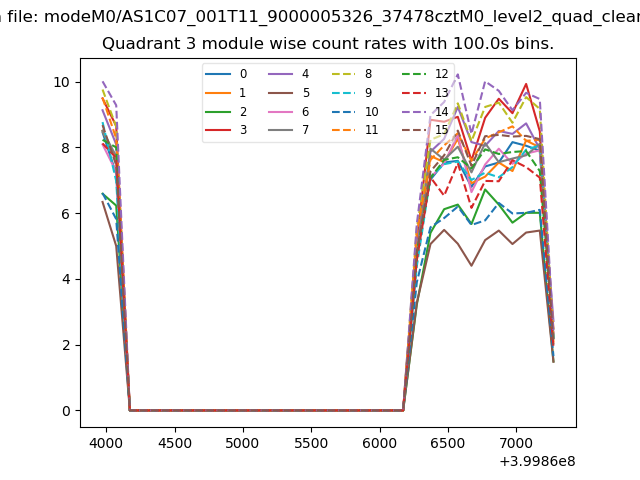
| Module-wise count rates for Quadrant D Data is divided into 100 sec bins |
 |
 |
| Parameter | Plot |
|---|---|
| CZT HV Monitor | 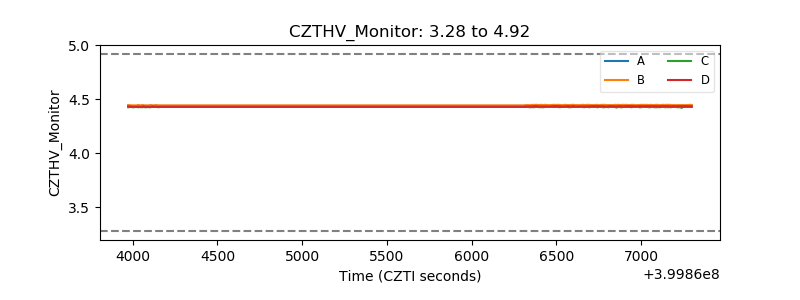 |
| D_VDD | 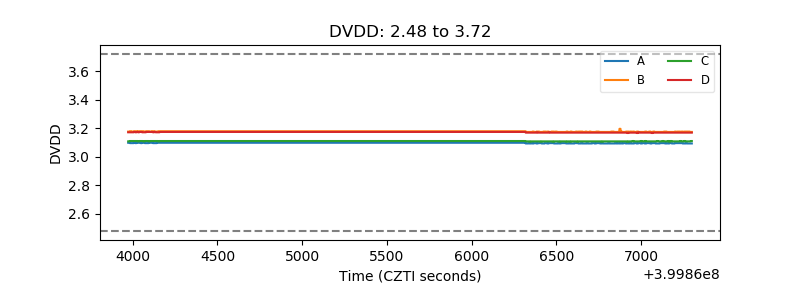 |
| Temperature 1 | 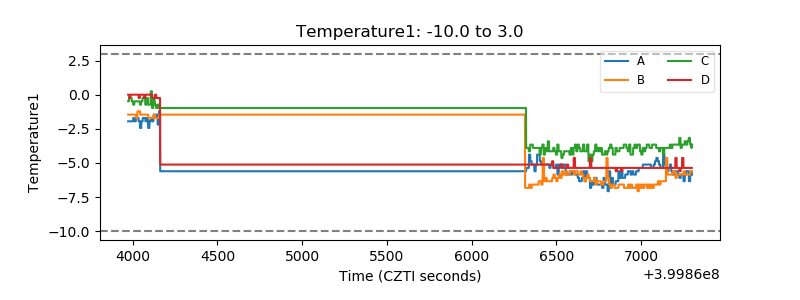 |
| Veto HV Monitor | 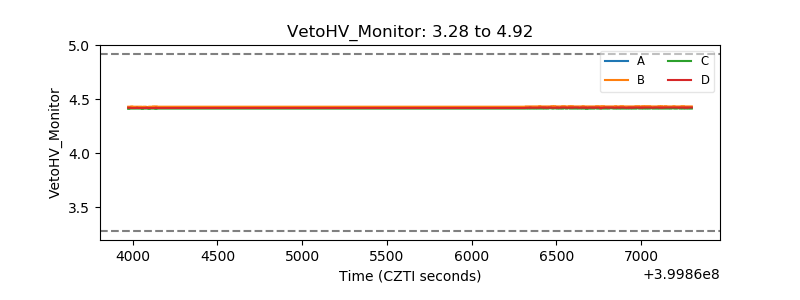 |
| Veto LLD | 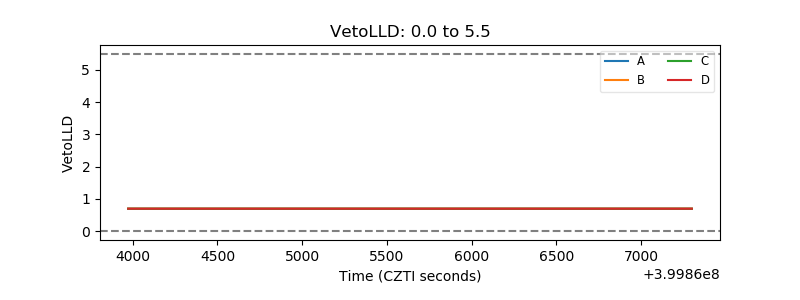 |
| Alpha Counter | 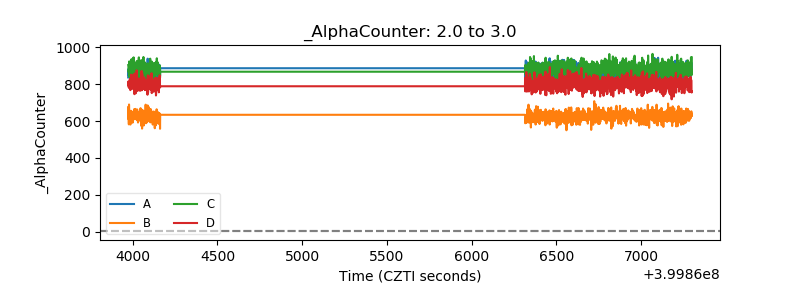 |
| _CPM_Rate | 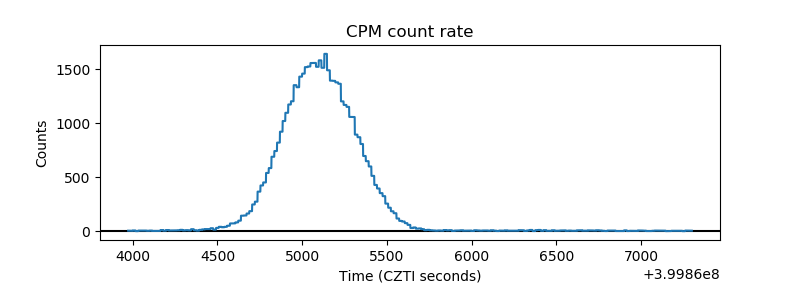 |
| CZT Counter | 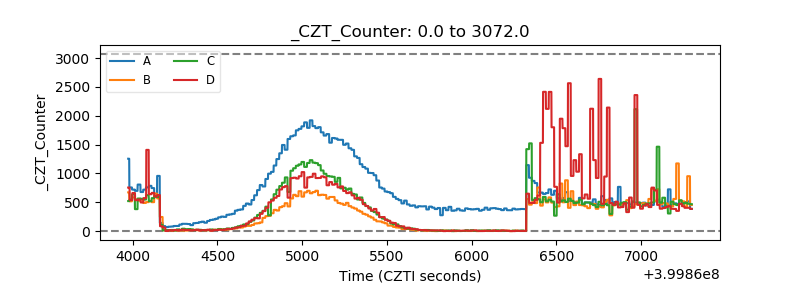 |
| +2.5 Volts monitor | 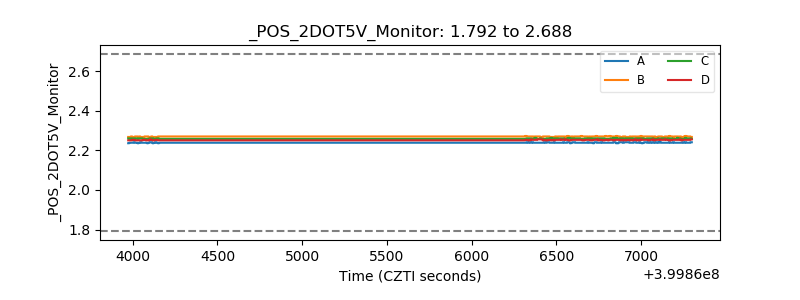 |
| +5 Volts monitor | 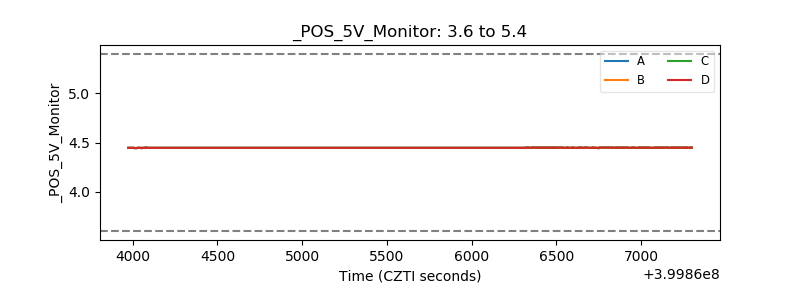 |
| _ROLL_ROT | 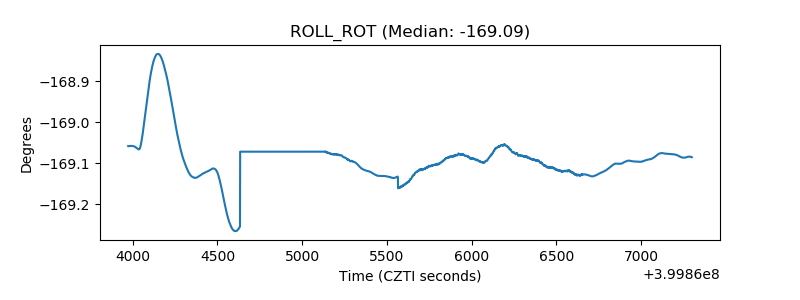 |
| _Roll_DEC | 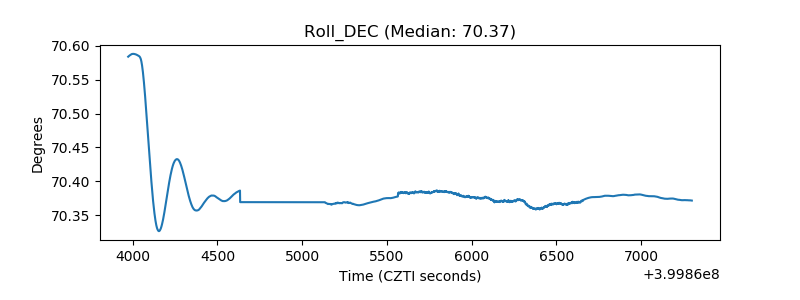 |
| _Roll_RA | 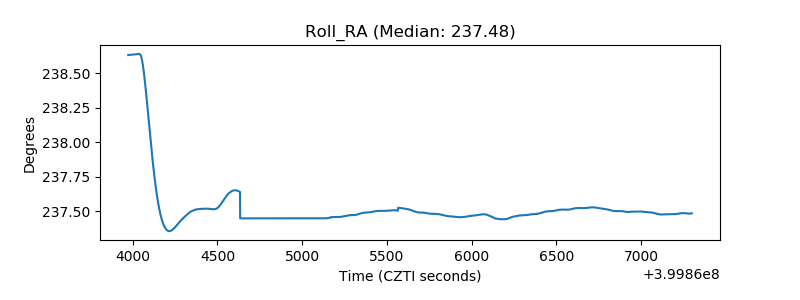 |
| Veto Counter | 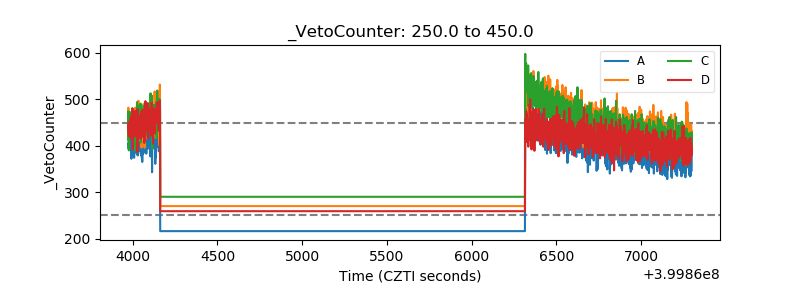 |