| Param | Original file | Final file |
|---|---|---|
| Filename | modeM0/AS1C07_001T11_9000005326_37481cztM0_level2.evt | modeM0/AS1C07_001T11_9000005326_37481cztM0_level2_quad_clean.evt |
| Size (bytes) | 472,043,520 | 99,483,840 |
| Size | 450.2 MB | 94.9 MB |
| Events in quadrant A | 3,018,840 | 671,705 |
| Events in quadrant B | 3,548,137 | 667,765 |
| Events in quadrant C | 2,763,320 | 673,755 |
| Events in quadrant D | 4,588,736 | 611,132 |
| Mode M0 | |||
|---|---|---|---|
| Quadrant | BADHDUFLAG | Total packets | Discarded packets |
| A | 0 | 12290 | 3 |
| B | 0 | 14216 | 2 |
| C | 0 | 11700 | 2 |
| D | 0 | 17486 | 2 |
| Mode M9 | |||
|---|---|---|---|
| Quadrant | BADHDUFLAG | Total packets | Discarded packets |
| A | 0 | 27 | 0 |
| B | 0 | 27 | 0 |
| C | 0 | 27 | 0 |
| D | 0 | 28 | 0 |
| Mode SS | |||
|---|---|---|---|
| Quadrant | BADHDUFLAG | Total packets | Discarded packets |
| A | 0 | 114 | 0 |
| B | 0 | 114 | 0 |
| C | 0 | 114 | 0 |
| D | 0 | 114 | 0 |
| Quadrant | Total seconds | Saturated seconds | Saturation percentage |
|---|---|---|---|
| A | 5545 | 16 | 0.288548% |
| B | 5545 | 298 | 5.374211% |
| C | 5545 | 33 | 0.595131% |
| D | 5545 | 537 | 9.684400% |
Noise dominated data is calculated using 1-second bins in cleaned event files. If a bin has >2000 counts, and if more than 50% of those come from <1% of pixels, then it is considered to be noise-dominated and hence unusable.
| Quadrant | # 1 sec bins | Bins with >0 counts | Bins with >2000 counts | High rate bins dominated by noise | Noise dominated (total time) | Noise dominated (detector-on time) | Marked lightcurve |
|---|---|---|---|---|---|---|---|
| A | 7097 | 5546 | 13 | 13 | 0.18% | 0.23% |  |
| B | 7097 | 5546 | 254 | 254 | 3.58% | 4.58% | 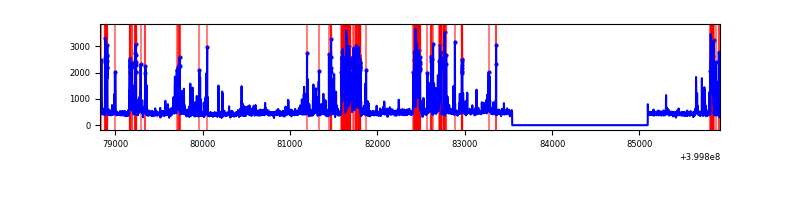 |
| C | 7097 | 5546 | 27 | 27 | 0.38% | 0.49% | 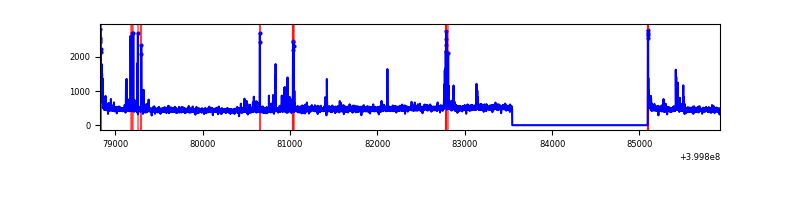 |
| D | 7097 | 5546 | 505 | 505 | 7.12% | 9.11% | 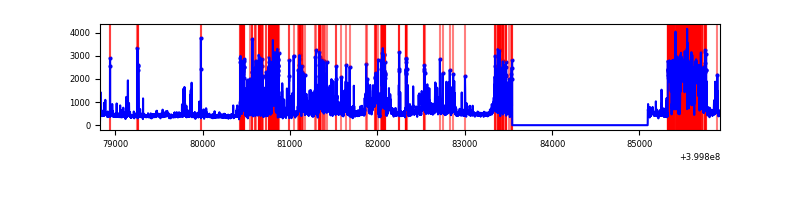 |
Top three noisy pixels from each quadrant. If the there are fewer than three noisy pixels in the level2.evt file, extra rows are filled as -1
| Pixel properties | Quadrant properties | ||||||
|---|---|---|---|---|---|---|---|
| Quadrant | DetID | PixID | Counts | Sigma | Mean | Median | Sigma |
| A | 10 | 83 | 296104 | 2411.28 | 610 | 598 | 122.6 |
| A | 15 | 222 | 167695 | 1363.48 | 610 | 598 | 122.6 |
| A | 13 | 248 | 88009 | 713.26 | 610 | 598 | 122.6 |
| B | 5 | 172 | 755615 | 6553.96 | 596 | 579 | 115.2 |
| B | 5 | 255 | 111410 | 962.05 | 596 | 579 | 115.2 |
| B | 0 | 229 | 110524 | 954.36 | 596 | 579 | 115.2 |
| C | 15 | 214 | 238047 | 1733.56 | 592 | 596 | 137.0 |
| C | 14 | 254 | 146074 | 1062.09 | 592 | 596 | 137.0 |
| C | 0 | 10 | 55487 | 400.74 | 592 | 596 | 137.0 |
| D | 13 | 249 | 1094627 | 7877.36 | 570 | 554 | 138.9 |
| D | 12 | 227 | 512647 | 3687.09 | 570 | 554 | 138.9 |
| D | 2 | 249 | 255429 | 1835.11 | 570 | 554 | 138.9 |
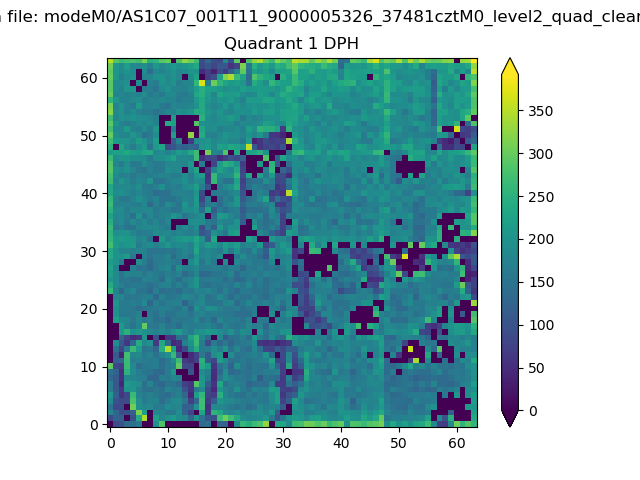
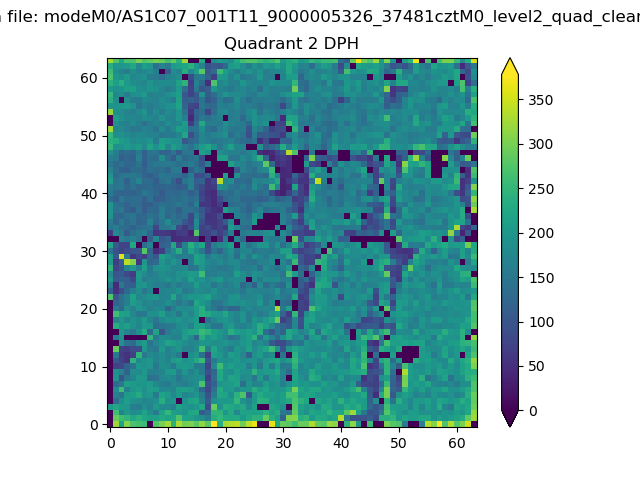
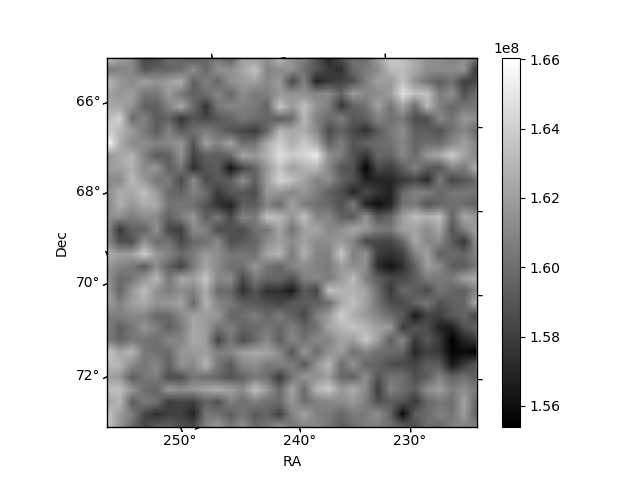
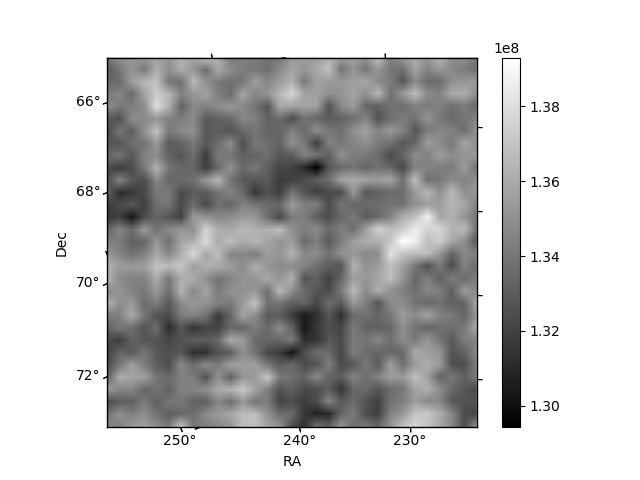
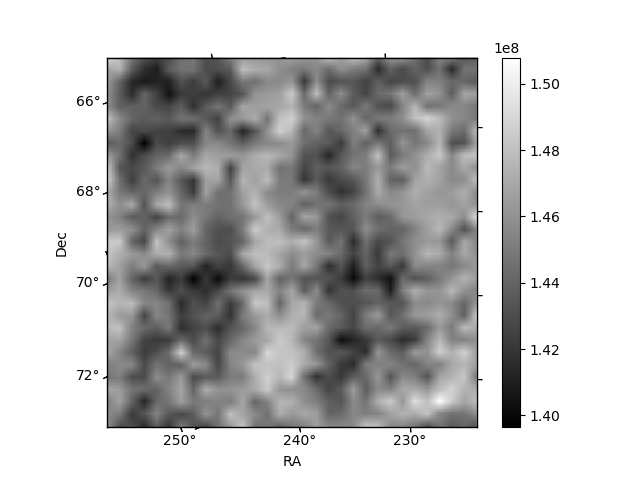
Histogram calculated using DETX and DETY for each event in the final _common_clean file
| Quadrant A |  |
 |
Quadrant B |
|---|---|---|---|
| Quadrant D | 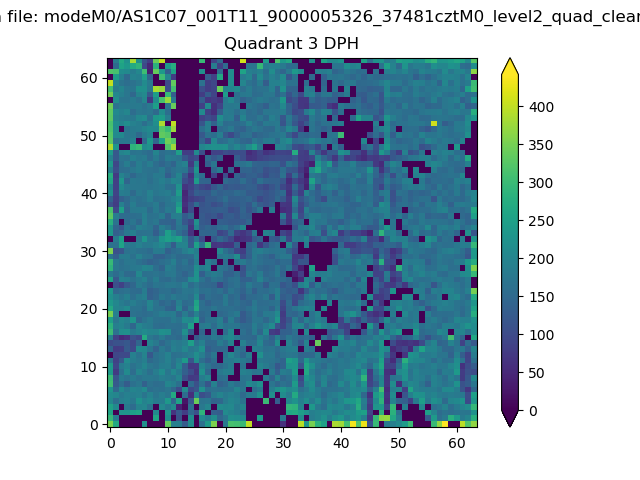 |
 |
Quadrant C |
| Plot type | Count rate plots | Images |
|---|---|---|
| Comparison with Poisson distribution Blue bars denote a histogram of data divided into 1 sec bins. Red curve is a Poisson curve with rate = median count rate of data. |
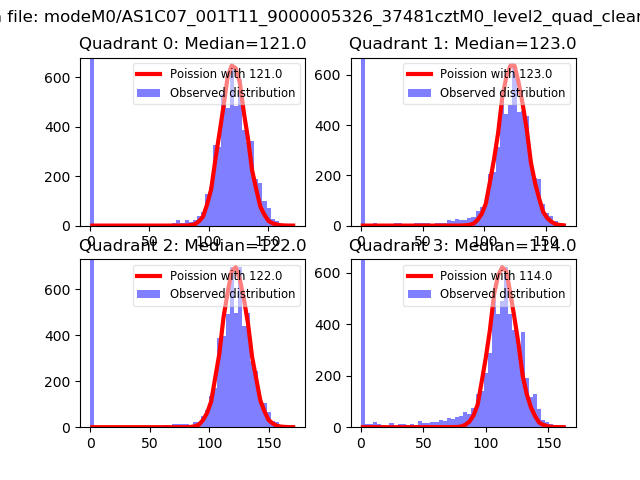 |
 |
| Quadrant-wise count rates Data is divided into 100 sec bins |
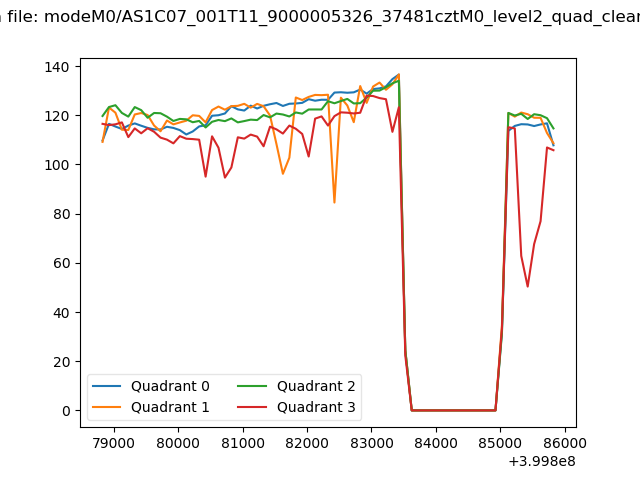 |
|
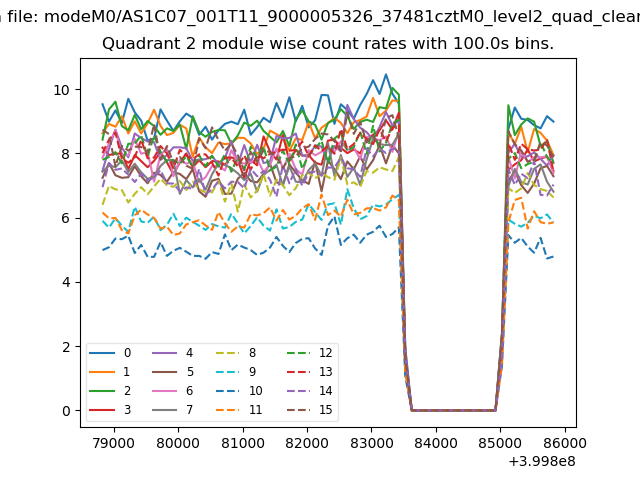
| Module-wise count rates for Quadrant A Data is divided into 100 sec bins |
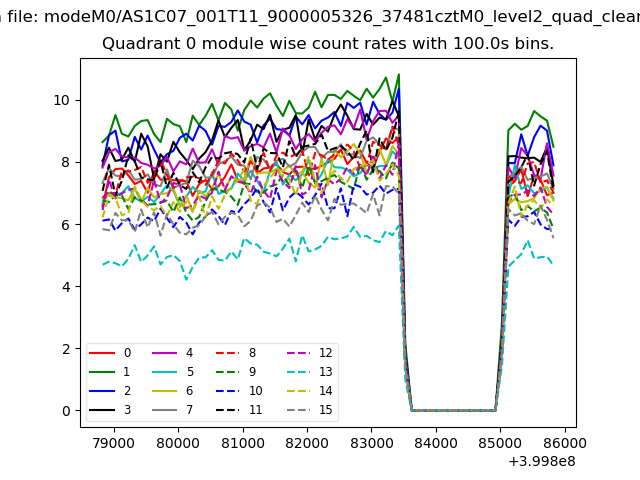 |
 |
| Module-wise count rates for Quadrant B Data is divided into 100 sec bins |
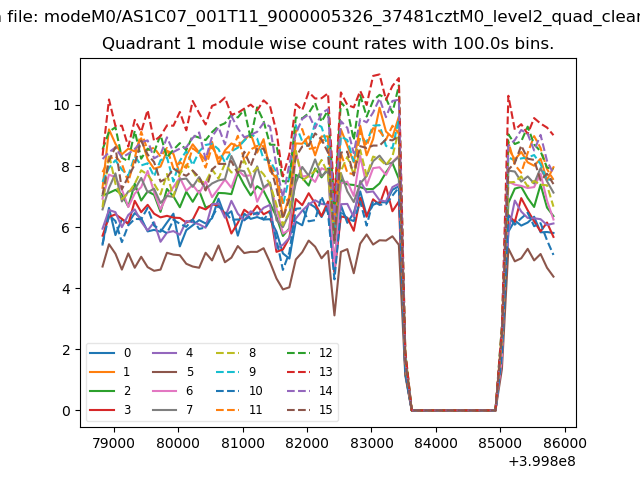 |
 |
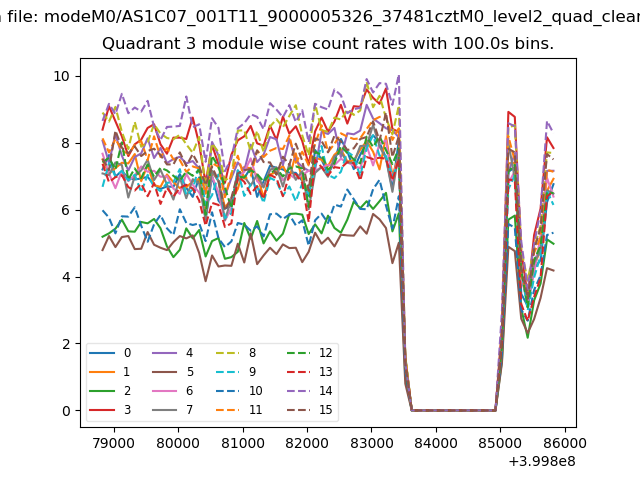
| Module-wise count rates for Quadrant C Data is divided into 100 sec bins |
 |
 |
| Module-wise count rates for Quadrant D Data is divided into 100 sec bins |
 |
 |
| Parameter | Plot |
|---|---|
| CZT HV Monitor | 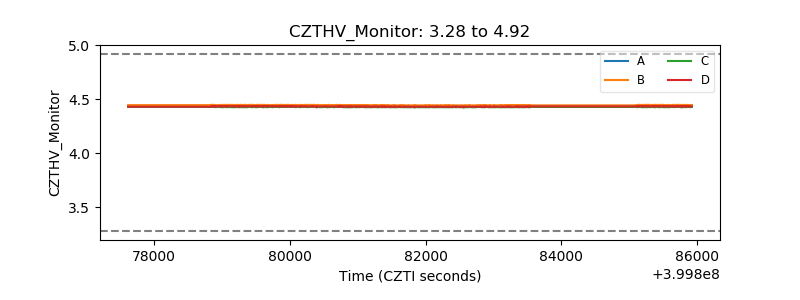 |
| D_VDD | 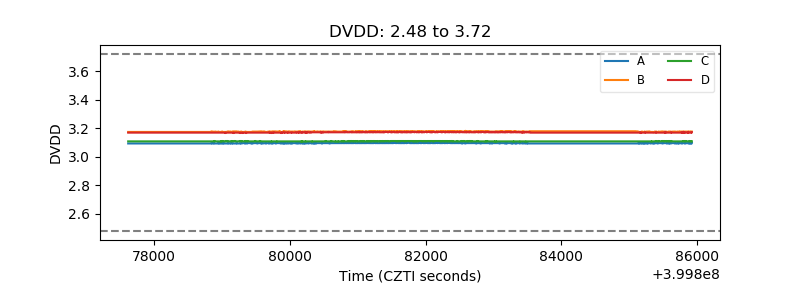 |
| Temperature 1 | 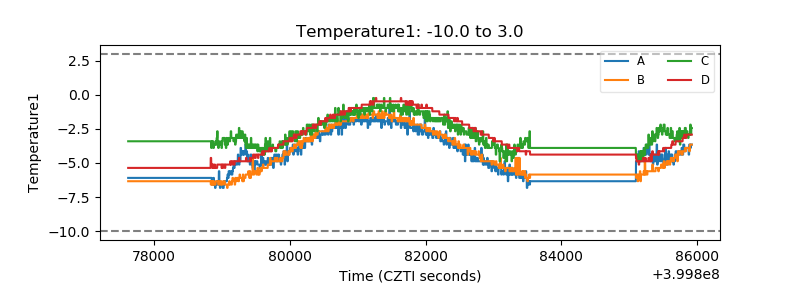 |
| Veto HV Monitor | 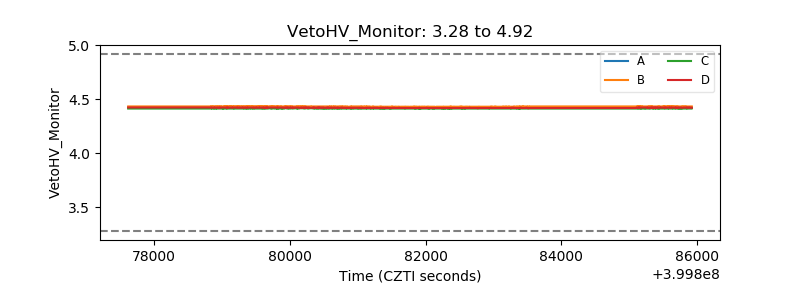 |
| Veto LLD | 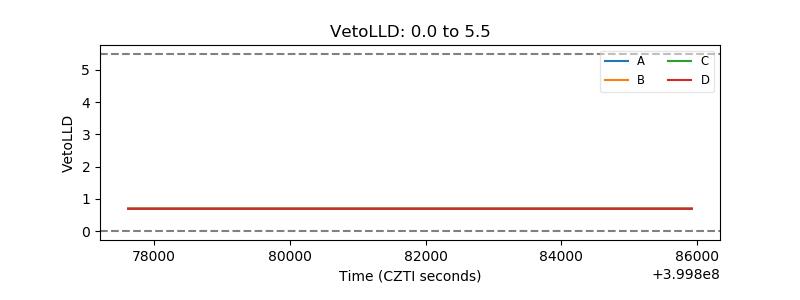 |
| Alpha Counter | 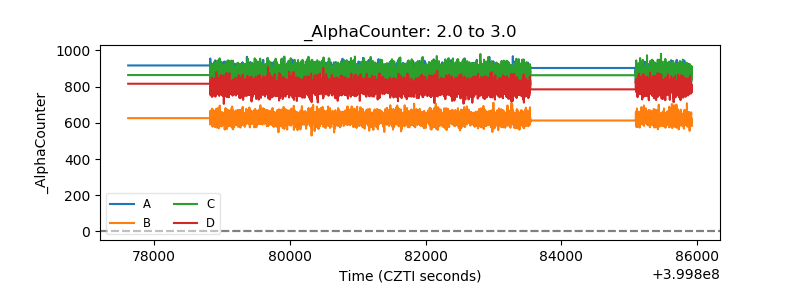 |
| _CPM_Rate | 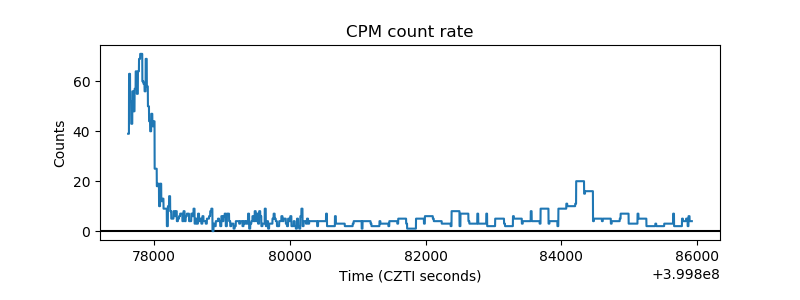 |
| CZT Counter | 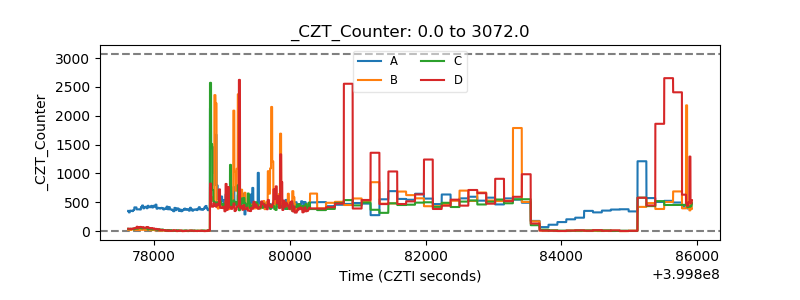 |
| +2.5 Volts monitor | 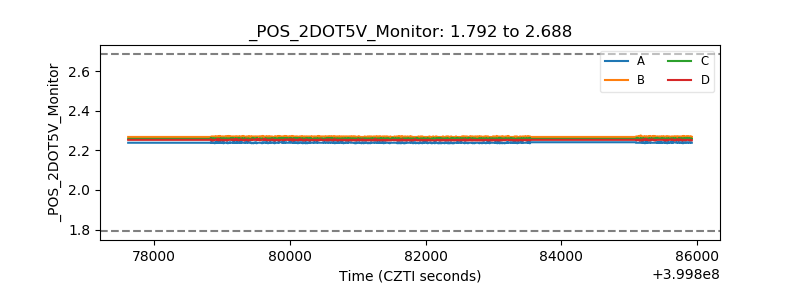 |
| +5 Volts monitor | 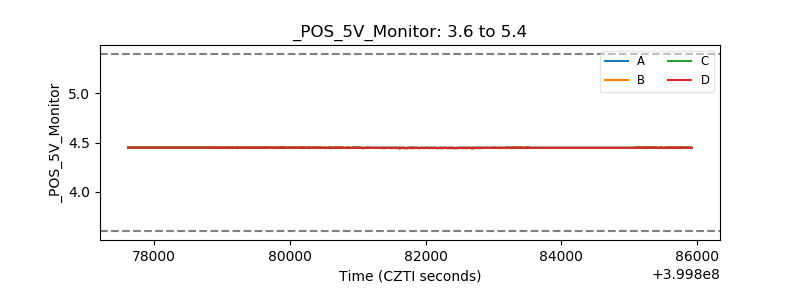 |
| _ROLL_ROT | 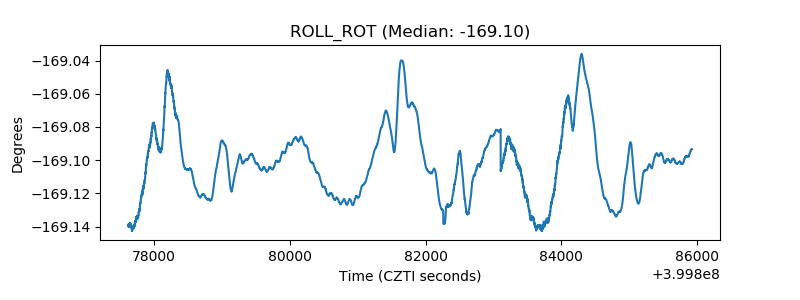 |
| _Roll_DEC | 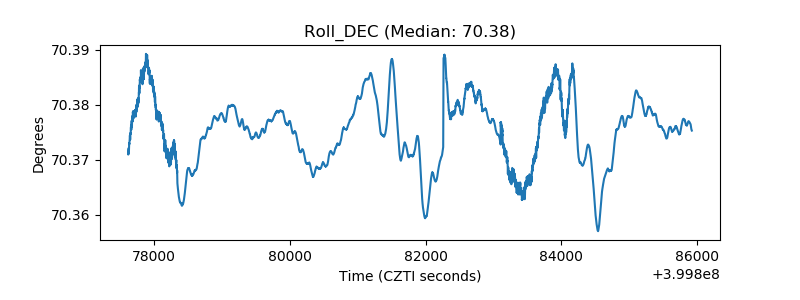 |
| _Roll_RA | 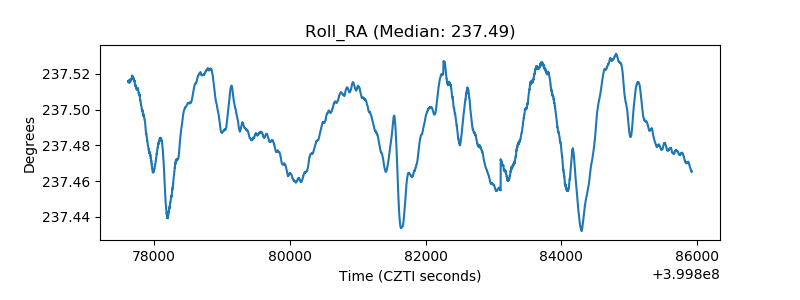 |
| Veto Counter | 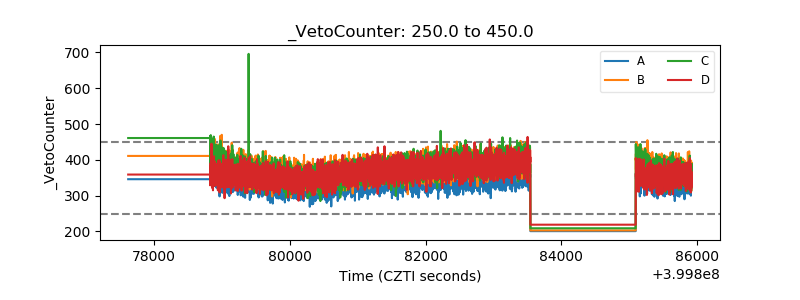 |