| Param | Original file | Final file |
|---|---|---|
| Filename | modeM0/AS1C07_001T11_9000005326_37482cztM0_level2.evt | modeM0/AS1C07_001T11_9000005326_37482cztM0_level2_quad_clean.evt |
| Size (bytes) | 549,437,760 | 103,775,040 |
| Size | 524.0 MB | 99.0 MB |
| Events in quadrant A | 3,003,512 | 714,090 |
| Events in quadrant B | 3,526,337 | 710,836 |
| Events in quadrant C | 3,022,022 | 703,861 |
| Events in quadrant D | 6,689,577 | 603,048 |
| Mode M0 | |||
|---|---|---|---|
| Quadrant | BADHDUFLAG | Total packets | Discarded packets |
| A | 0 | 12460 | 3 |
| B | 0 | 14386 | 2 |
| C | 0 | 12677 | 2 |
| D | 0 | 23947 | 2 |
| Mode M9 | |||
|---|---|---|---|
| Quadrant | BADHDUFLAG | Total packets | Discarded packets |
| A | 0 | 13 | 0 |
| B | 0 | 13 | 0 |
| C | 0 | 13 | 0 |
| D | 0 | 14 | 0 |
| Mode SS | |||
|---|---|---|---|
| Quadrant | BADHDUFLAG | Total packets | Discarded packets |
| A | 0 | 120 | 0 |
| B | 0 | 120 | 0 |
| C | 0 | 120 | 0 |
| D | 0 | 120 | 0 |
| Quadrant | Total seconds | Saturated seconds | Saturation percentage |
|---|---|---|---|
| A | 5872 | 18 | 0.306540% |
| B | 5872 | 223 | 3.797684% |
| C | 5872 | 57 | 0.970708% |
| D | 5872 | 1227 | 20.895777% |
Noise dominated data is calculated using 1-second bins in cleaned event files. If a bin has >2000 counts, and if more than 50% of those come from <1% of pixels, then it is considered to be noise-dominated and hence unusable.
| Quadrant | # 1 sec bins | Bins with >0 counts | Bins with >2000 counts | High rate bins dominated by noise | Noise dominated (total time) | Noise dominated (detector-on time) | Marked lightcurve |
|---|---|---|---|---|---|---|---|
| A | 7215 | 5873 | 11 | 11 | 0.15% | 0.19% |  |
| B | 7215 | 5873 | 188 | 188 | 2.61% | 3.20% |  |
| C | 7215 | 5873 | 45 | 45 | 0.62% | 0.77% |  |
| D | 7215 | 5873 | 1182 | 1182 | 16.38% | 20.13% | 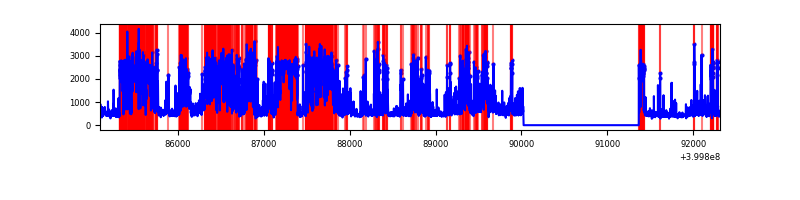 |
Top three noisy pixels from each quadrant. If the there are fewer than three noisy pixels in the level2.evt file, extra rows are filled as -1
| Pixel properties | Quadrant properties | ||||||
|---|---|---|---|---|---|---|---|
| Quadrant | DetID | PixID | Counts | Sigma | Mean | Median | Sigma |
| A | 10 | 83 | 309183 | 2334.28 | 650 | 638 | 132.2 |
| A | 13 | 248 | 46299 | 345.45 | 650 | 638 | 132.2 |
| A | 15 | 222 | 44430 | 331.31 | 650 | 638 | 132.2 |
| B | 5 | 172 | 656381 | 5382.31 | 637 | 620 | 121.8 |
| B | 15 | 35 | 237267 | 1942.34 | 637 | 620 | 121.8 |
| B | 0 | 229 | 46981 | 380.52 | 637 | 620 | 121.8 |
| C | 14 | 254 | 270108 | 1830.08 | 628 | 632 | 147.2 |
| C | 15 | 214 | 251360 | 1702.76 | 628 | 632 | 147.2 |
| C | 0 | 10 | 42127 | 281.8 | 628 | 632 | 147.2 |
| D | 12 | 227 | 1896451 | 13421.88 | 576 | 559 | 141.3 |
| D | 13 | 249 | 1346672 | 9529.74 | 576 | 559 | 141.3 |
| D | 2 | 249 | 559732 | 3958.64 | 576 | 559 | 141.3 |
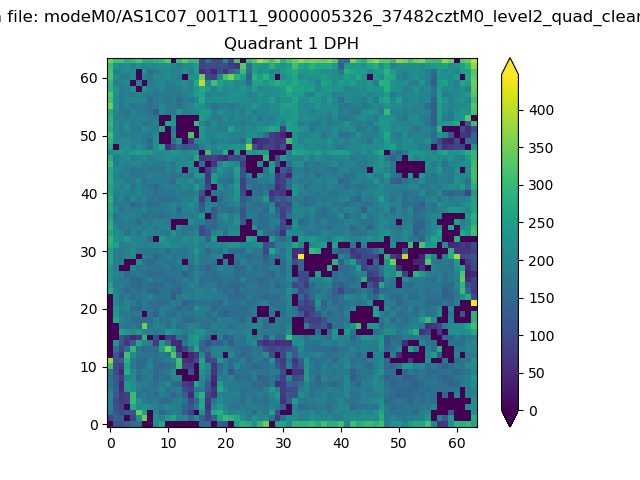
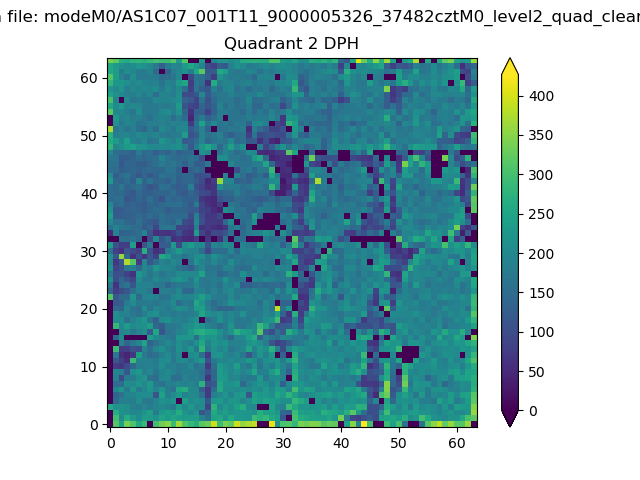
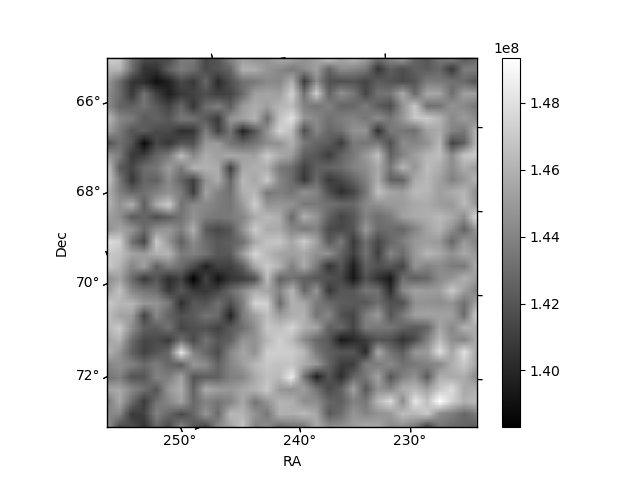
Histogram calculated using DETX and DETY for each event in the final _common_clean file
| Quadrant A | 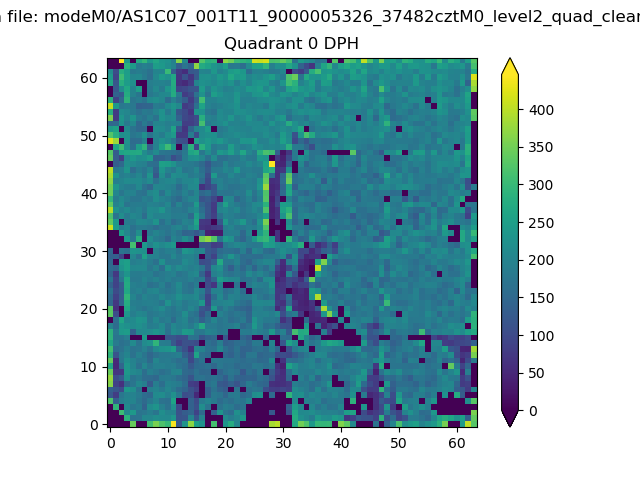 |
 |
Quadrant B |
|---|---|---|---|
| Quadrant D | 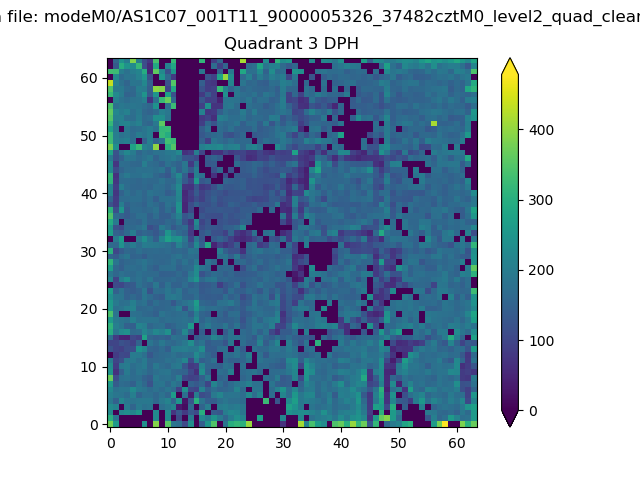 |
 |
Quadrant C |
| Plot type | Count rate plots | Images |
|---|---|---|
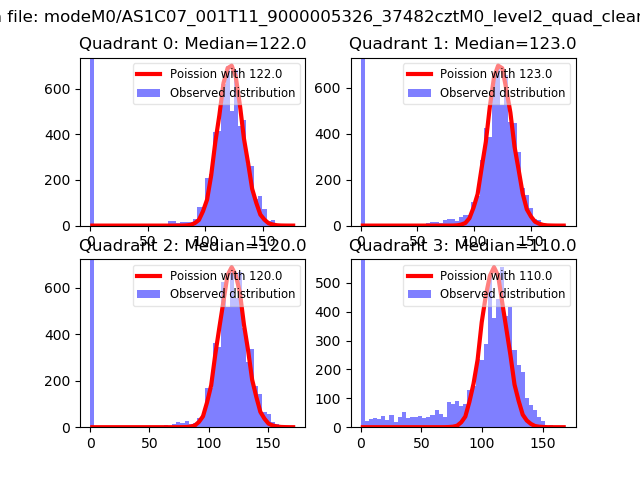
| Comparison with Poisson distribution Blue bars denote a histogram of data divided into 1 sec bins. Red curve is a Poisson curve with rate = median count rate of data. |
 |
 |
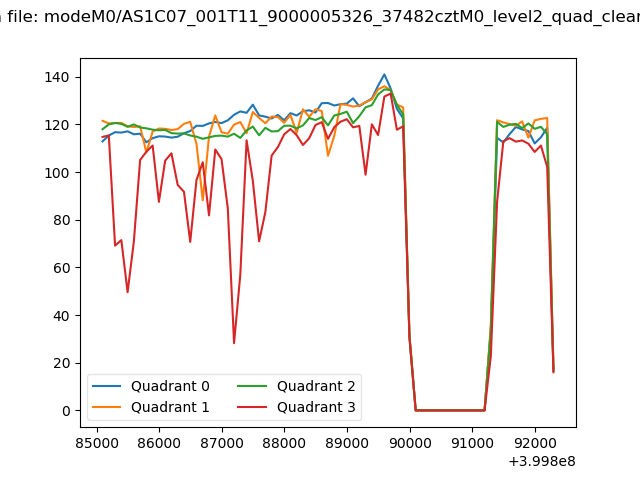
| Quadrant-wise count rates Data is divided into 100 sec bins |
 |
|
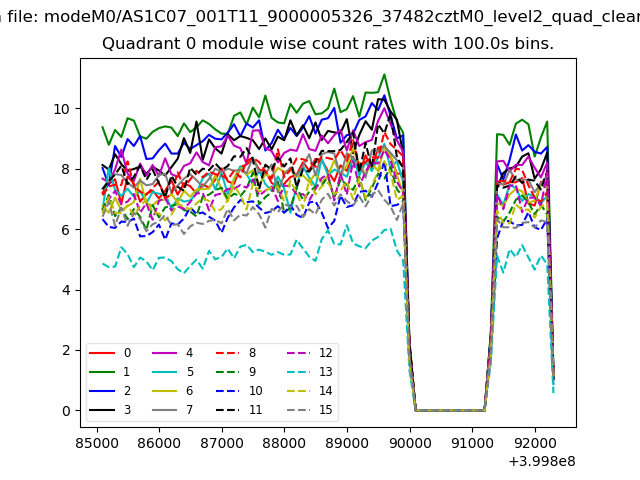
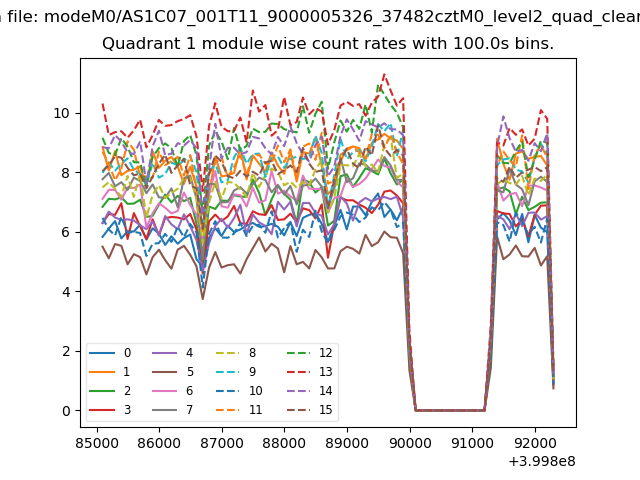
| Module-wise count rates for Quadrant A Data is divided into 100 sec bins |
 |
 |
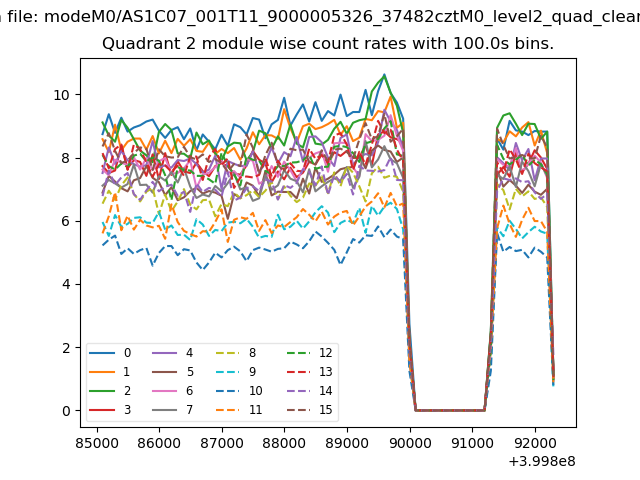
| Module-wise count rates for Quadrant B Data is divided into 100 sec bins |
 |
 |
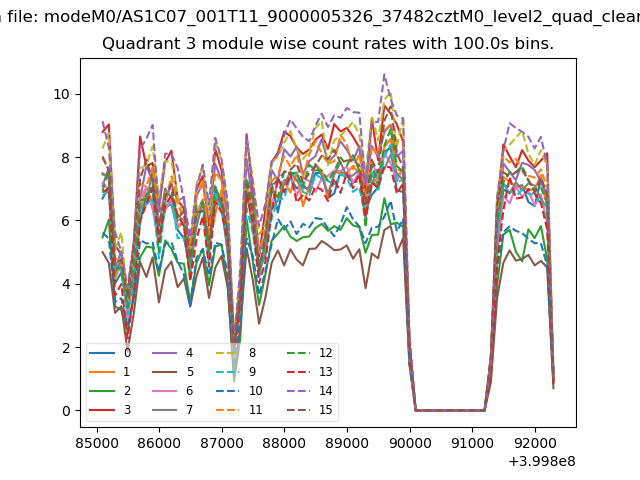
| Module-wise count rates for Quadrant C Data is divided into 100 sec bins |
 |
 |
| Module-wise count rates for Quadrant D Data is divided into 100 sec bins |
 |
 |
| Parameter | Plot |
|---|---|
| CZT HV Monitor | 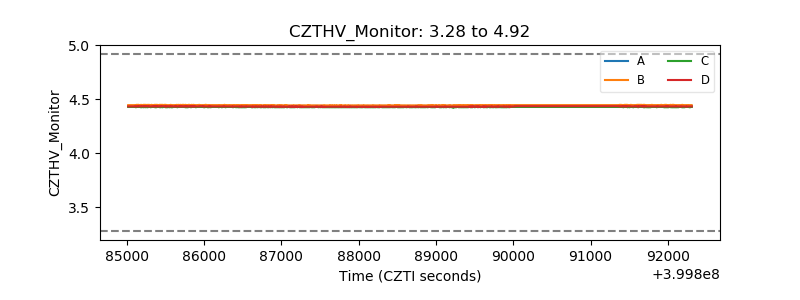 |
| D_VDD | 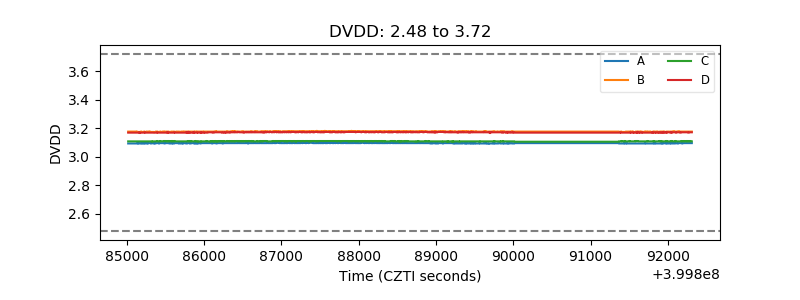 |
| Temperature 1 | 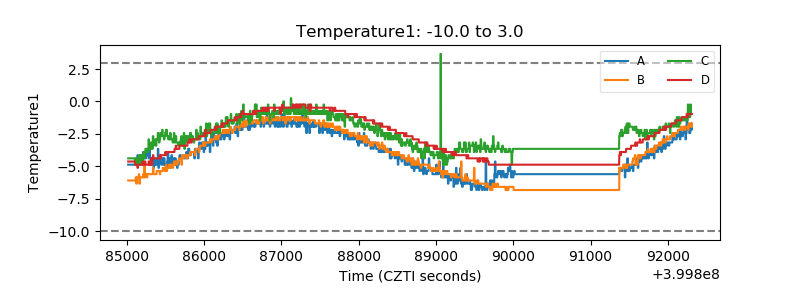 |
| Veto HV Monitor | 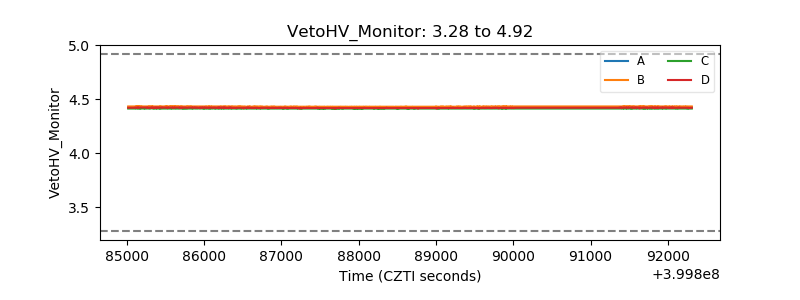 |
| Veto LLD |  |
| Alpha Counter | 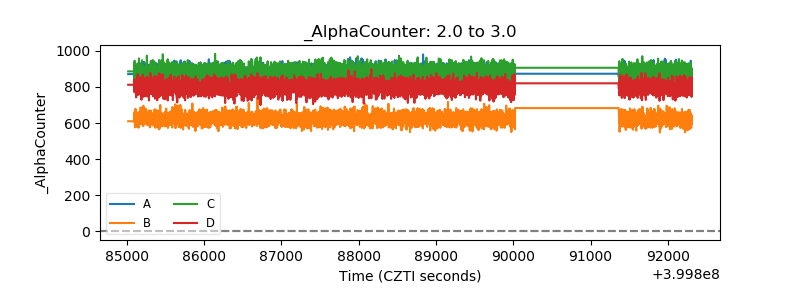 |
| _CPM_Rate | 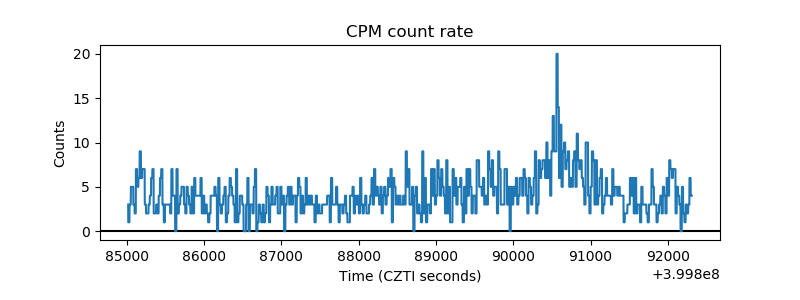 |
| CZT Counter | 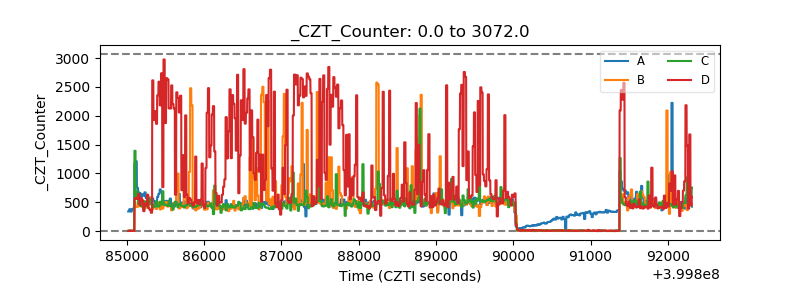 |
| +2.5 Volts monitor | 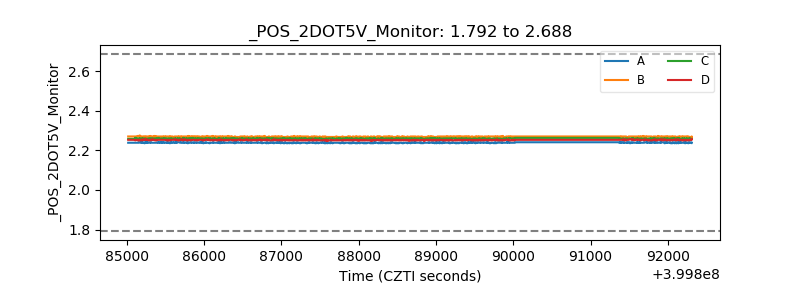 |
| +5 Volts monitor | 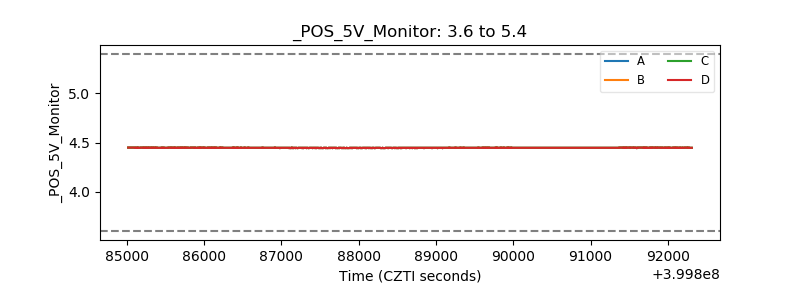 |
| _ROLL_ROT | 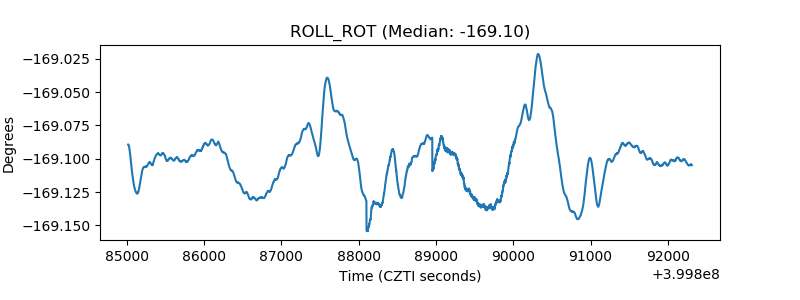 |
| _Roll_DEC | 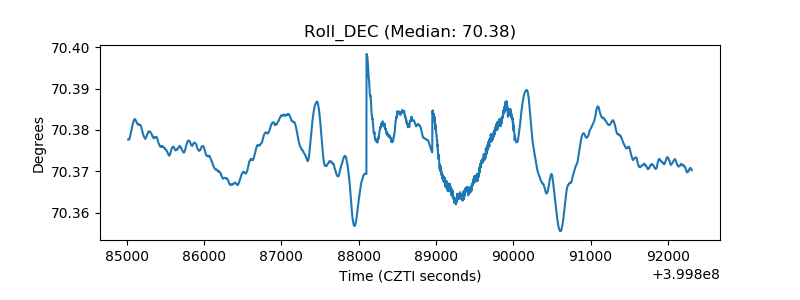 |
| _Roll_RA | 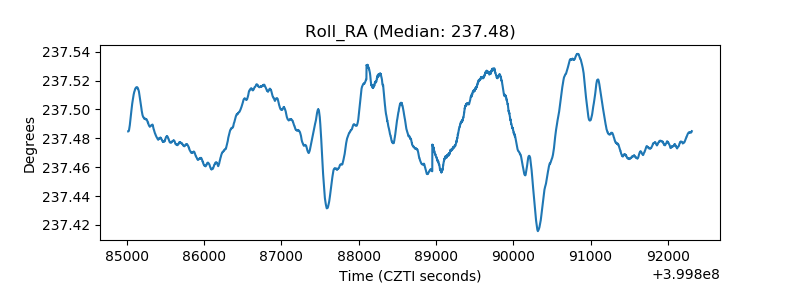 |
| Veto Counter | 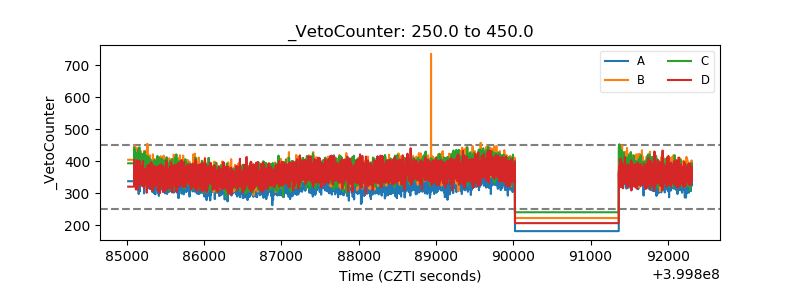 |