| Param | Original file | Final file |
|---|---|---|
| Filename | modeM0/AS1C07_001T11_9000005326_37483cztM0_level2.evt | modeM0/AS1C07_001T11_9000005326_37483cztM0_level2_quad_clean.evt |
| Size (bytes) | 494,887,680 | 102,977,280 |
| Size | 472.0 MB | 98.2 MB |
| Events in quadrant A | 3,946,761 | 674,288 |
| Events in quadrant B | 3,476,073 | 698,433 |
| Events in quadrant C | 2,904,759 | 698,085 |
| Events in quadrant D | 4,263,995 | 639,927 |
| Mode M0 | |||
|---|---|---|---|
| Quadrant | BADHDUFLAG | Total packets | Discarded packets |
| A | 0 | 15285 | 2 |
| B | 0 | 14156 | 1 |
| C | 0 | 12264 | 1 |
| D | 0 | 16674 | 1 |
| Mode M9 | |||
|---|---|---|---|
| Quadrant | BADHDUFLAG | Total packets | Discarded packets |
| A | 0 | 13 | 0 |
| B | 0 | 13 | 0 |
| C | 0 | 13 | 0 |
| D | 0 | 13 | 0 |
| Mode SS | |||
|---|---|---|---|
| Quadrant | BADHDUFLAG | Total packets | Discarded packets |
| A | 0 | 118 | 0 |
| B | 0 | 118 | 0 |
| C | 0 | 118 | 0 |
| D | 0 | 118 | 0 |
| Quadrant | Total seconds | Saturated seconds | Saturation percentage |
|---|---|---|---|
| A | 5836 | 428 | 7.333790% |
| B | 5836 | 247 | 4.232351% |
| C | 5836 | 18 | 0.308430% |
| D | 5836 | 466 | 7.984921% |
Noise dominated data is calculated using 1-second bins in cleaned event files. If a bin has >2000 counts, and if more than 50% of those come from <1% of pixels, then it is considered to be noise-dominated and hence unusable.
| Quadrant | # 1 sec bins | Bins with >0 counts | Bins with >2000 counts | High rate bins dominated by noise | Noise dominated (total time) | Noise dominated (detector-on time) | Marked lightcurve |
|---|---|---|---|---|---|---|---|
| A | 7119 | 5837 | 413 | 413 | 5.80% | 7.08% | 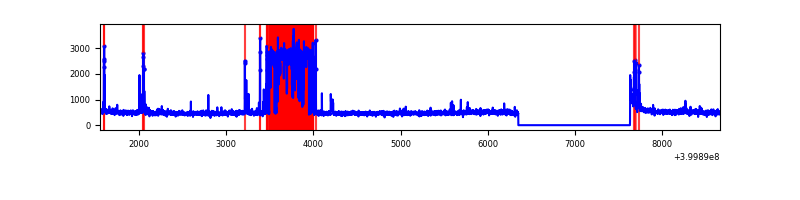 |
| B | 7119 | 5837 | 201 | 201 | 2.82% | 3.44% | 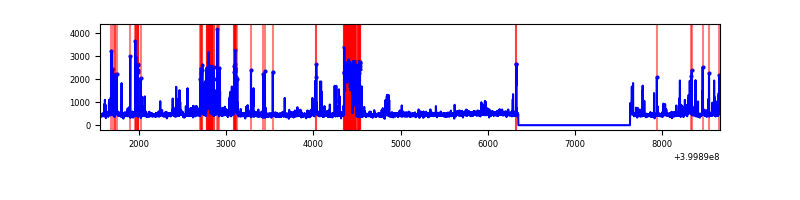 |
| C | 7119 | 5837 | 17 | 17 | 0.24% | 0.29% | 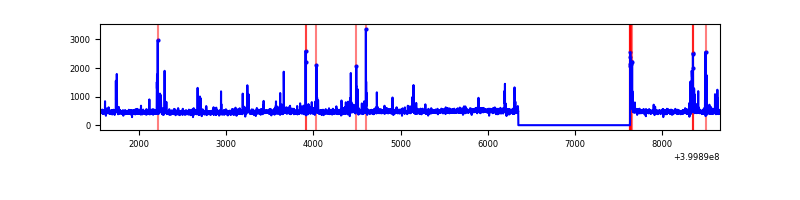 |
| D | 7118 | 5836 | 448 | 448 | 6.29% | 7.68% | 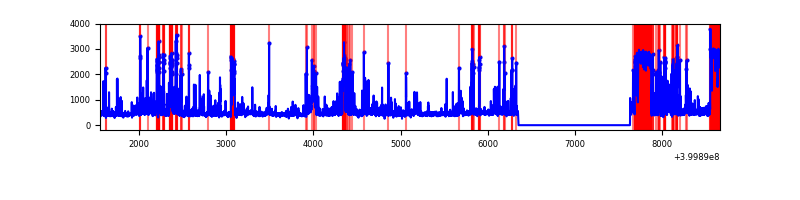 |
Top three noisy pixels from each quadrant. If the there are fewer than three noisy pixels in the level2.evt file, extra rows are filled as -1
| Pixel properties | Quadrant properties | ||||||
|---|---|---|---|---|---|---|---|
| Quadrant | DetID | PixID | Counts | Sigma | Mean | Median | Sigma |
| A | 15 | 190 | 1109123 | 8735.27 | 624 | 611 | 126.9 |
| A | 10 | 83 | 257100 | 2021.18 | 624 | 611 | 126.9 |
| A | 13 | 248 | 75194 | 587.73 | 624 | 611 | 126.9 |
| B | 5 | 172 | 706307 | 5797.75 | 631 | 614 | 121.7 |
| B | 0 | 229 | 63160 | 513.86 | 631 | 614 | 121.7 |
| B | 5 | 255 | 55996 | 455.0 | 631 | 614 | 121.7 |
| C | 15 | 214 | 249289 | 1701.89 | 628 | 633 | 146.1 |
| C | 14 | 254 | 169277 | 1154.26 | 628 | 633 | 146.1 |
| C | 0 | 10 | 26304 | 175.7 | 628 | 633 | 146.1 |
| D | 13 | 249 | 745417 | 5059.15 | 605 | 588 | 147.2 |
| D | 12 | 227 | 623116 | 4228.44 | 605 | 588 | 147.2 |
| D | 2 | 153 | 159388 | 1078.63 | 605 | 588 | 147.2 |
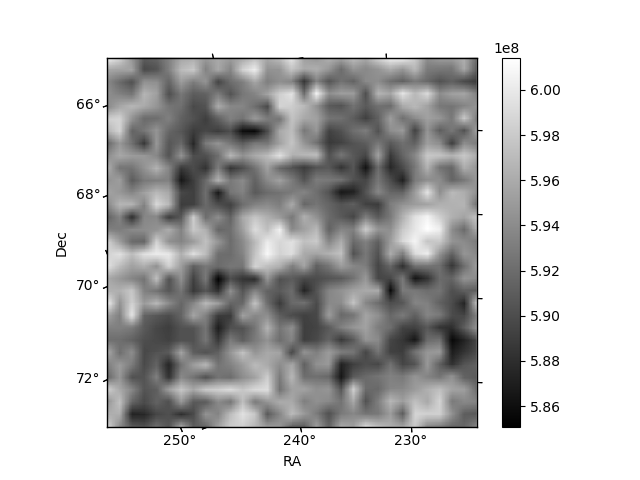
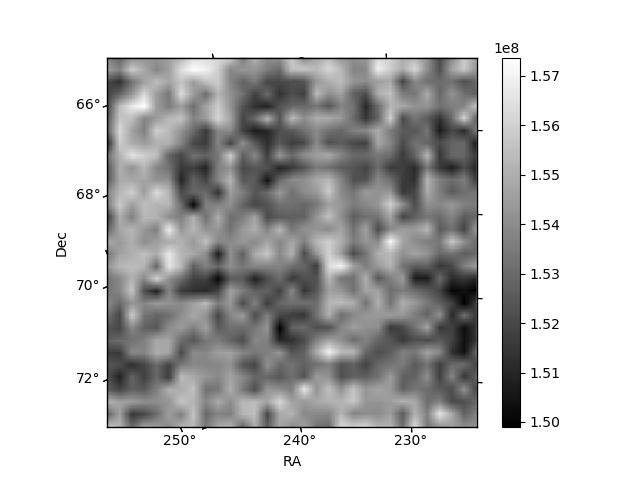
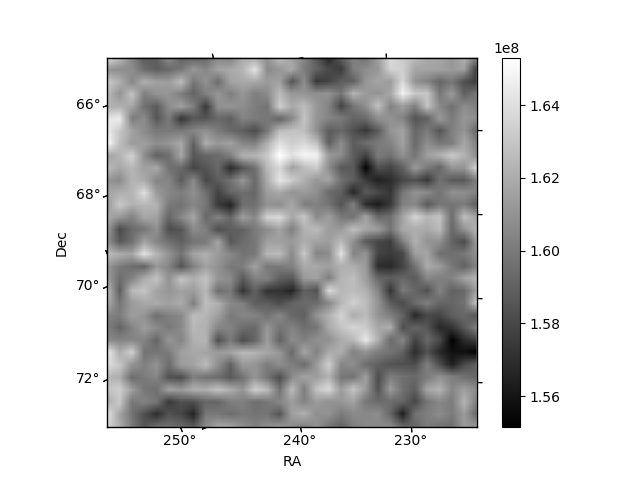
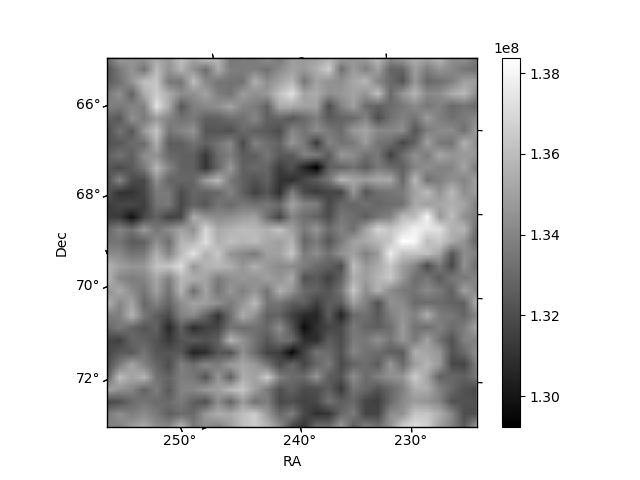
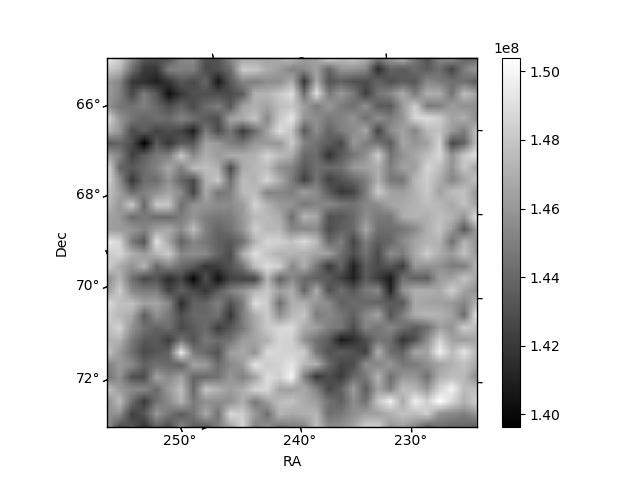
Histogram calculated using DETX and DETY for each event in the final _common_clean file
| Quadrant A | 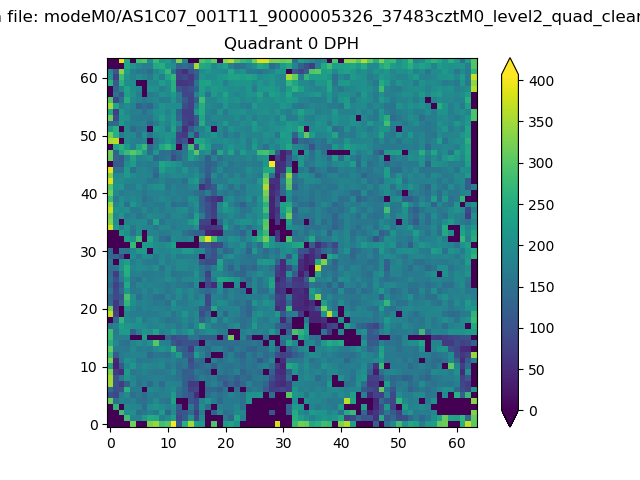 |
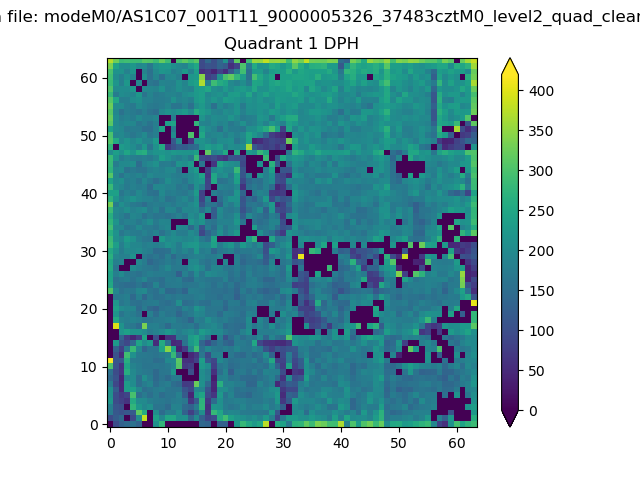 |
Quadrant B |
|---|---|---|---|
| Quadrant D | 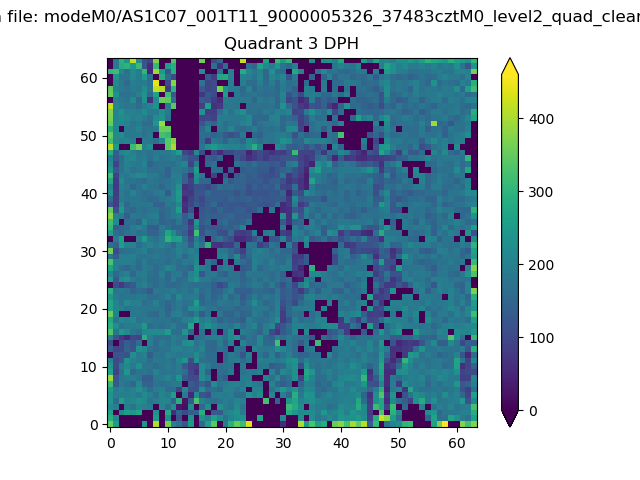 |
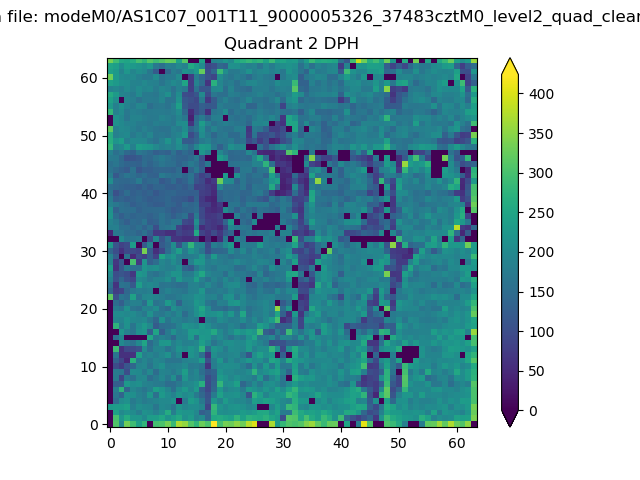 |
Quadrant C |
| Plot type | Count rate plots | Images |
|---|---|---|
| Comparison with Poisson distribution Blue bars denote a histogram of data divided into 1 sec bins. Red curve is a Poisson curve with rate = median count rate of data. |
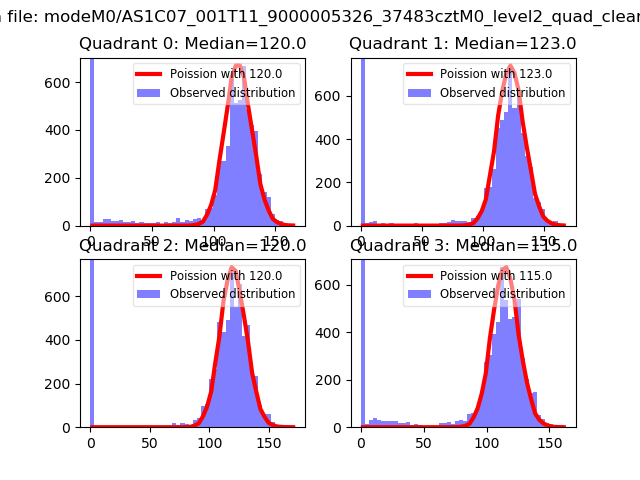 |
 |
| Quadrant-wise count rates Data is divided into 100 sec bins |
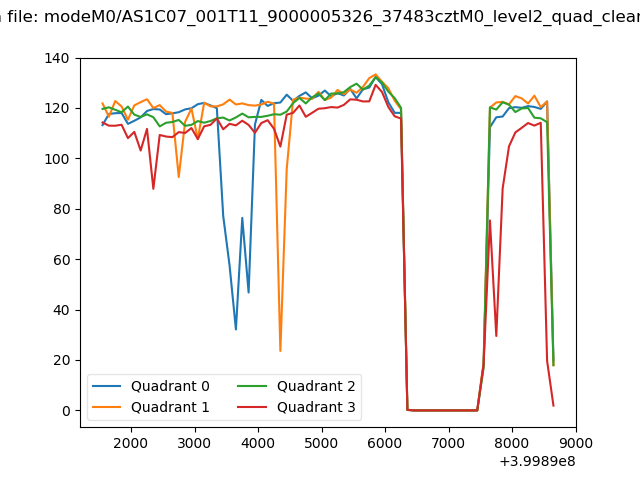 |
|
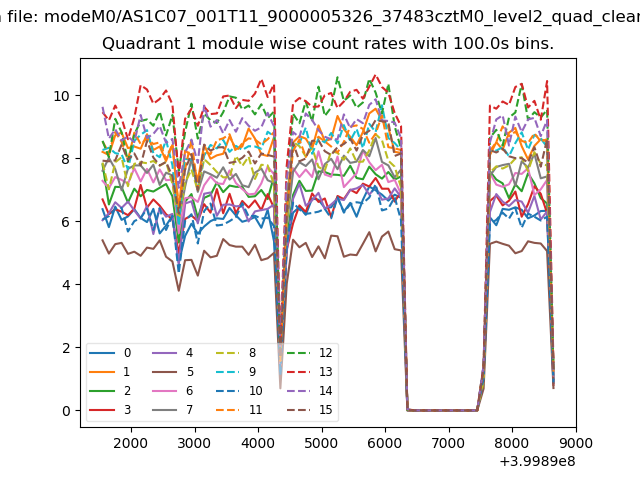
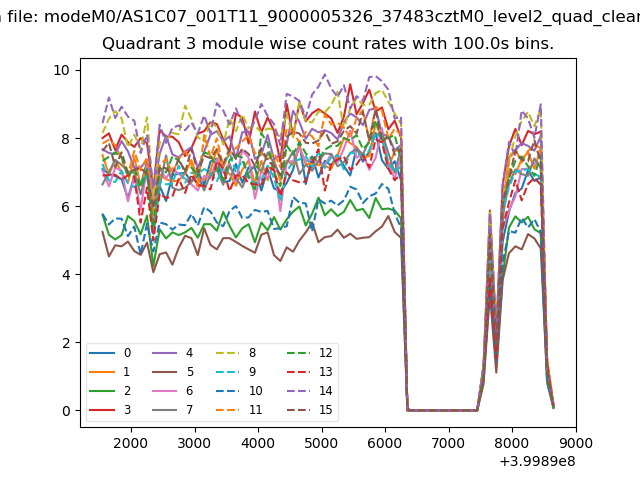
| Module-wise count rates for Quadrant A Data is divided into 100 sec bins |
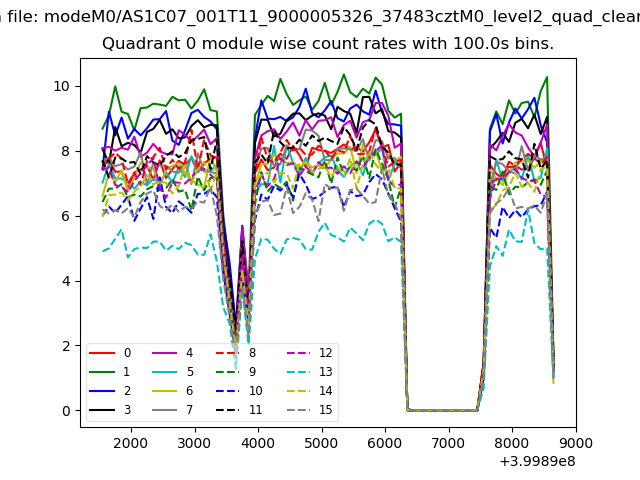 |
 |
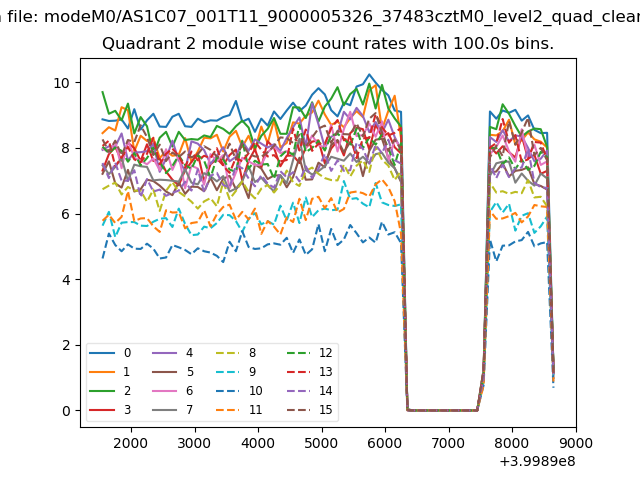
| Module-wise count rates for Quadrant B Data is divided into 100 sec bins |
 |
 |
| Module-wise count rates for Quadrant C Data is divided into 100 sec bins |
 |
 |
| Module-wise count rates for Quadrant D Data is divided into 100 sec bins |
 |
 |
| Parameter | Plot |
|---|---|
| CZT HV Monitor | 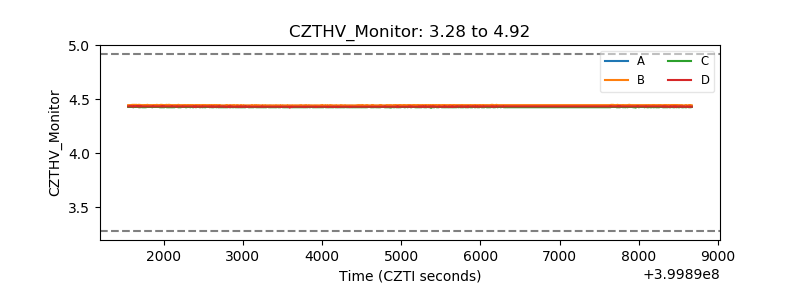 |
| D_VDD | 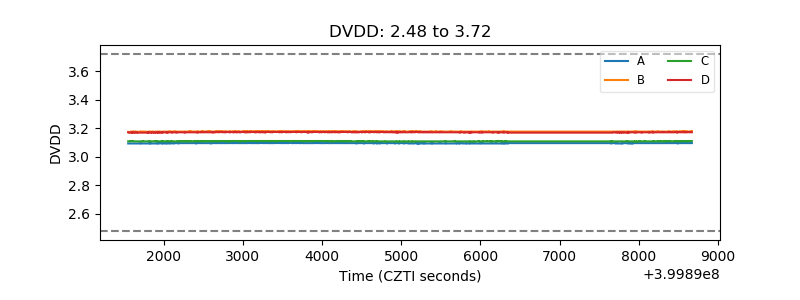 |
| Temperature 1 | 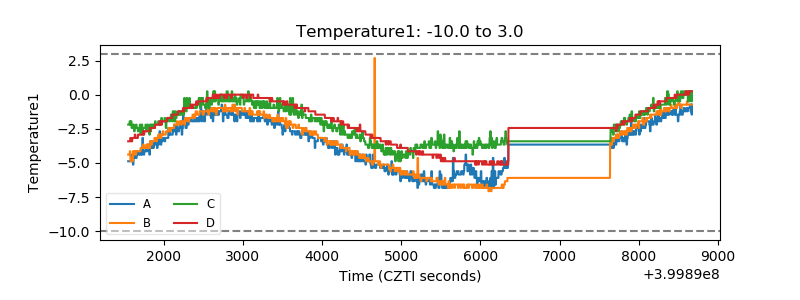 |
| Veto HV Monitor | 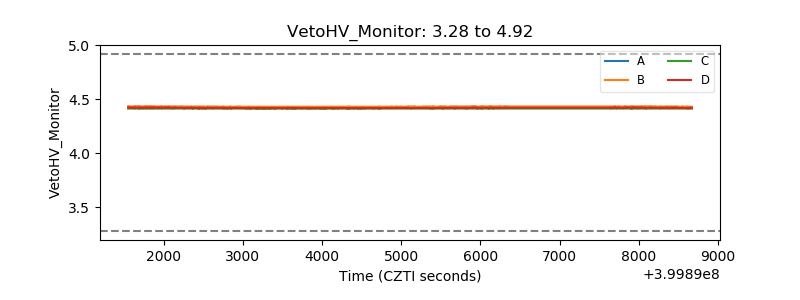 |
| Veto LLD | 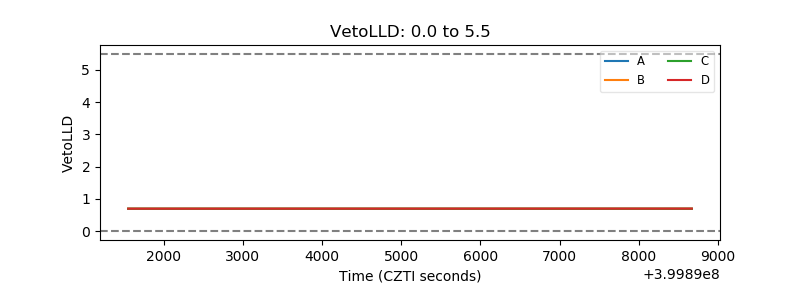 |
| Alpha Counter | 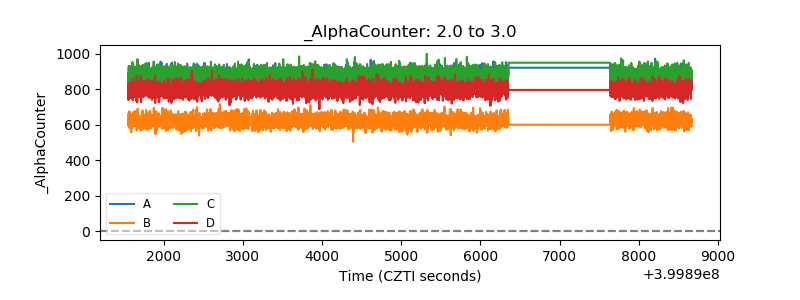 |
| _CPM_Rate |  |
| CZT Counter | 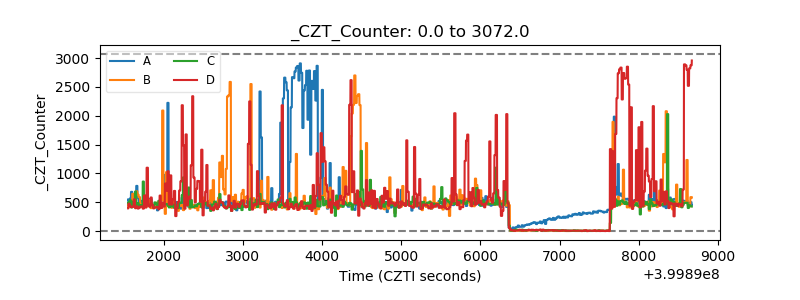 |
| +2.5 Volts monitor | 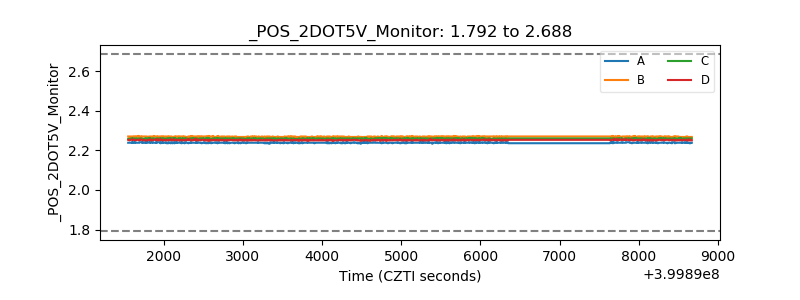 |
| +5 Volts monitor | 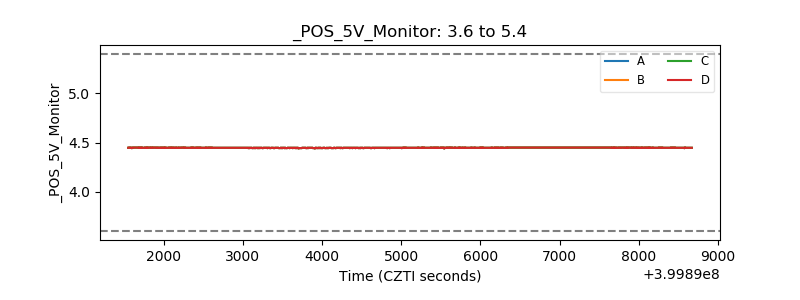 |
| _ROLL_ROT | 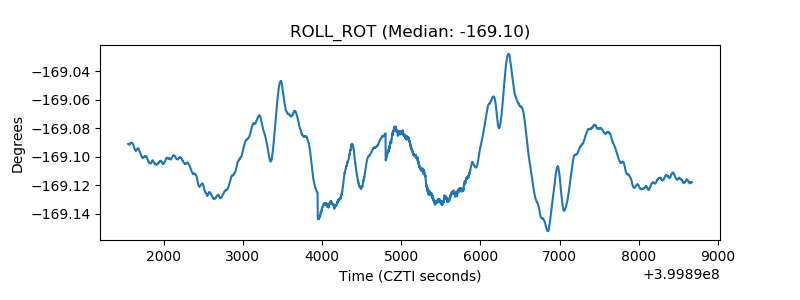 |
| _Roll_DEC | 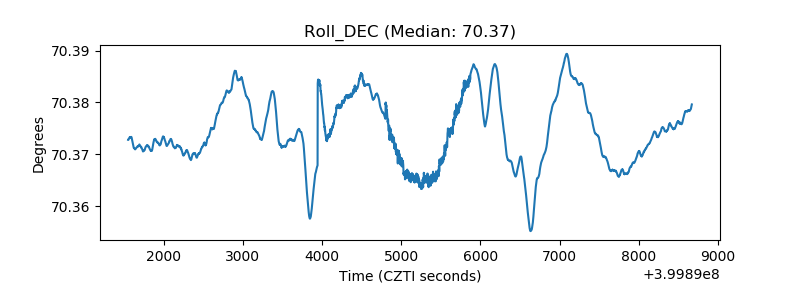 |
| _Roll_RA |  |
| Veto Counter | 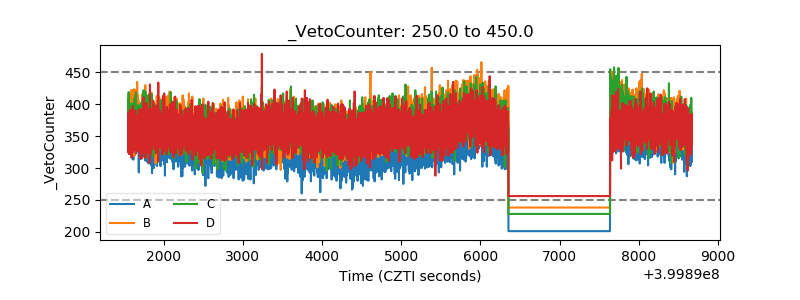 |