| Param | Original file | Final file |
|---|---|---|
| Filename | modeM0/AS1C07_001T11_9000005326_37485cztM0_level2.evt | modeM0/AS1C07_001T11_9000005326_37485cztM0_level2_quad_clean.evt |
| Size (bytes) | 1,009,025,280 | 190,247,040 |
| Size | 962.3 MB | 181.4 MB |
| Events in quadrant A | 8,239,256 | 1,291,288 |
| Events in quadrant B | 6,850,776 | 1,292,031 |
| Events in quadrant C | 5,664,515 | 1,282,261 |
| Events in quadrant D | 9,077,499 | 1,150,450 |
| Mode M0 | |||
|---|---|---|---|
| Quadrant | BADHDUFLAG | Total packets | Discarded packets |
| A | 0 | 31600 | 4 |
| B | 0 | 27437 | 5 |
| C | 0 | 23495 | 3 |
| D | 0 | 34359 | 6 |
| Mode M9 | |||
|---|---|---|---|
| Quadrant | BADHDUFLAG | Total packets | Discarded packets |
| A | 0 | 28 | 0 |
| B | 0 | 28 | 0 |
| C | 0 | 28 | 0 |
| D | 0 | 29 | 0 |
| Mode SS | |||
|---|---|---|---|
| Quadrant | BADHDUFLAG | Total packets | Discarded packets |
| A | 0 | 220 | 0 |
| B | 0 | 220 | 0 |
| C | 0 | 220 | 0 |
| D | 0 | 220 | 0 |
| Quadrant | Total seconds | Saturated seconds | Saturation percentage |
|---|---|---|---|
| A | 10768 | 94 | 0.872957% |
| B | 10767 | 415 | 3.854370% |
| C | 10768 | 99 | 0.919391% |
| D | 10766 | 1386 | 12.873862% |
Noise dominated data is calculated using 1-second bins in cleaned event files. If a bin has >2000 counts, and if more than 50% of those come from <1% of pixels, then it is considered to be noise-dominated and hence unusable.
| Quadrant | # 1 sec bins | Bins with >0 counts | Bins with >2000 counts | High rate bins dominated by noise | Noise dominated (total time) | Noise dominated (detector-on time) | Marked lightcurve |
|---|---|---|---|---|---|---|---|
| A | 13543 | 10770 | 36 | 36 | 0.27% | 0.33% | 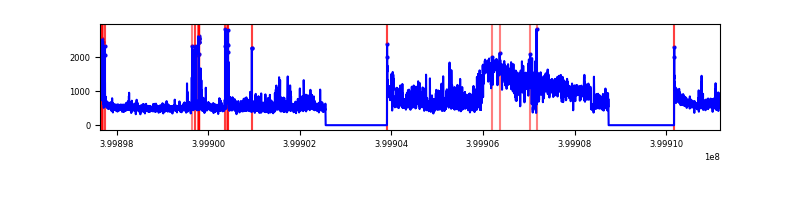 |
| B | 13543 | 10770 | 329 | 329 | 2.43% | 3.05% | 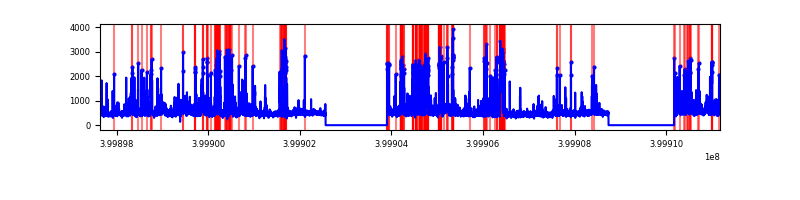 |
| C | 13543 | 10770 | 90 | 90 | 0.66% | 0.84% | 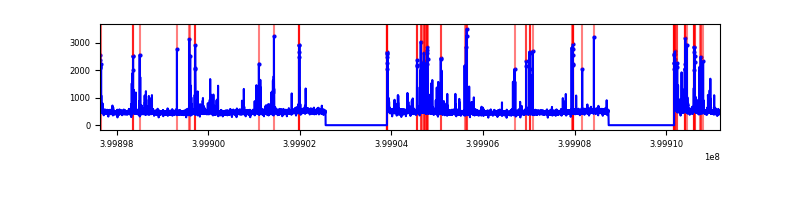 |
| D | 13543 | 10769 | 1322 | 1322 | 9.76% | 12.28% | 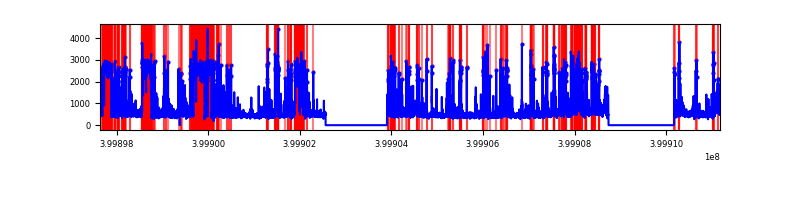 |
Top three noisy pixels from each quadrant. If the there are fewer than three noisy pixels in the level2.evt file, extra rows are filled as -1
| Pixel properties | Quadrant properties | ||||||
|---|---|---|---|---|---|---|---|
| Quadrant | DetID | PixID | Counts | Sigma | Mean | Median | Sigma |
| A | 15 | 222 | 2747175 | 11381.3 | 1197 | 1173 | 241.3 |
| A | 10 | 83 | 552231 | 2283.96 | 1197 | 1173 | 241.3 |
| A | 13 | 248 | 117194 | 480.87 | 1197 | 1173 | 241.3 |
| B | 5 | 172 | 737758 | 3280.16 | 1177 | 1146 | 224.6 |
| B | 15 | 35 | 398472 | 1769.31 | 1177 | 1146 | 224.6 |
| B | 0 | 229 | 315902 | 1401.62 | 1177 | 1146 | 224.6 |
| C | 15 | 214 | 463258 | 1710.73 | 1164 | 1169 | 270.1 |
| C | 14 | 254 | 410866 | 1516.76 | 1164 | 1169 | 270.1 |
| C | 0 | 207 | 137554 | 504.92 | 1164 | 1169 | 270.1 |
| D | 12 | 227 | 1915124 | 7279.66 | 1091 | 1062 | 262.9 |
| D | 13 | 249 | 1803937 | 6856.79 | 1091 | 1062 | 262.9 |
| D | 2 | 249 | 336076 | 1274.14 | 1091 | 1062 | 262.9 |
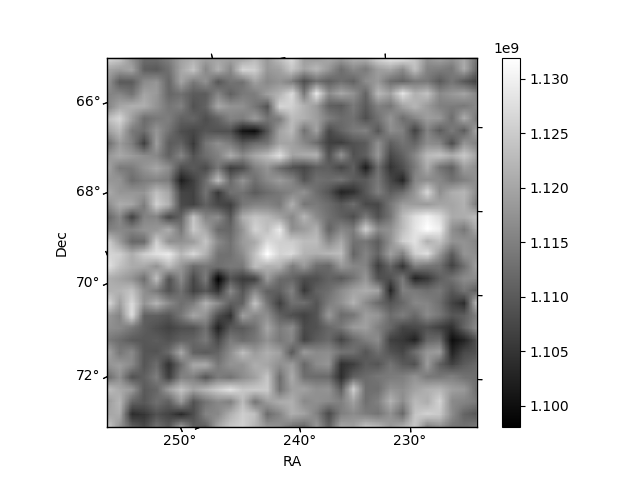
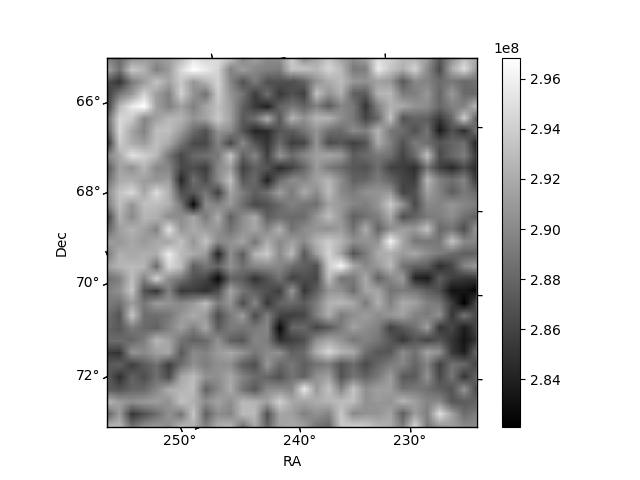
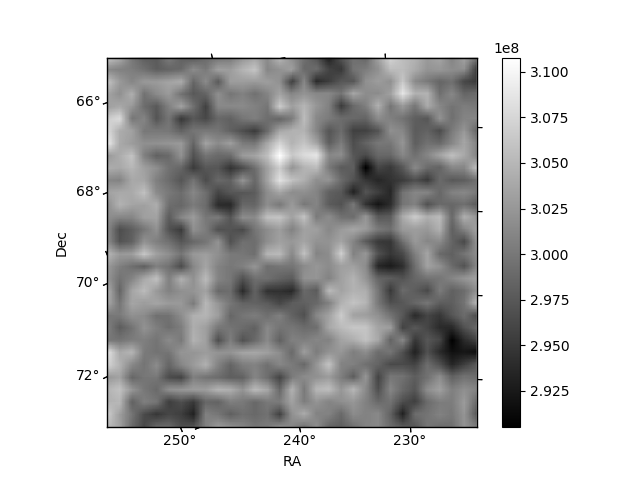
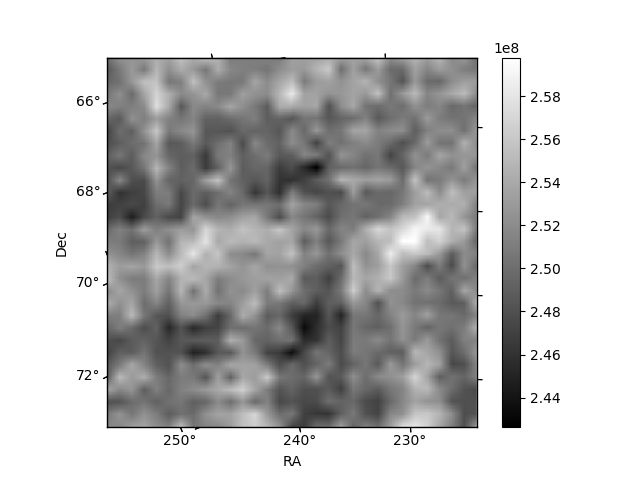
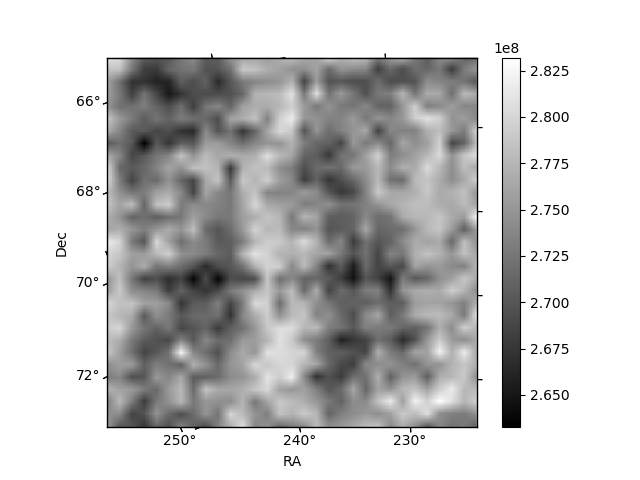
Histogram calculated using DETX and DETY for each event in the final _common_clean file
| Quadrant A | 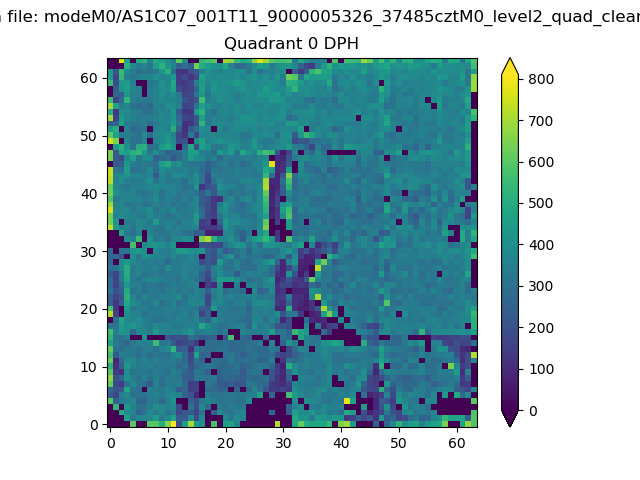 |
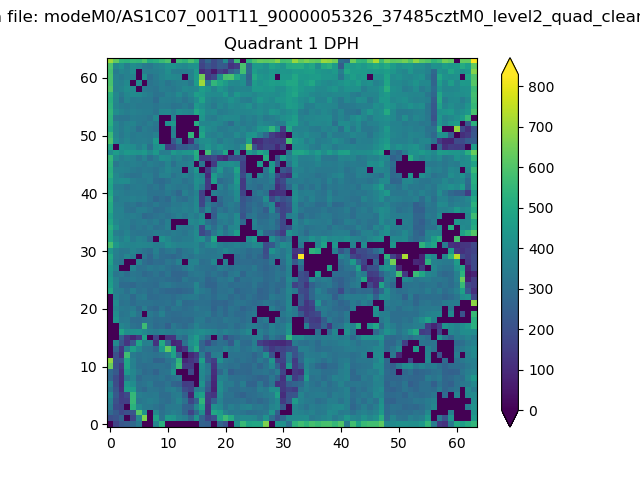 |
Quadrant B |
|---|---|---|---|
| Quadrant D | 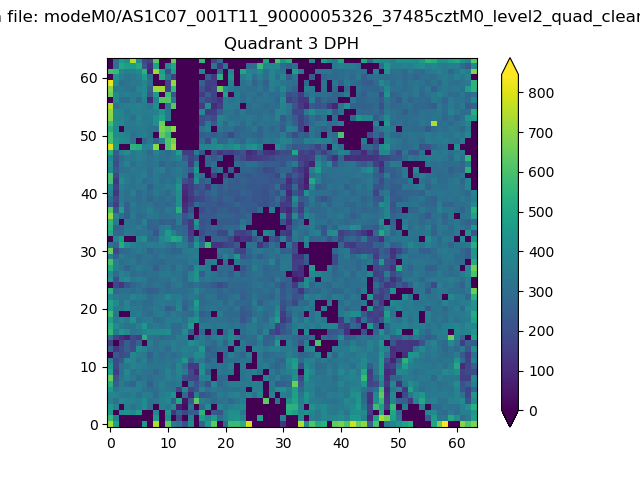 |
 |
Quadrant C |
| Plot type | Count rate plots | Images |
|---|---|---|
| Comparison with Poisson distribution Blue bars denote a histogram of data divided into 1 sec bins. Red curve is a Poisson curve with rate = median count rate of data. |
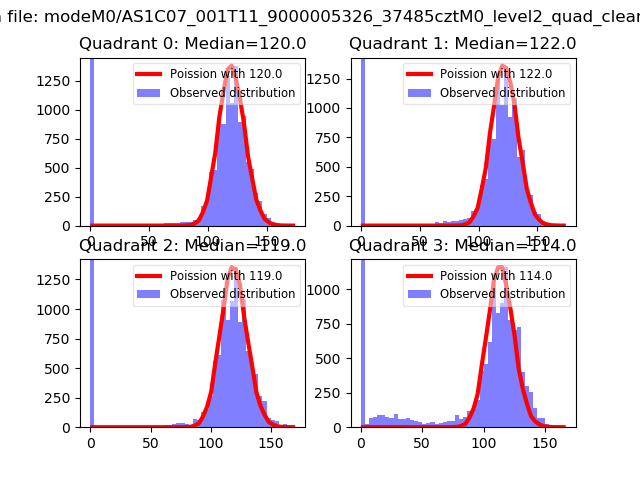 |
 |
| Quadrant-wise count rates Data is divided into 100 sec bins |
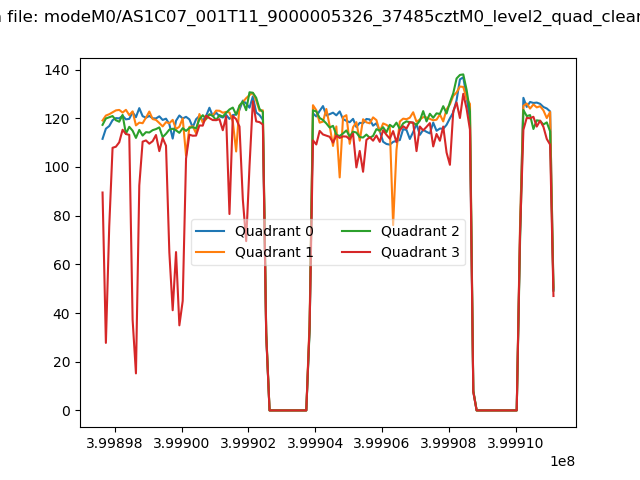 |
|
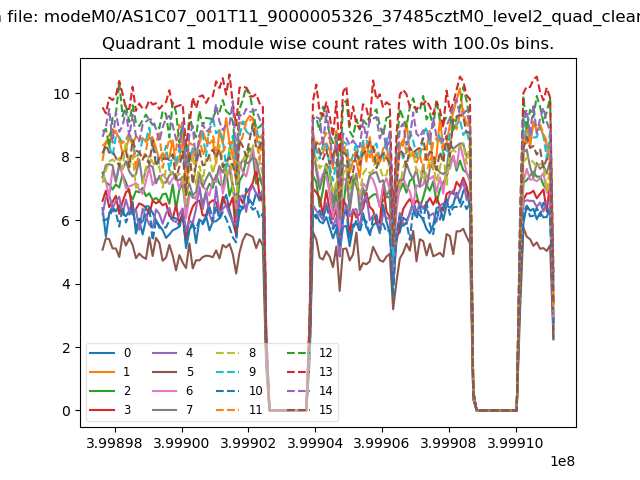
| Module-wise count rates for Quadrant A Data is divided into 100 sec bins |
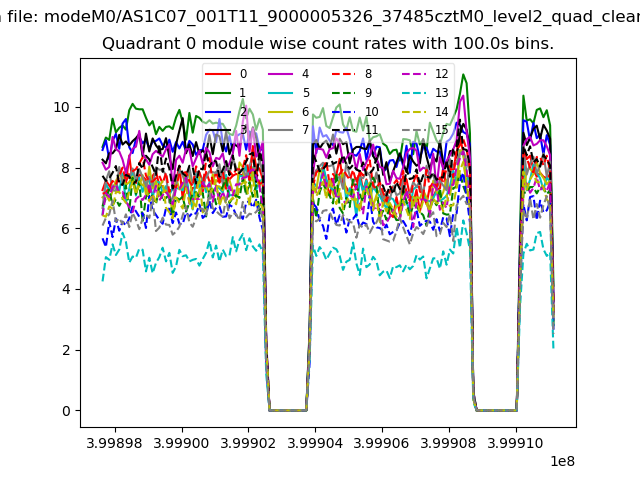 |
 |
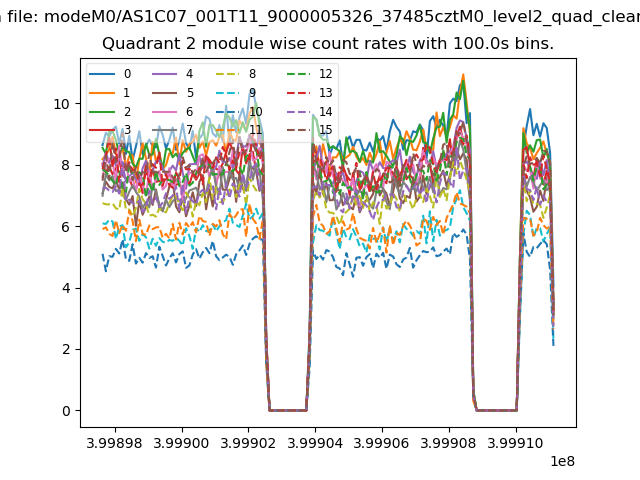
| Module-wise count rates for Quadrant B Data is divided into 100 sec bins |
 |
 |
| Module-wise count rates for Quadrant C Data is divided into 100 sec bins |
 |
 |
| Module-wise count rates for Quadrant D Data is divided into 100 sec bins |
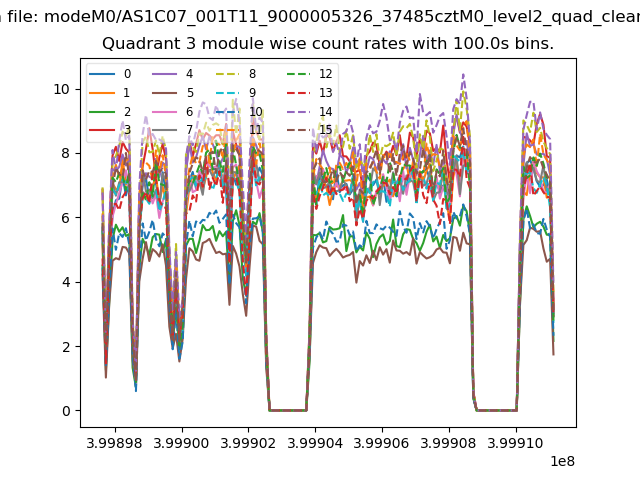 |
 |
| Parameter | Plot |
|---|---|
| CZT HV Monitor | 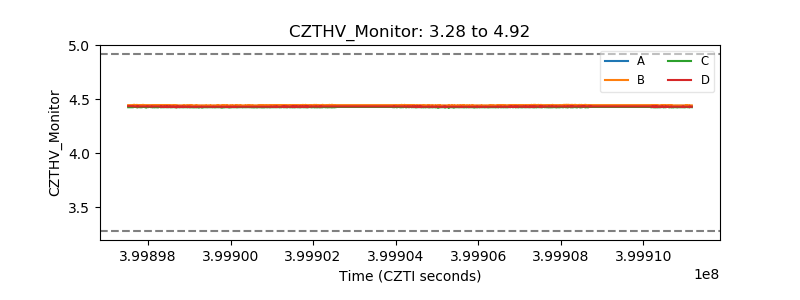 |
| D_VDD | 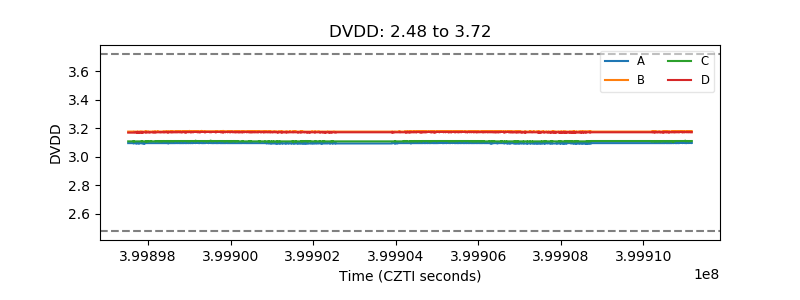 |
| Temperature 1 | 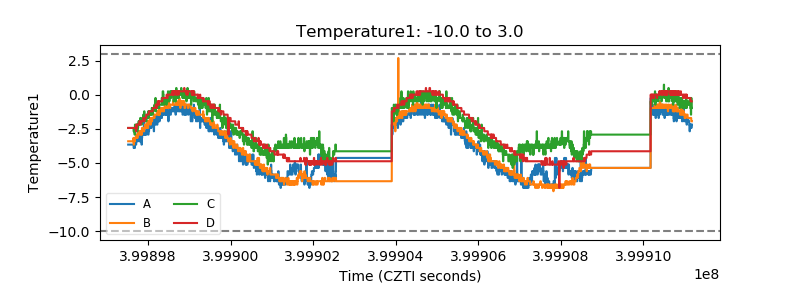 |
| Veto HV Monitor | 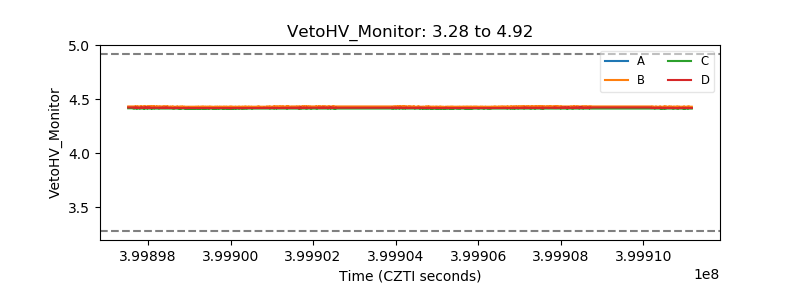 |
| Veto LLD | 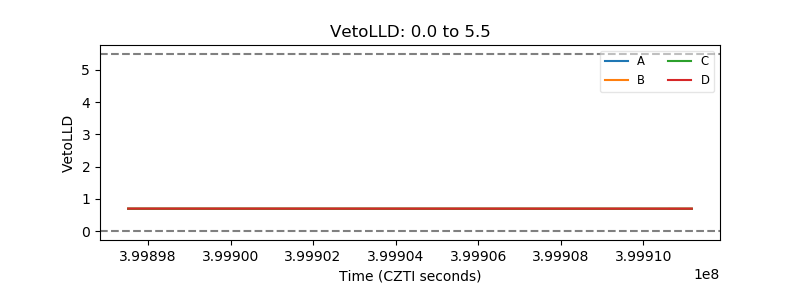 |
| Alpha Counter | 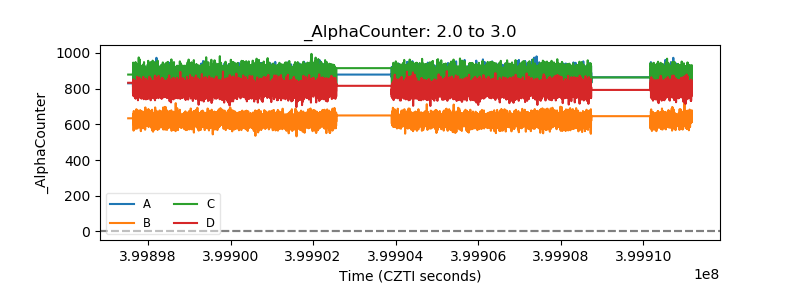 |
| _CPM_Rate | 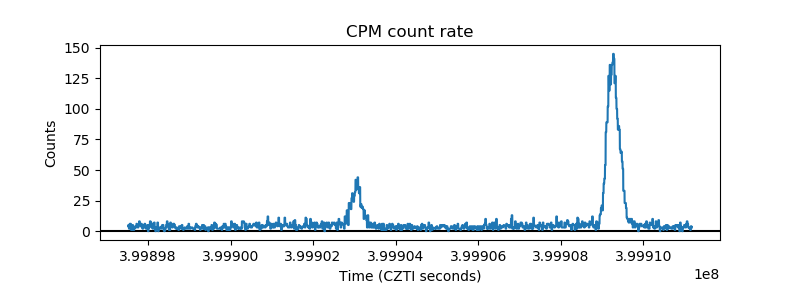 |
| CZT Counter | 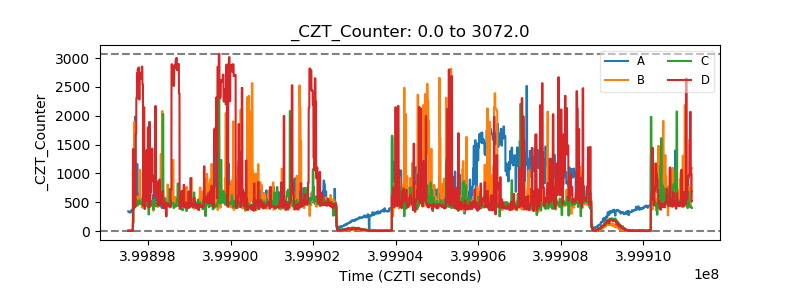 |
| +2.5 Volts monitor | 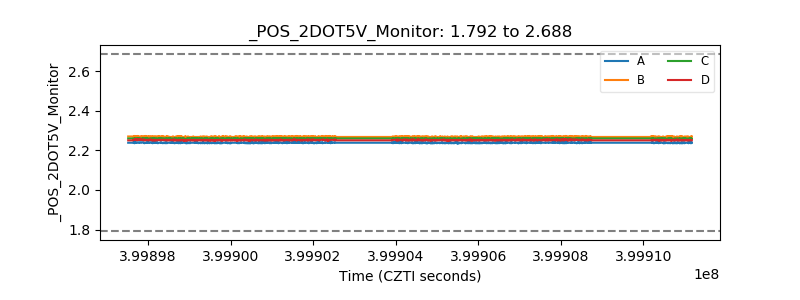 |
| +5 Volts monitor | 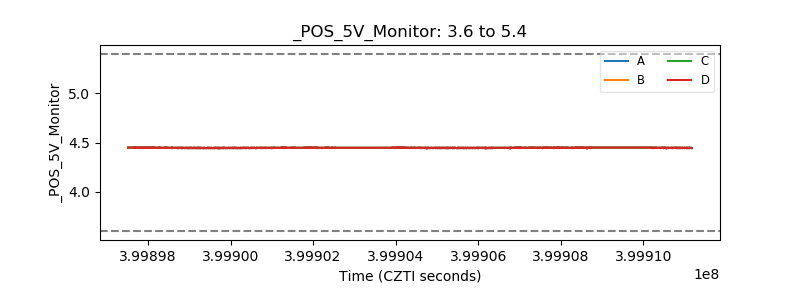 |
| _ROLL_ROT | 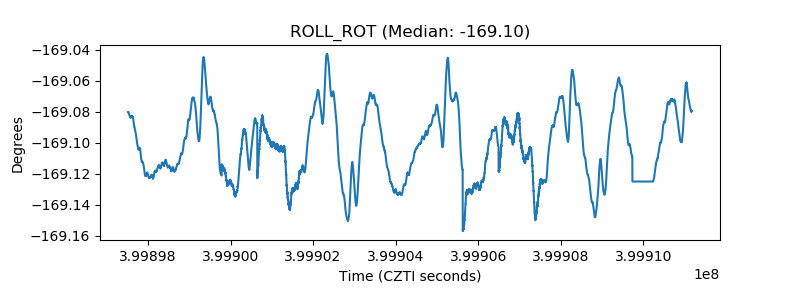 |
| _Roll_DEC | 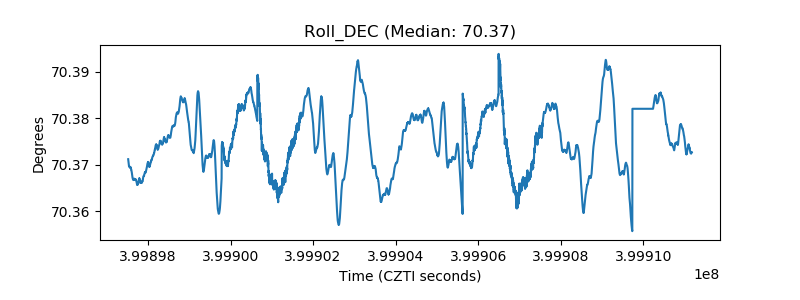 |
| _Roll_RA | 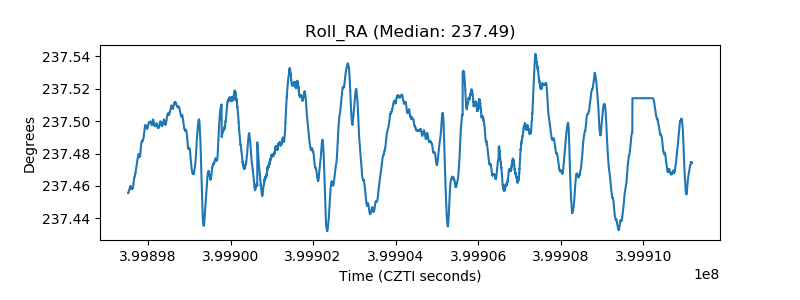 |
| Veto Counter | 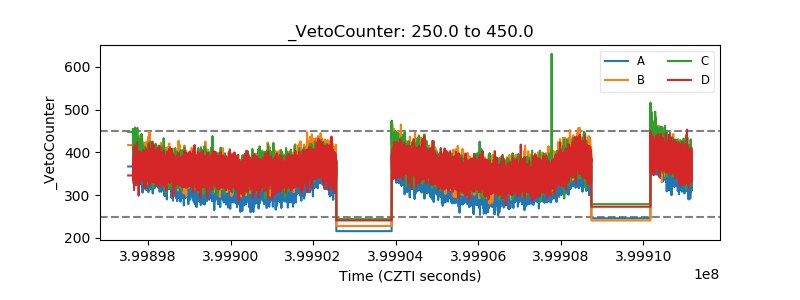 |