| Param | Original file | Final file |
|---|---|---|
| Filename | modeM0/AS1C07_001T11_9000005326_37486cztM0_level2.evt | modeM0/AS1C07_001T11_9000005326_37486cztM0_level2_quad_clean.evt |
| Size (bytes) | 513,789,120 | 101,897,280 |
| Size | 490.0 MB | 97.2 MB |
| Events in quadrant A | 3,769,724 | 688,597 |
| Events in quadrant B | 3,776,625 | 679,838 |
| Events in quadrant C | 3,132,332 | 678,424 |
| Events in quadrant D | 4,497,064 | 642,185 |
| Mode M0 | |||
|---|---|---|---|
| Quadrant | BADHDUFLAG | Total packets | Discarded packets |
| A | 0 | 15120 | 3 |
| B | 0 | 15137 | 2 |
| C | 0 | 12883 | 2 |
| D | 0 | 17206 | 2 |
| Mode M9 | |||
|---|---|---|---|
| Quadrant | BADHDUFLAG | Total packets | Discarded packets |
| A | 0 | 19 | 0 |
| B | 0 | 19 | 0 |
| C | 0 | 19 | 0 |
| D | 0 | 20 | 0 |
| Mode SS | |||
|---|---|---|---|
| Quadrant | BADHDUFLAG | Total packets | Discarded packets |
| A | 0 | 114 | 0 |
| B | 0 | 114 | 0 |
| C | 0 | 114 | 0 |
| D | 0 | 114 | 0 |
| Quadrant | Total seconds | Saturated seconds | Saturation percentage |
|---|---|---|---|
| A | 5679 | 25 | 0.440218% |
| B | 5679 | 272 | 4.789576% |
| C | 5679 | 121 | 2.130657% |
| D | 5679 | 437 | 7.695017% |
Noise dominated data is calculated using 1-second bins in cleaned event files. If a bin has >2000 counts, and if more than 50% of those come from <1% of pixels, then it is considered to be noise-dominated and hence unusable.
| Quadrant | # 1 sec bins | Bins with >0 counts | Bins with >2000 counts | High rate bins dominated by noise | Noise dominated (total time) | Noise dominated (detector-on time) | Marked lightcurve |
|---|---|---|---|---|---|---|---|
| A | 7232 | 5680 | 7 | 7 | 0.10% | 0.12% | 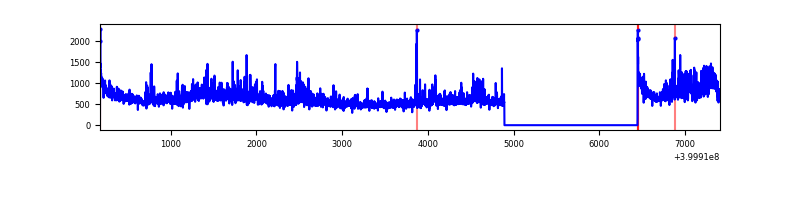 |
| B | 7232 | 5680 | 161 | 161 | 2.23% | 2.83% | 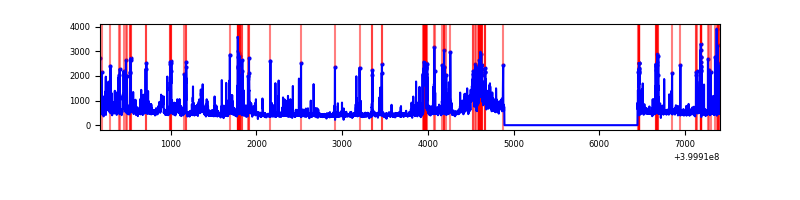 |
| C | 7232 | 5680 | 116 | 116 | 1.60% | 2.04% | 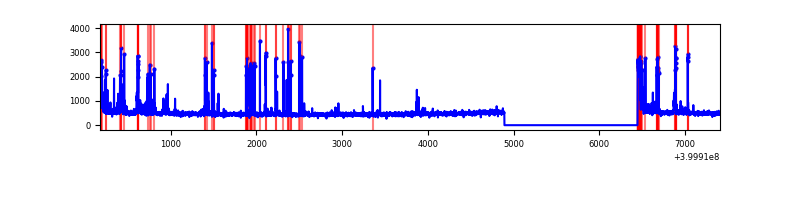 |
| D | 7232 | 5680 | 430 | 430 | 5.95% | 7.57% | 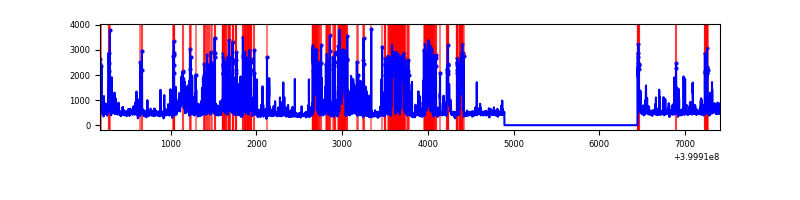 |
Top three noisy pixels from each quadrant. If the there are fewer than three noisy pixels in the level2.evt file, extra rows are filled as -1
| Pixel properties | Quadrant properties | ||||||
|---|---|---|---|---|---|---|---|
| Quadrant | DetID | PixID | Counts | Sigma | Mean | Median | Sigma |
| A | 15 | 222 | 922692 | 7157.2 | 632 | 619 | 128.8 |
| A | 10 | 83 | 326381 | 2528.59 | 632 | 619 | 128.8 |
| A | 12 | 189 | 20596 | 155.06 | 632 | 619 | 128.8 |
| B | 5 | 172 | 389225 | 3274.51 | 618 | 603 | 118.7 |
| B | 5 | 255 | 258860 | 2176.06 | 618 | 603 | 118.7 |
| B | 15 | 35 | 233573 | 1962.99 | 618 | 603 | 118.7 |
| C | 15 | 214 | 244685 | 1706.4 | 613 | 615 | 143.0 |
| C | 14 | 254 | 226213 | 1577.26 | 613 | 615 | 143.0 |
| C | 0 | 10 | 137154 | 954.61 | 613 | 615 | 143.0 |
| D | 13 | 249 | 830514 | 5634.0 | 604 | 588 | 147.3 |
| D | 5 | 32 | 385383 | 2612.2 | 604 | 588 | 147.3 |
| D | 2 | 250 | 352958 | 2392.08 | 604 | 588 | 147.3 |
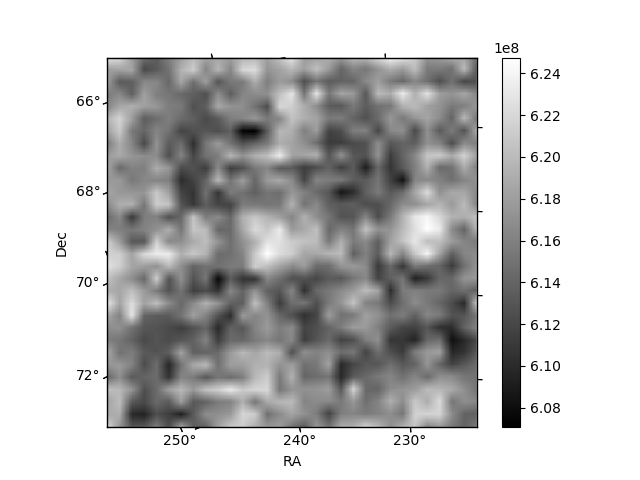
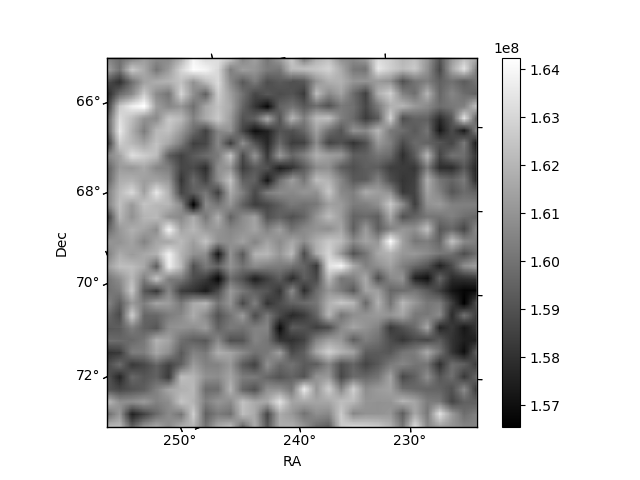
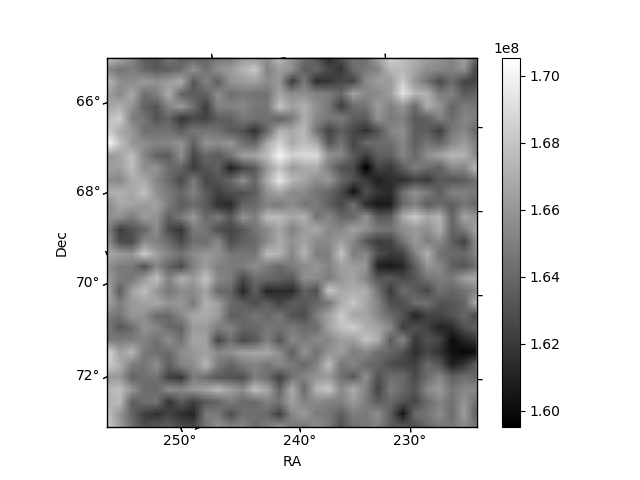
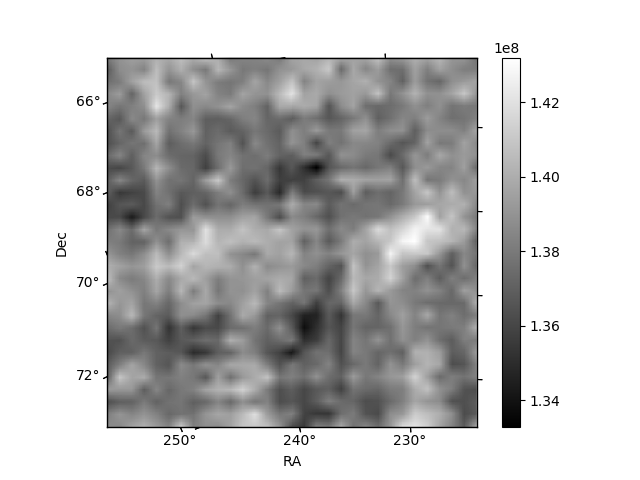
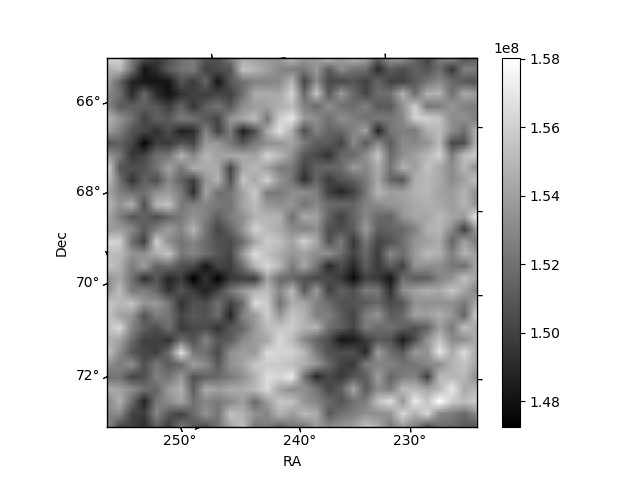
Histogram calculated using DETX and DETY for each event in the final _common_clean file
| Quadrant A | 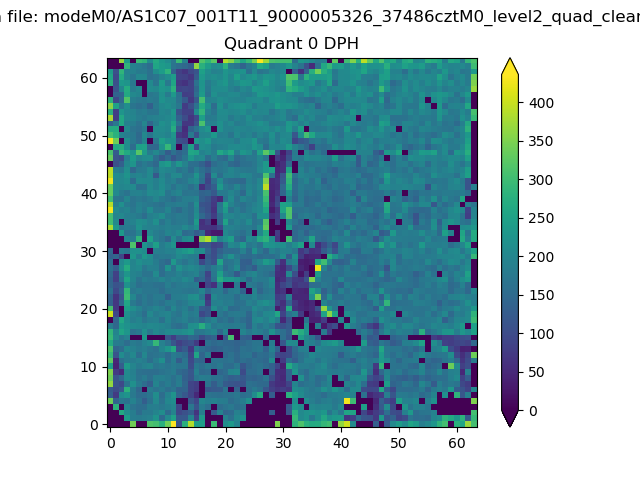 |
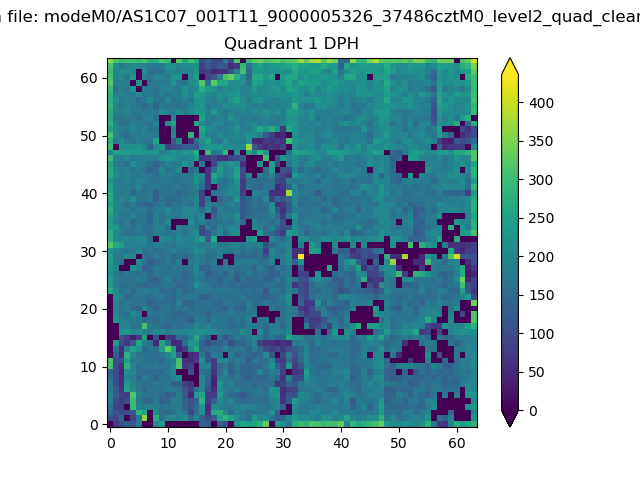 |
Quadrant B |
|---|---|---|---|
| Quadrant D | 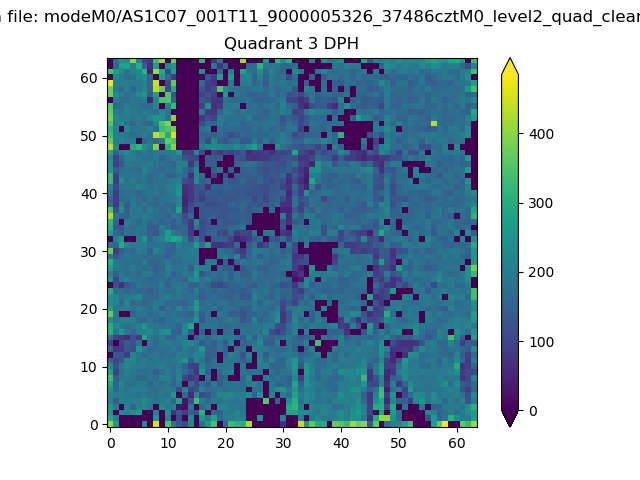 |
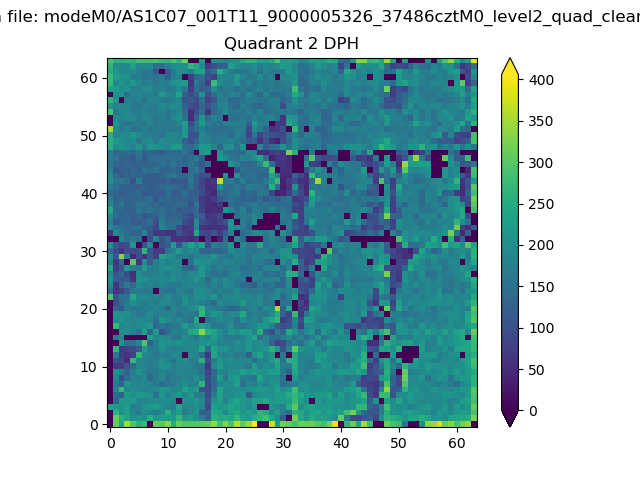 |
Quadrant C |
| Plot type | Count rate plots | Images |
|---|---|---|
| Comparison with Poisson distribution Blue bars denote a histogram of data divided into 1 sec bins. Red curve is a Poisson curve with rate = median count rate of data. |
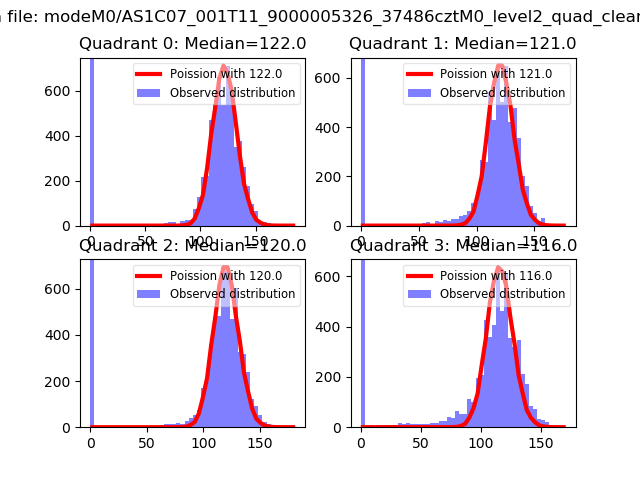 |
 |
| Quadrant-wise count rates Data is divided into 100 sec bins |
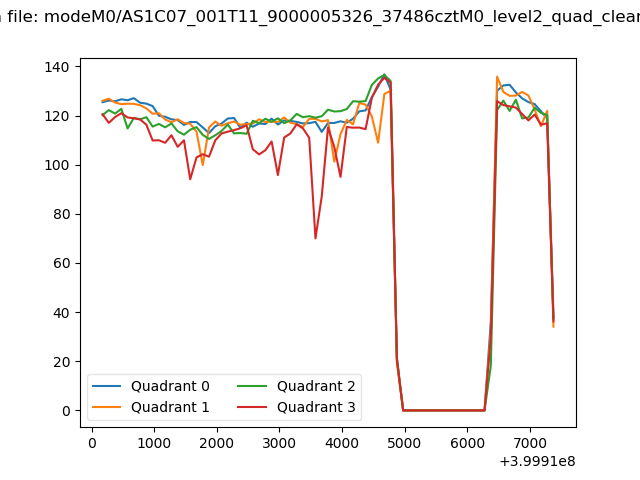 |
|
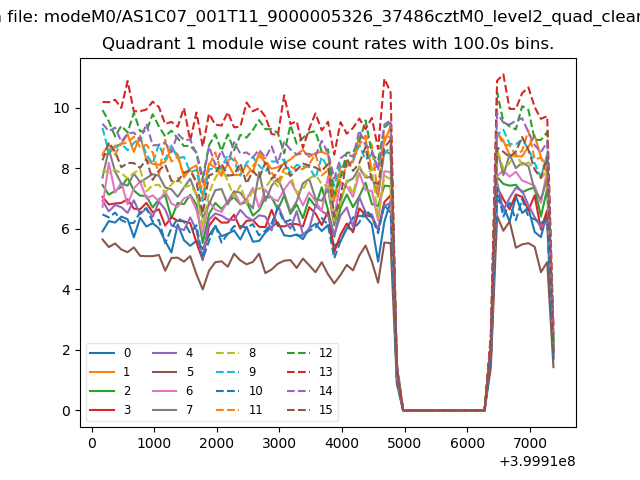
| Module-wise count rates for Quadrant A Data is divided into 100 sec bins |
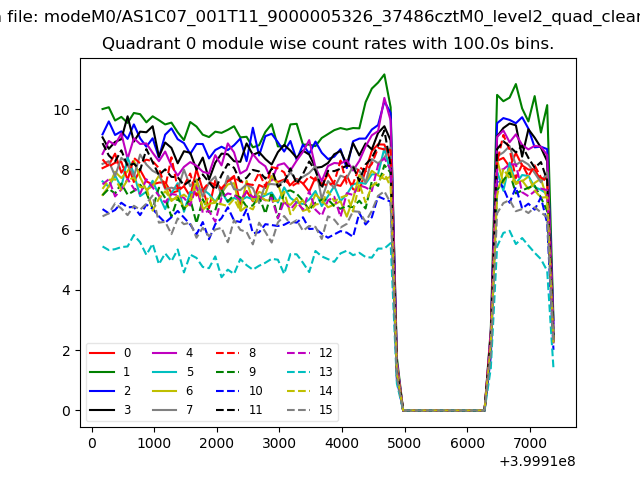 |
 |
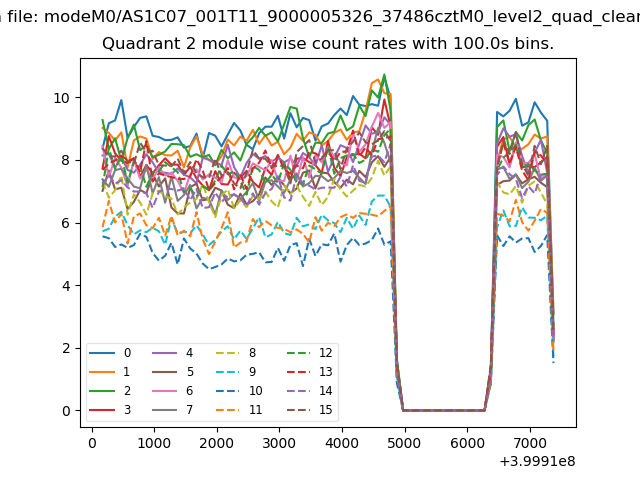
| Module-wise count rates for Quadrant B Data is divided into 100 sec bins |
 |
 |
| Module-wise count rates for Quadrant C Data is divided into 100 sec bins |
 |
 |
| Module-wise count rates for Quadrant D Data is divided into 100 sec bins |
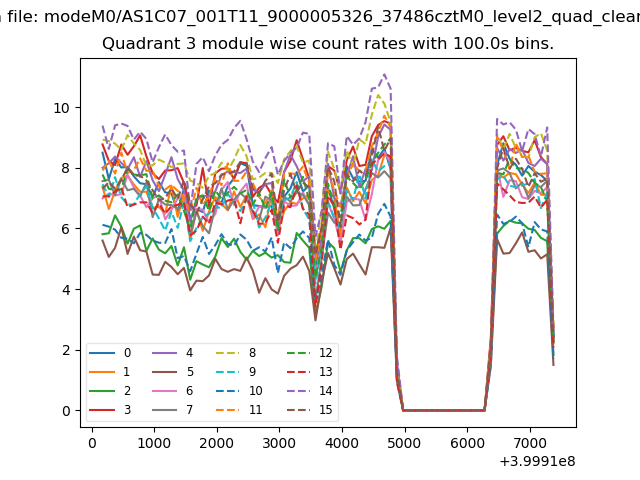 |
 |
| Parameter | Plot |
|---|---|
| CZT HV Monitor | 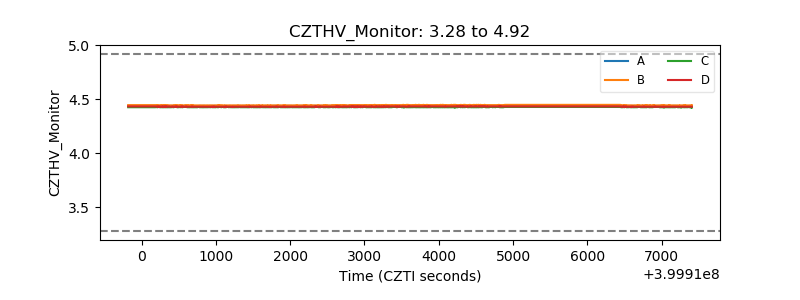 |
| D_VDD | 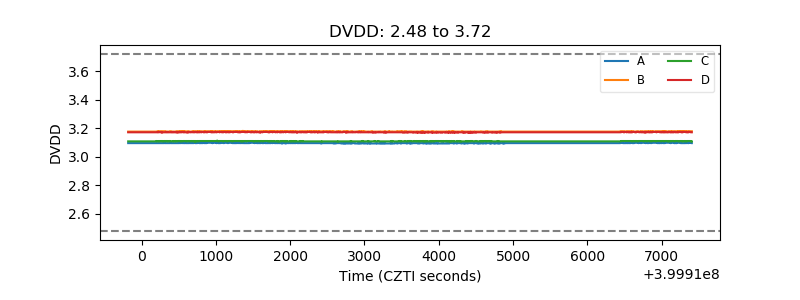 |
| Temperature 1 | 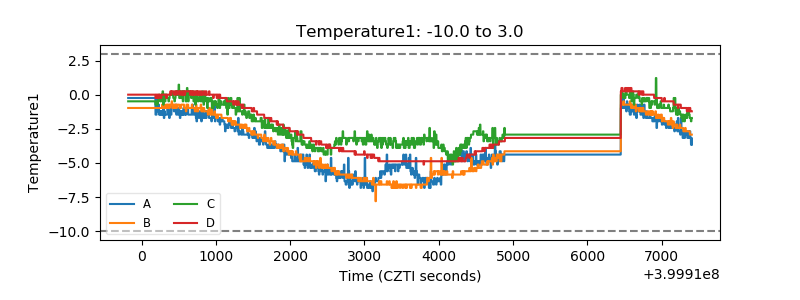 |
| Veto HV Monitor | 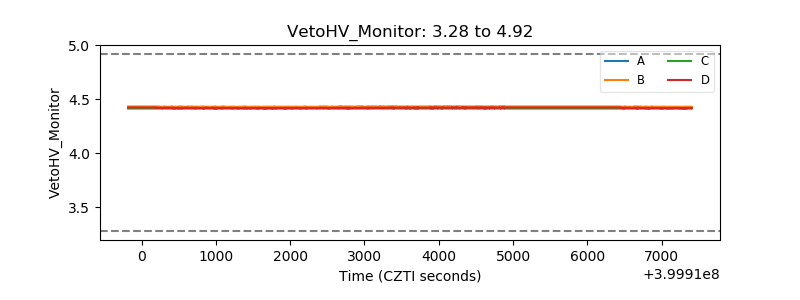 |
| Veto LLD |  |
| Alpha Counter |  |
| _CPM_Rate | 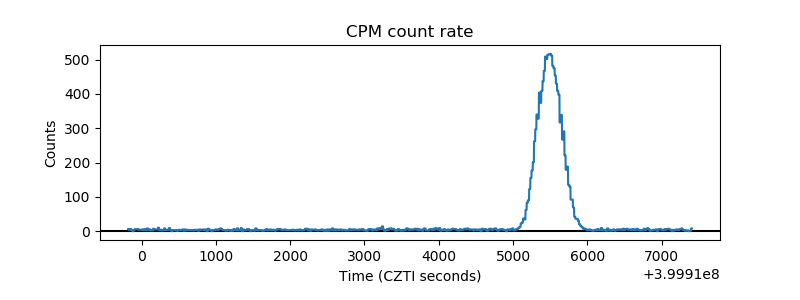 |
| CZT Counter | 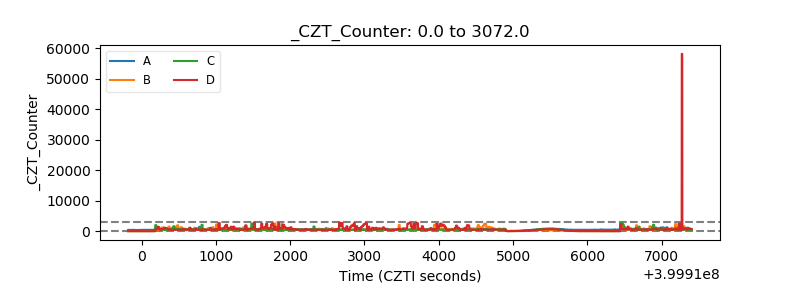 |
| +2.5 Volts monitor | 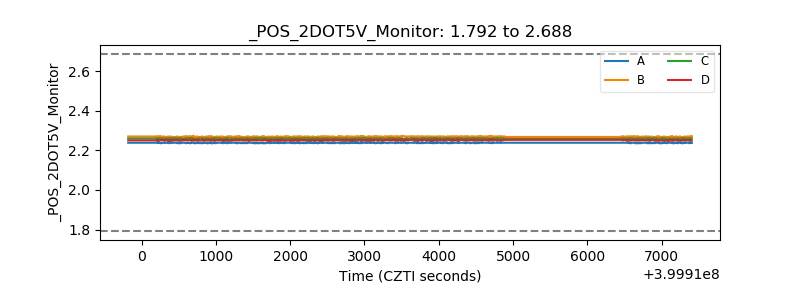 |
| +5 Volts monitor |  |
| _ROLL_ROT | 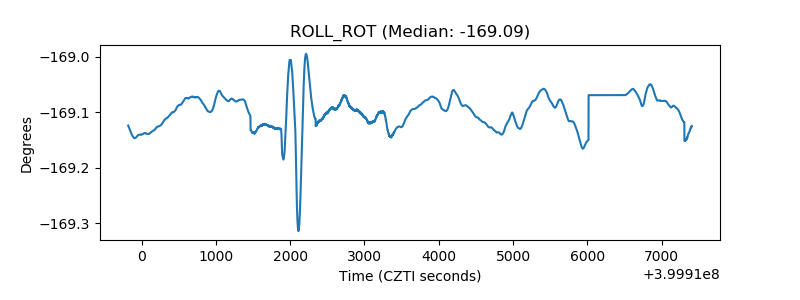 |
| _Roll_DEC | 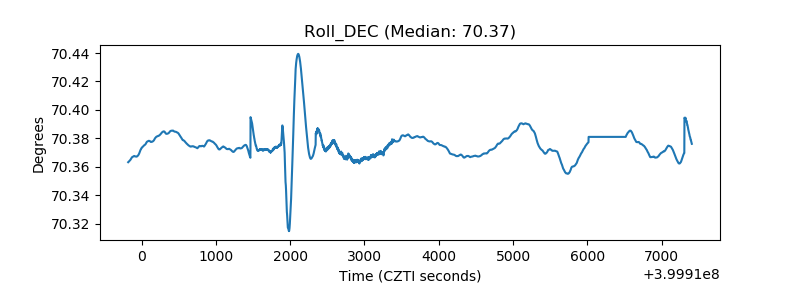 |
| _Roll_RA | 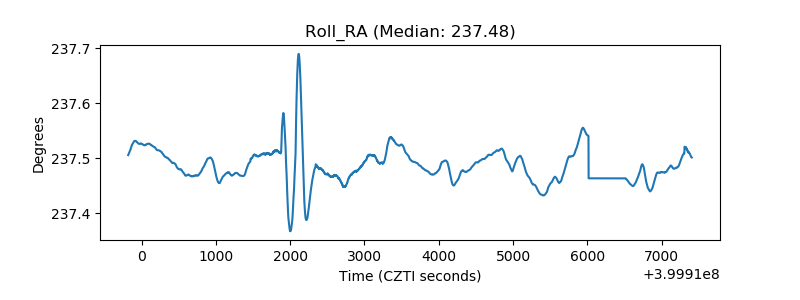 |
| Veto Counter | 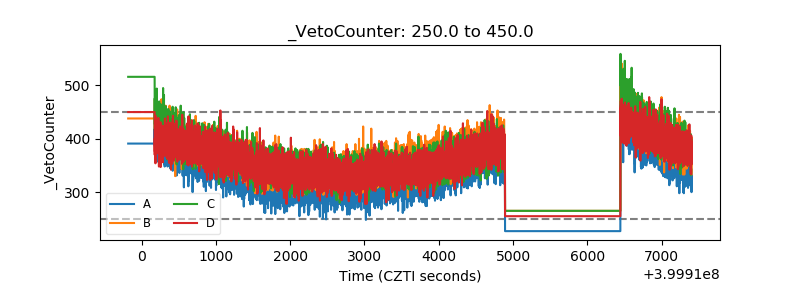 |