| Param | Original file | Final file |
|---|---|---|
| Filename | modeM0/AS1C07_001T11_9000005326_37489cztM0_level2.evt | modeM0/AS1C07_001T11_9000005326_37489cztM0_level2_quad_clean.evt |
| Size (bytes) | 546,802,560 | 96,200,640 |
| Size | 521.5 MB | 91.7 MB |
| Events in quadrant A | 4,039,719 | 649,945 |
| Events in quadrant B | 4,578,128 | 631,014 |
| Events in quadrant C | 2,937,292 | 665,852 |
| Events in quadrant D | 4,648,311 | 597,294 |
| Mode M0 | |||
|---|---|---|---|
| Quadrant | BADHDUFLAG | Total packets | Discarded packets |
| A | 0 | 15501 | 3 |
| B | 0 | 17283 | 2 |
| C | 0 | 12117 | 2 |
| D | 0 | 17564 | 2 |
| Mode M9 | |||
|---|---|---|---|
| Quadrant | BADHDUFLAG | Total packets | Discarded packets |
| A | 0 | 19 | 0 |
| B | 0 | 19 | 0 |
| C | 0 | 19 | 0 |
| D | 0 | 20 | 0 |
| Mode SS | |||
|---|---|---|---|
| Quadrant | BADHDUFLAG | Total packets | Discarded packets |
| A | 0 | 108 | 0 |
| B | 0 | 108 | 0 |
| C | 0 | 108 | 0 |
| D | 0 | 108 | 0 |
| Quadrant | Total seconds | Saturated seconds | Saturation percentage |
|---|---|---|---|
| A | 5261 | 123 | 2.337959% |
| B | 5261 | 732 | 13.913705% |
| C | 5261 | 128 | 2.432998% |
| D | 5261 | 718 | 13.647596% |
Noise dominated data is calculated using 1-second bins in cleaned event files. If a bin has >2000 counts, and if more than 50% of those come from <1% of pixels, then it is considered to be noise-dominated and hence unusable.
| Quadrant | # 1 sec bins | Bins with >0 counts | Bins with >2000 counts | High rate bins dominated by noise | Noise dominated (total time) | Noise dominated (detector-on time) | Marked lightcurve |
|---|---|---|---|---|---|---|---|
| A | 7083 | 5262 | 108 | 108 | 1.52% | 2.05% | 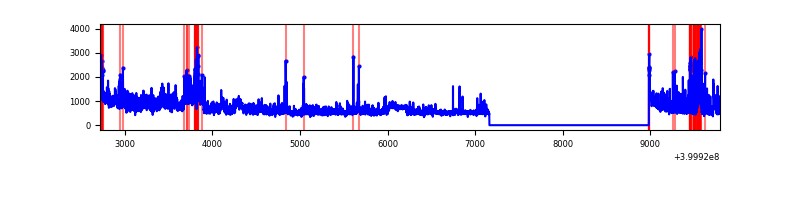 |
| B | 7083 | 5262 | 585 | 585 | 8.26% | 11.12% | 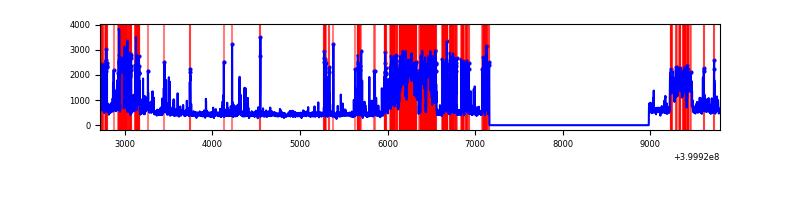 |
| C | 7083 | 5262 | 114 | 114 | 1.61% | 2.17% | 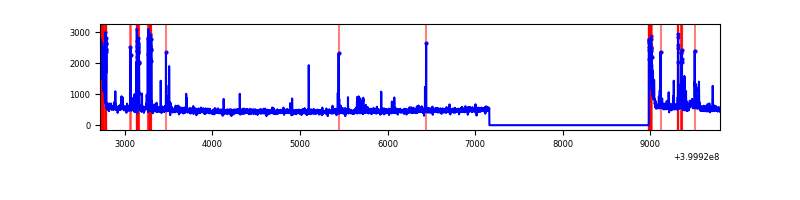 |
| D | 7083 | 5262 | 683 | 683 | 9.64% | 12.98% | 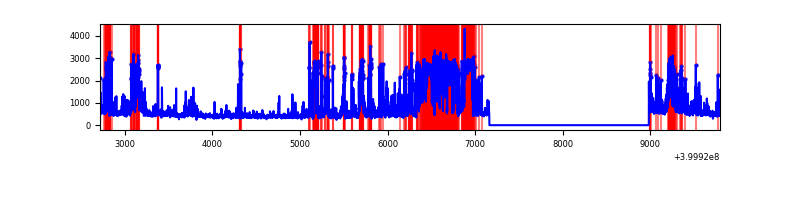 |
Top three noisy pixels from each quadrant. If the there are fewer than three noisy pixels in the level2.evt file, extra rows are filled as -1
| Pixel properties | Quadrant properties | ||||||
|---|---|---|---|---|---|---|---|
| Quadrant | DetID | PixID | Counts | Sigma | Mean | Median | Sigma |
| A | 15 | 222 | 1063852 | 9120.14 | 580 | 568 | 116.6 |
| A | 10 | 83 | 302374 | 2588.69 | 580 | 568 | 116.6 |
| A | 13 | 248 | 260143 | 2226.46 | 580 | 568 | 116.6 |
| B | 5 | 172 | 1413218 | 13449.89 | 558 | 544 | 105.0 |
| B | 5 | 255 | 462672 | 4399.86 | 558 | 544 | 105.0 |
| B | 15 | 35 | 375452 | 3569.45 | 558 | 544 | 105.0 |
| C | 15 | 214 | 222884 | 1656.59 | 577 | 582 | 134.2 |
| C | 14 | 254 | 221617 | 1647.15 | 577 | 582 | 134.2 |
| C | 0 | 10 | 171322 | 1272.35 | 577 | 582 | 134.2 |
| D | 13 | 249 | 992821 | 7511.5 | 545 | 530 | 132.1 |
| D | 12 | 227 | 872635 | 6601.71 | 545 | 530 | 132.1 |
| D | 2 | 250 | 284413 | 2148.95 | 545 | 530 | 132.1 |
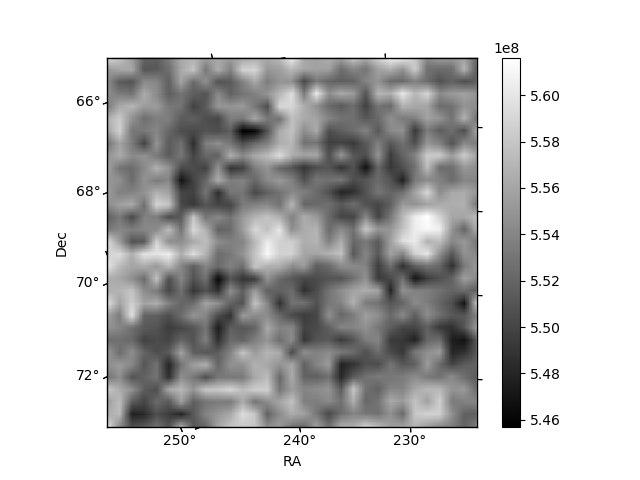
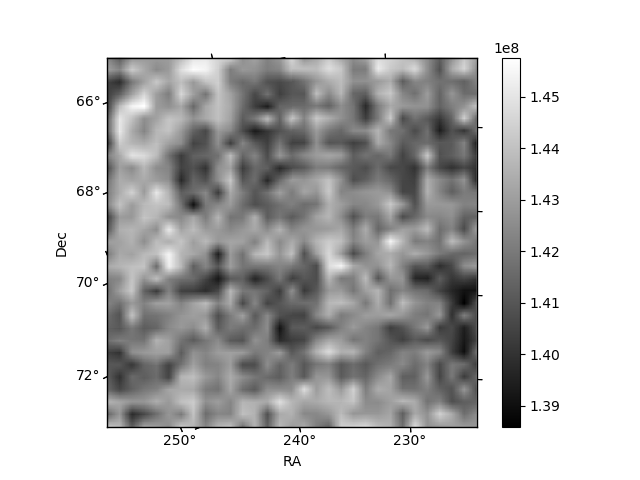
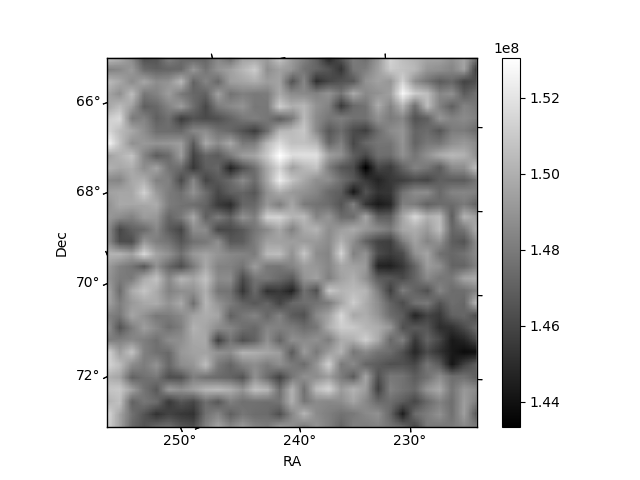
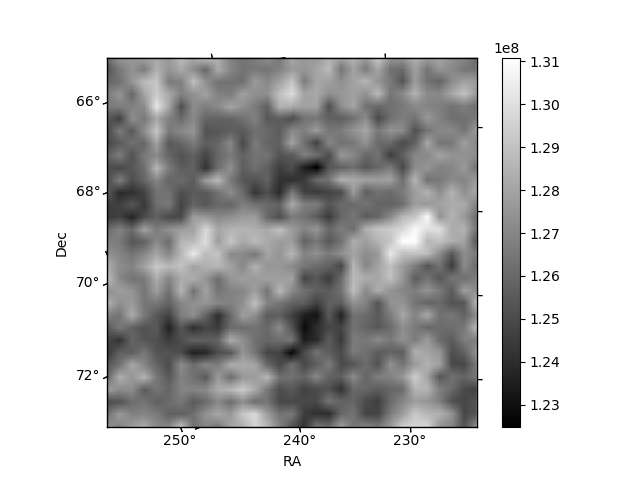
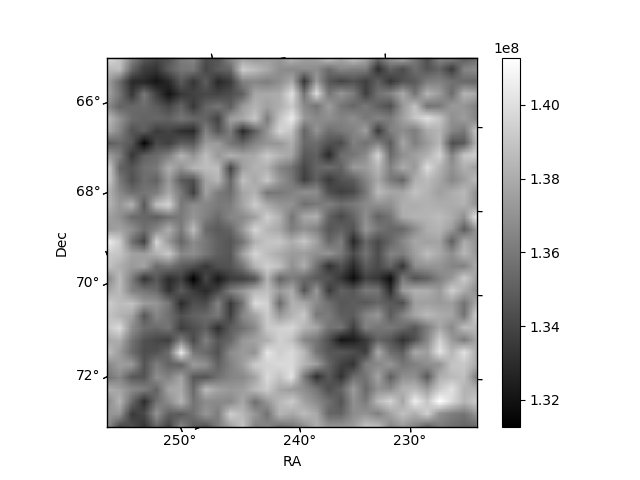
Histogram calculated using DETX and DETY for each event in the final _common_clean file
| Quadrant A | 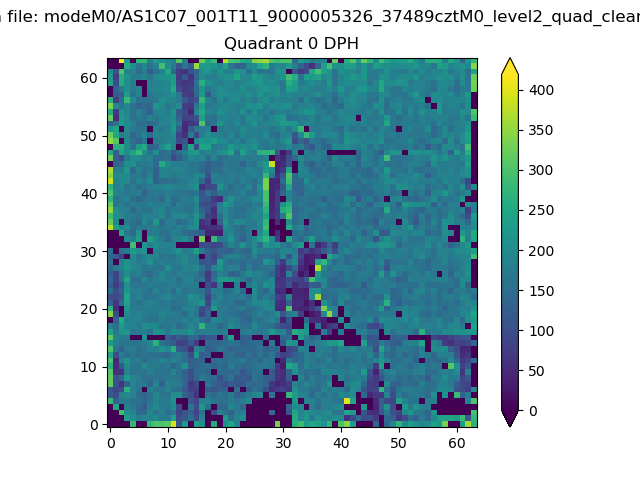 |
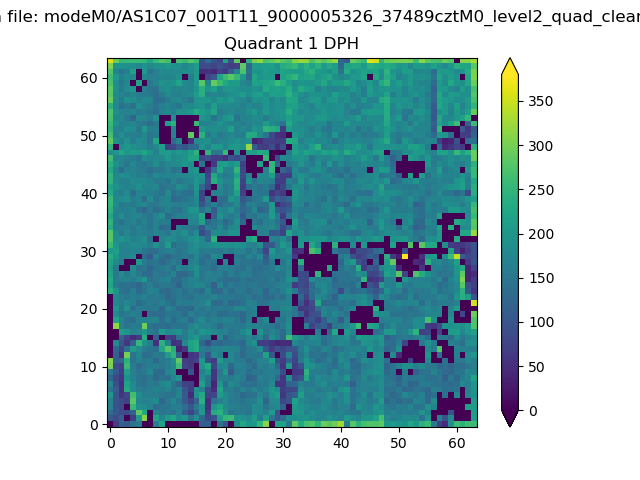 |
Quadrant B |
|---|---|---|---|
| Quadrant D | 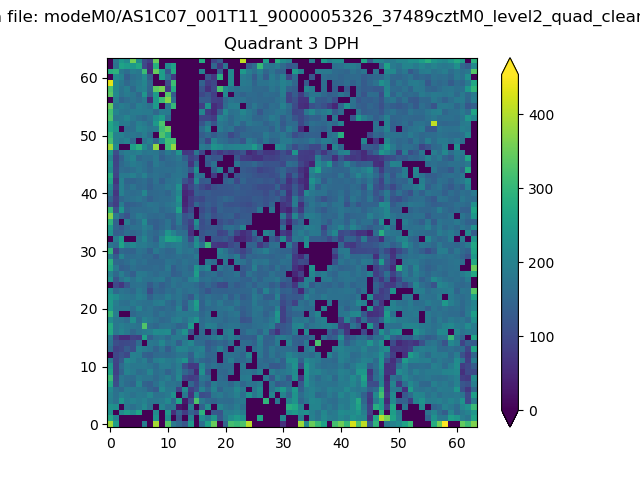 |
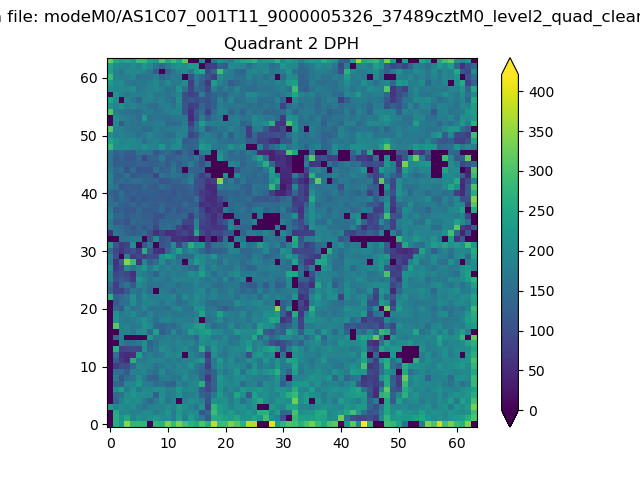 |
Quadrant C |
| Plot type | Count rate plots | Images |
|---|---|---|
| Comparison with Poisson distribution Blue bars denote a histogram of data divided into 1 sec bins. Red curve is a Poisson curve with rate = median count rate of data. |
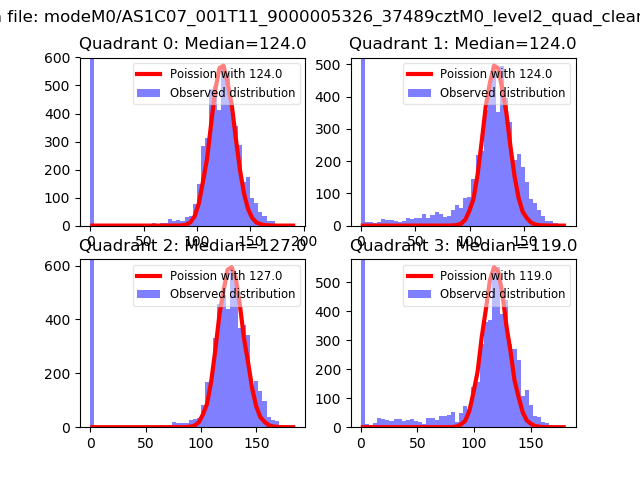 |
 |
| Quadrant-wise count rates Data is divided into 100 sec bins |
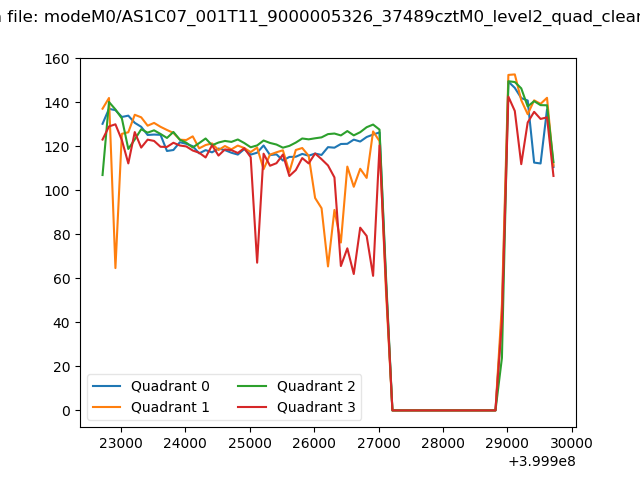 |
|
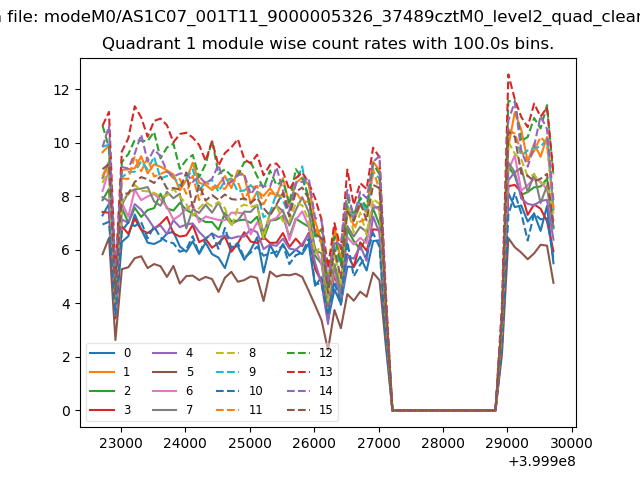
| Module-wise count rates for Quadrant A Data is divided into 100 sec bins |
 |
 |
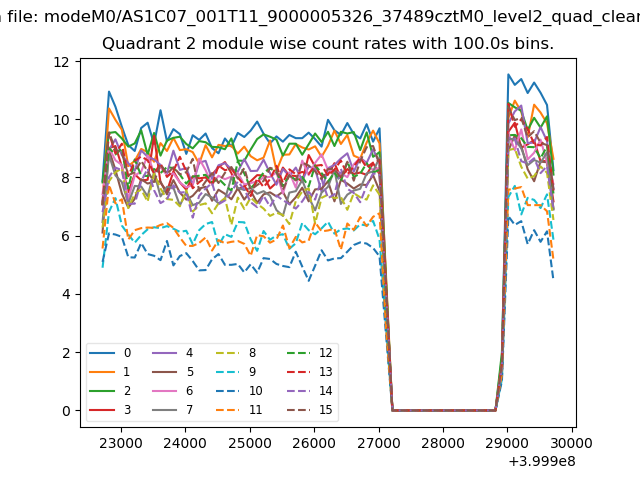
| Module-wise count rates for Quadrant B Data is divided into 100 sec bins |
 |
 |
| Module-wise count rates for Quadrant C Data is divided into 100 sec bins |
 |
 |
| Module-wise count rates for Quadrant D Data is divided into 100 sec bins |
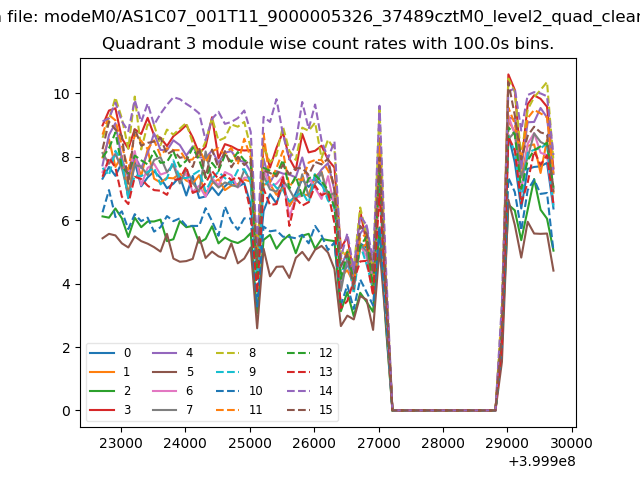 |
 |
| Parameter | Plot |
|---|---|
| CZT HV Monitor | 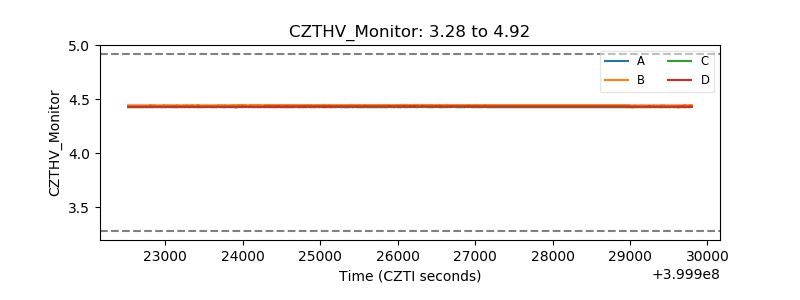 |
| D_VDD | 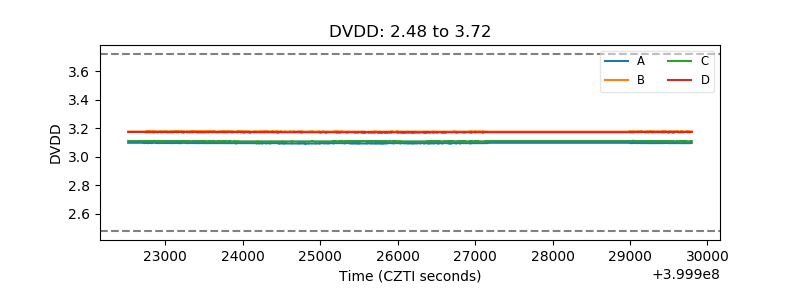 |
| Temperature 1 | 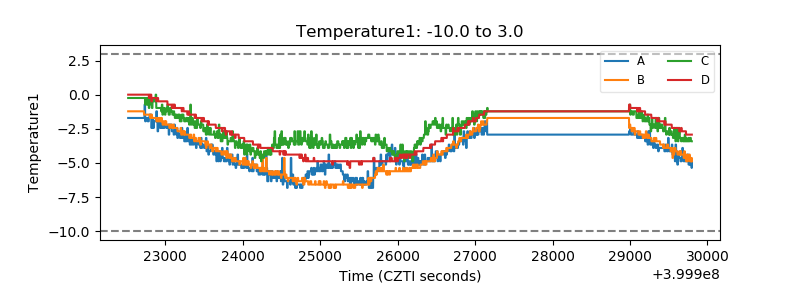 |
| Veto HV Monitor | 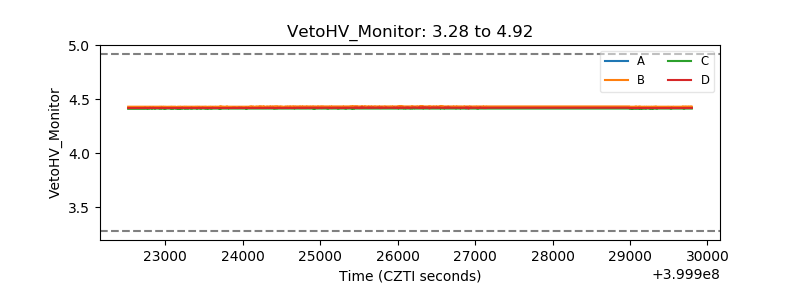 |
| Veto LLD | 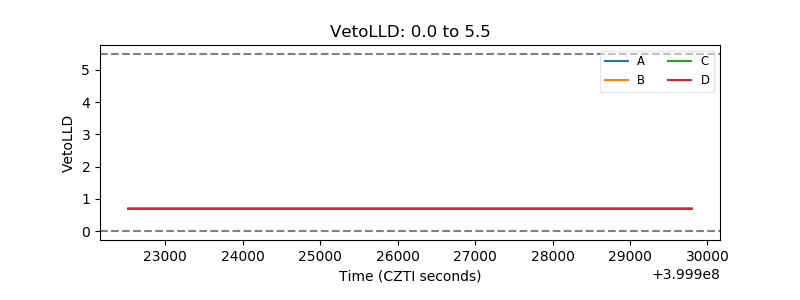 |
| Alpha Counter | 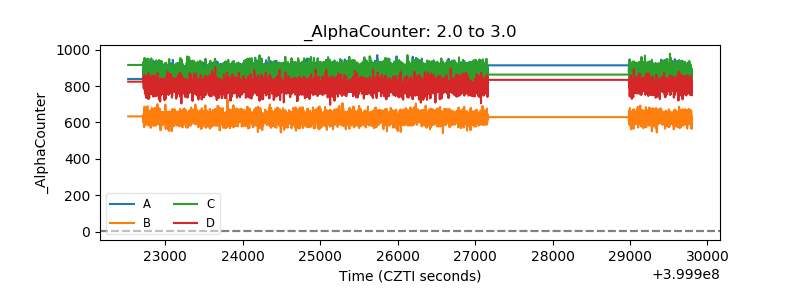 |
| _CPM_Rate | 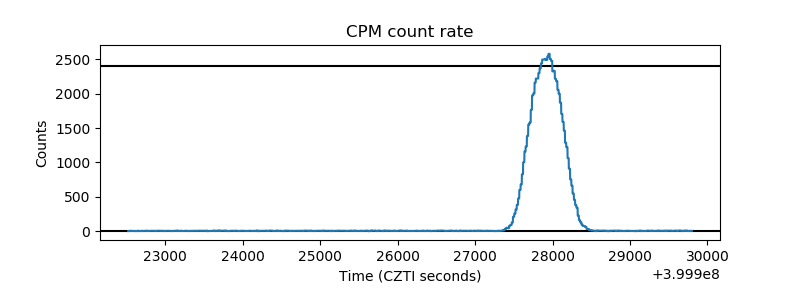 |
| CZT Counter | 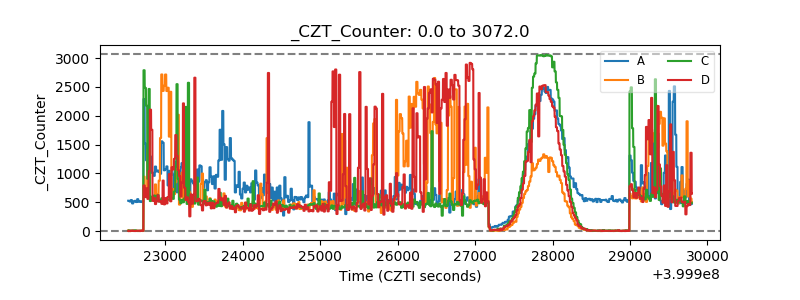 |
| +2.5 Volts monitor | 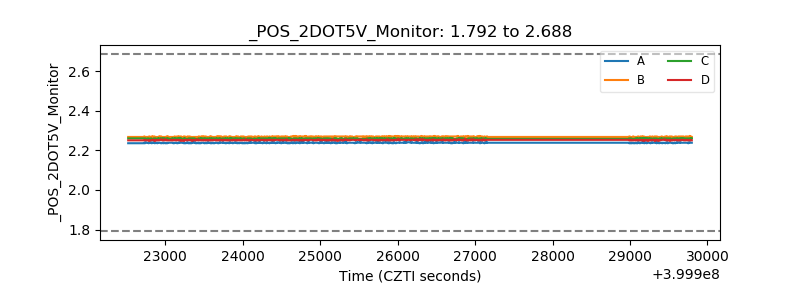 |
| +5 Volts monitor | 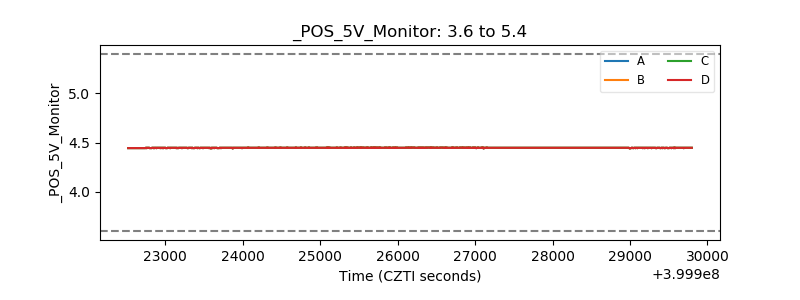 |
| _ROLL_ROT | 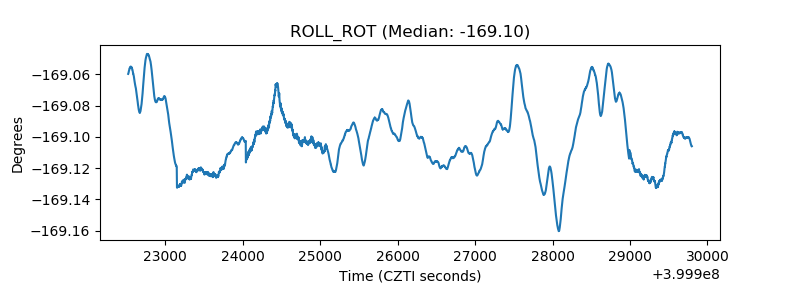 |
| _Roll_DEC | 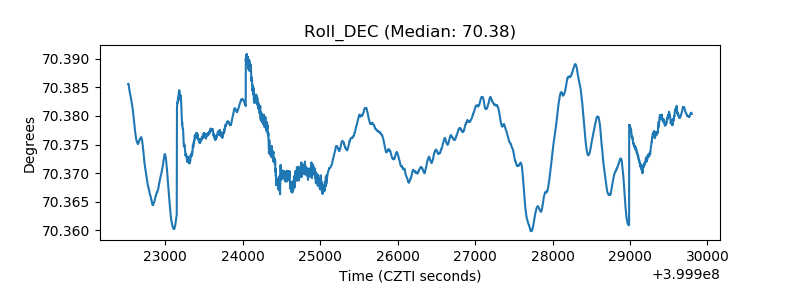 |
| _Roll_RA | 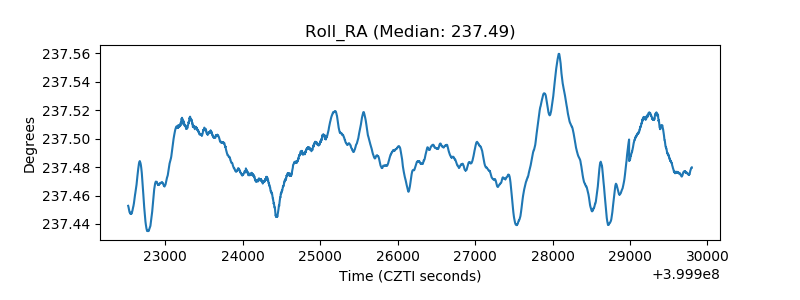 |
| Veto Counter | 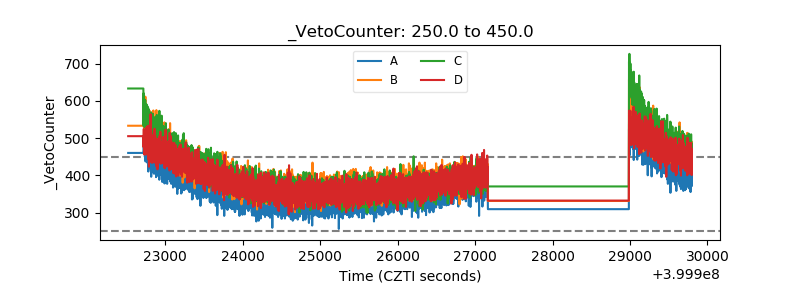 |