| Param | Original file | Final file |
|---|---|---|
| Filename | modeM0/AS1C07_001T11_9000005326_37490cztM0_level2.evt | modeM0/AS1C07_001T11_9000005326_37490cztM0_level2_quad_clean.evt |
| Size (bytes) | 449,979,840 | 96,647,040 |
| Size | 429.1 MB | 92.2 MB |
| Events in quadrant A | 3,106,620 | 645,220 |
| Events in quadrant B | 2,974,935 | 669,299 |
| Events in quadrant C | 2,863,124 | 664,777 |
| Events in quadrant D | 4,342,979 | 596,210 |
| Mode M0 | |||
|---|---|---|---|
| Quadrant | BADHDUFLAG | Total packets | Discarded packets |
| A | 0 | 12541 | 3 |
| B | 0 | 12224 | 2 |
| C | 0 | 11654 | 2 |
| D | 0 | 16385 | 2 |
| Mode M9 | |||
|---|---|---|---|
| Quadrant | BADHDUFLAG | Total packets | Discarded packets |
| A | 0 | 26 | 0 |
| B | 0 | 26 | 0 |
| C | 0 | 26 | 0 |
| D | 0 | 27 | 0 |
| Mode SS | |||
|---|---|---|---|
| Quadrant | BADHDUFLAG | Total packets | Discarded packets |
| A | 0 | 102 | 0 |
| B | 0 | 102 | 0 |
| C | 0 | 102 | 0 |
| D | 0 | 102 | 0 |
| Quadrant | Total seconds | Saturated seconds | Saturation percentage |
|---|---|---|---|
| A | 5010 | 111 | 2.215569% |
| B | 5010 | 89 | 1.776447% |
| C | 5010 | 113 | 2.255489% |
| D | 5010 | 626 | 12.495010% |
Noise dominated data is calculated using 1-second bins in cleaned event files. If a bin has >2000 counts, and if more than 50% of those come from <1% of pixels, then it is considered to be noise-dominated and hence unusable.
| Quadrant | # 1 sec bins | Bins with >0 counts | Bins with >2000 counts | High rate bins dominated by noise | Noise dominated (total time) | Noise dominated (detector-on time) | Marked lightcurve |
|---|---|---|---|---|---|---|---|
| A | 6952 | 5011 | 103 | 103 | 1.48% | 2.06% | 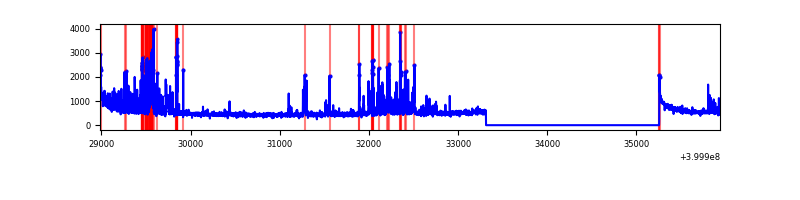 |
| B | 6952 | 5011 | 65 | 65 | 0.93% | 1.30% | 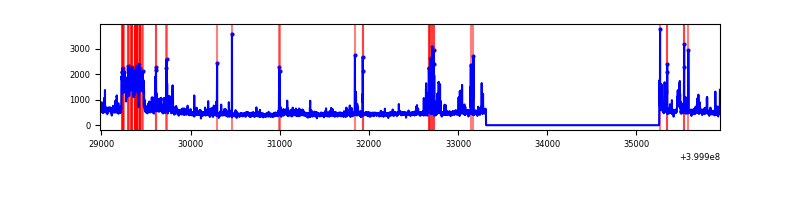 |
| C | 6952 | 5011 | 101 | 101 | 1.45% | 2.02% | 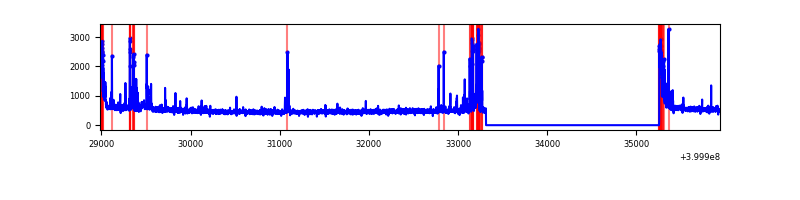 |
| D | 6952 | 5011 | 557 | 557 | 8.01% | 11.12% | 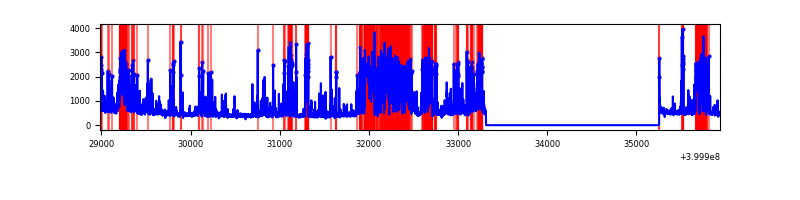 |
Top three noisy pixels from each quadrant. If the there are fewer than three noisy pixels in the level2.evt file, extra rows are filled as -1
| Pixel properties | Quadrant properties | ||||||
|---|---|---|---|---|---|---|---|
| Quadrant | DetID | PixID | Counts | Sigma | Mean | Median | Sigma |
| A | 13 | 248 | 297744 | 2640.1 | 561 | 549 | 112.6 |
| A | 10 | 83 | 284652 | 2523.8 | 561 | 549 | 112.6 |
| A | 7 | 3 | 169520 | 1501.03 | 561 | 549 | 112.6 |
| B | 15 | 35 | 378431 | 3507.48 | 573 | 560 | 107.7 |
| B | 5 | 172 | 182637 | 1690.08 | 573 | 560 | 107.7 |
| B | 5 | 255 | 36629 | 334.8 | 573 | 560 | 107.7 |
| C | 14 | 254 | 216411 | 1662.42 | 562 | 567 | 129.8 |
| C | 15 | 214 | 212089 | 1629.13 | 562 | 567 | 129.8 |
| C | 0 | 10 | 172054 | 1320.78 | 562 | 567 | 129.8 |
| D | 13 | 249 | 1544243 | 12059.81 | 529 | 513 | 128.0 |
| D | 2 | 250 | 216221 | 1685.13 | 529 | 513 | 128.0 |
| D | 2 | 249 | 156346 | 1217.38 | 529 | 513 | 128.0 |
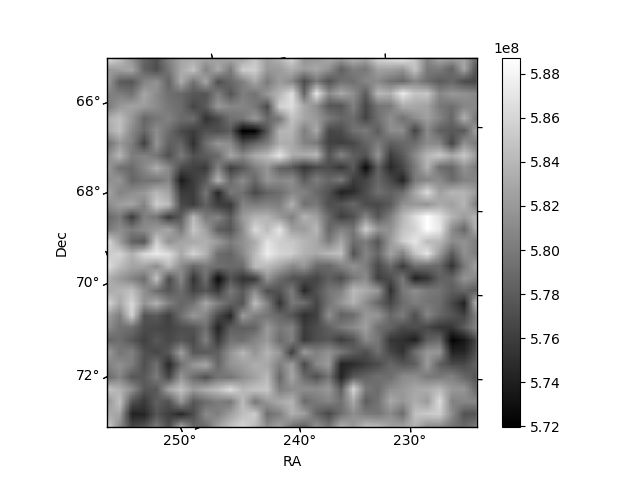
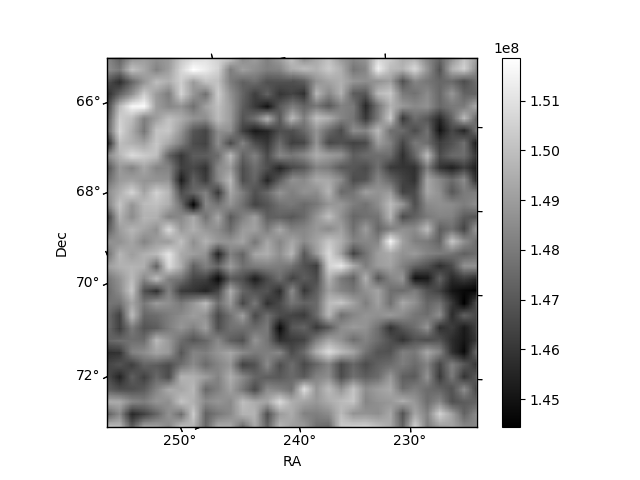
Histogram calculated using DETX and DETY for each event in the final _common_clean file
| Quadrant A | 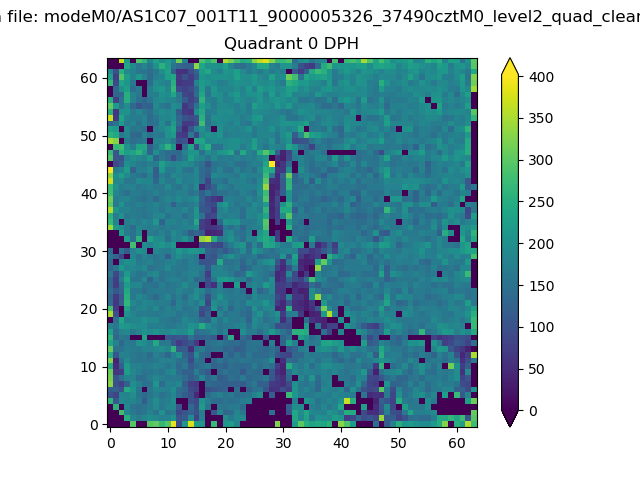 |
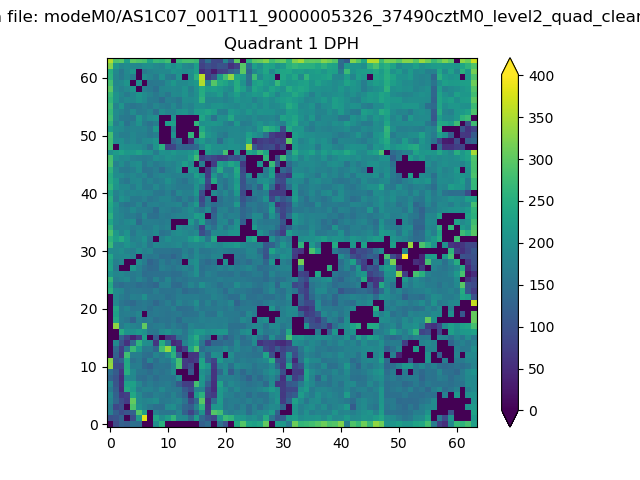 |
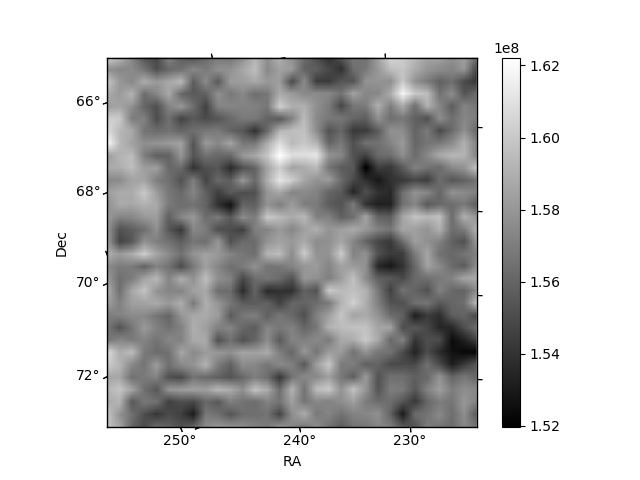
Quadrant B |
|---|---|---|---|
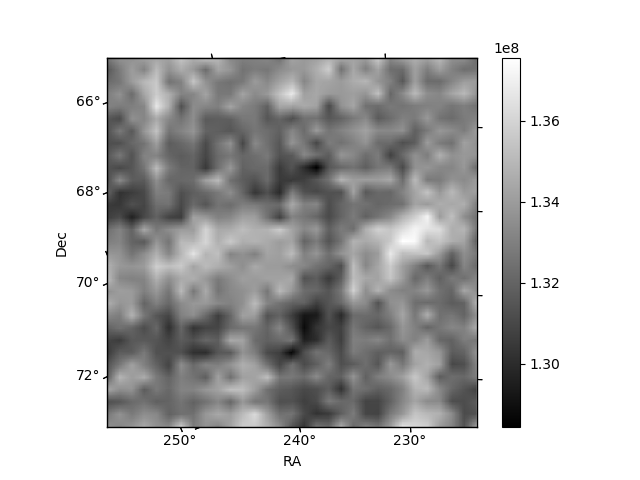
| Quadrant D | 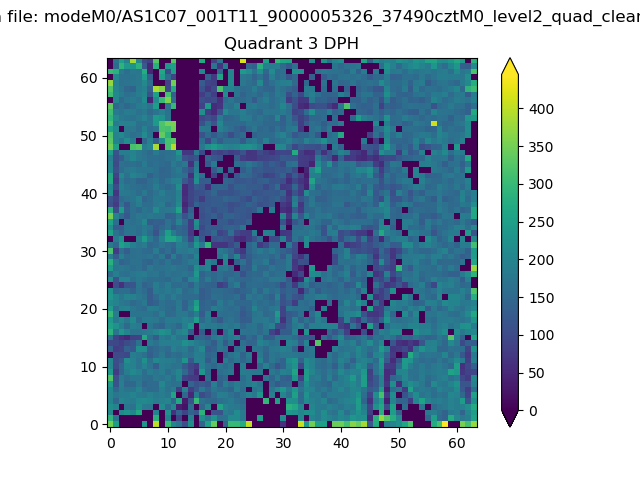 |
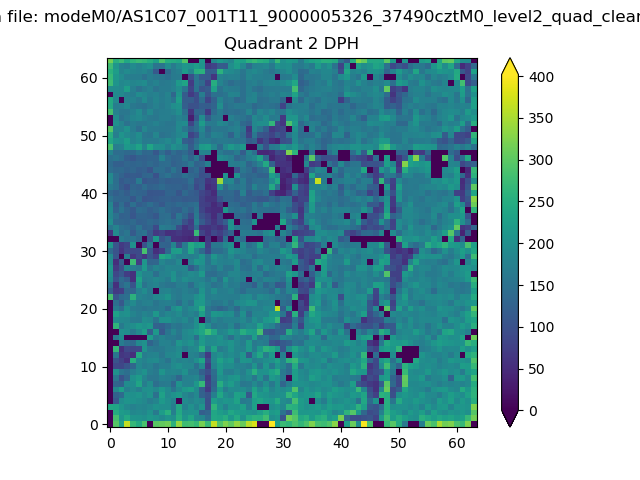 |
Quadrant C |
| Plot type | Count rate plots | Images |
|---|---|---|
| Comparison with Poisson distribution Blue bars denote a histogram of data divided into 1 sec bins. Red curve is a Poisson curve with rate = median count rate of data. |
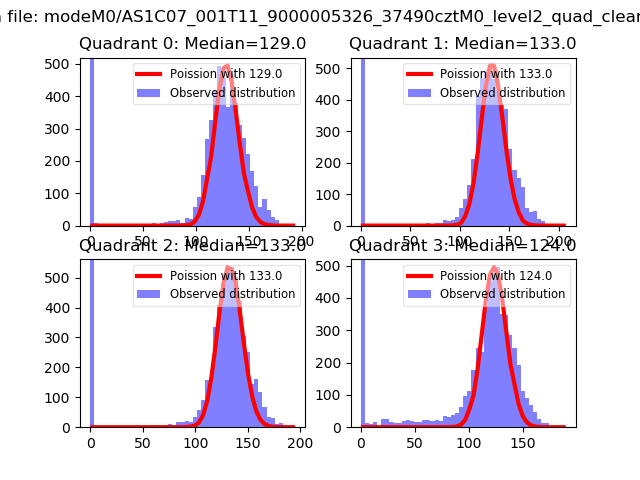 |
 |
| Quadrant-wise count rates Data is divided into 100 sec bins |
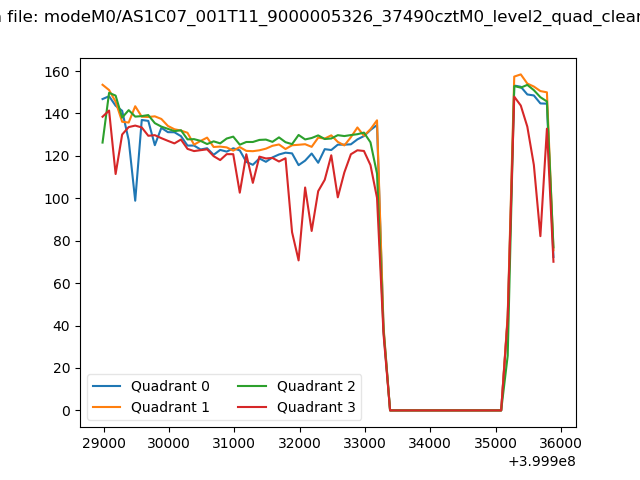 |
|
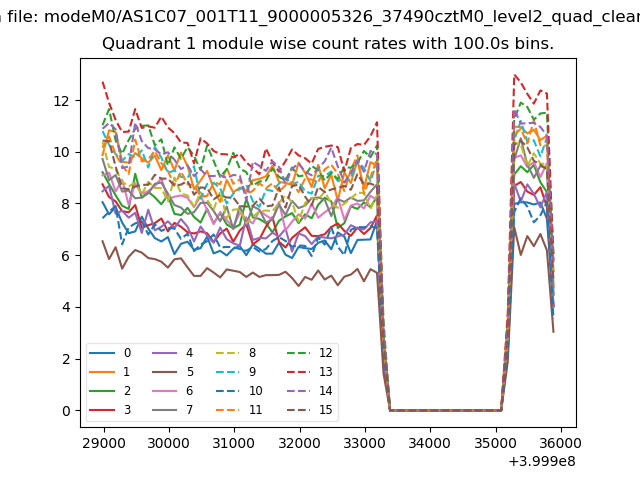
| Module-wise count rates for Quadrant A Data is divided into 100 sec bins |
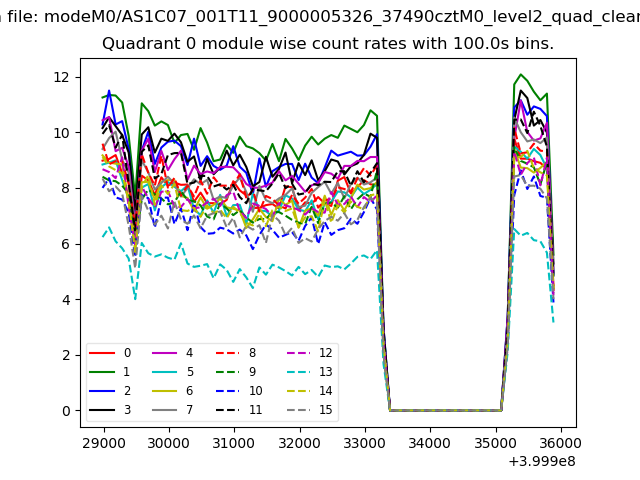 |
 |
| Module-wise count rates for Quadrant B Data is divided into 100 sec bins |
 |
 |
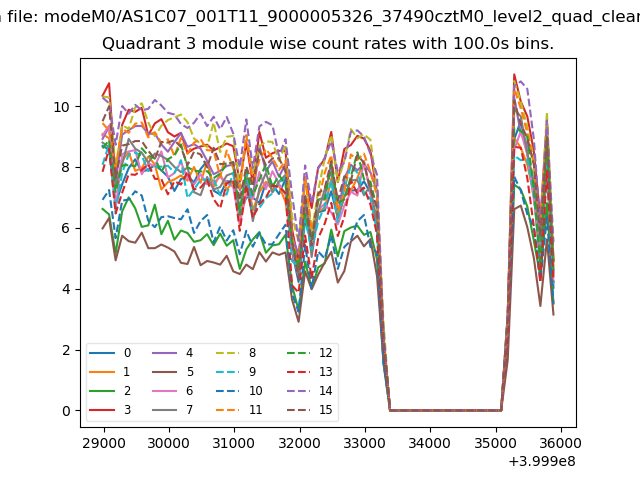
| Module-wise count rates for Quadrant C Data is divided into 100 sec bins |
 |
 |
| Module-wise count rates for Quadrant D Data is divided into 100 sec bins |
 |
 |
| Parameter | Plot |
|---|---|
| CZT HV Monitor | 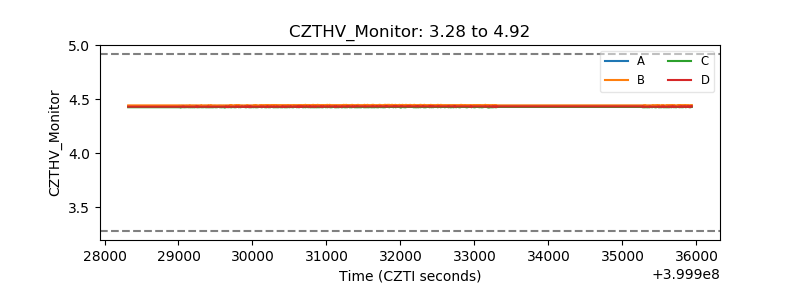 |
| D_VDD | 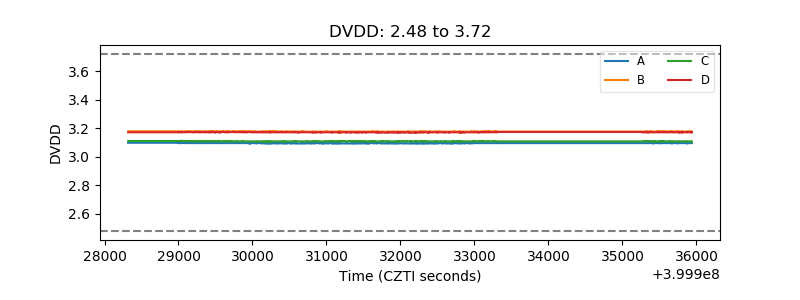 |
| Temperature 1 | 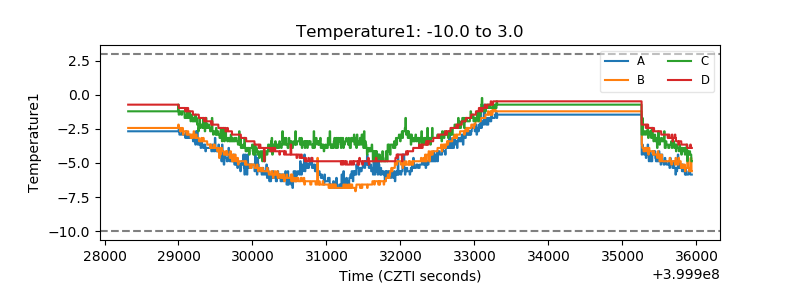 |
| Veto HV Monitor | 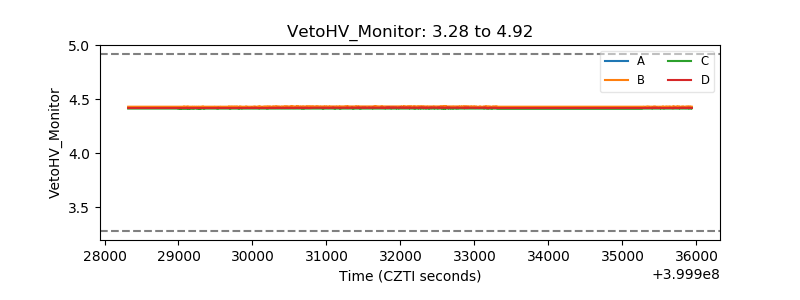 |
| Veto LLD | 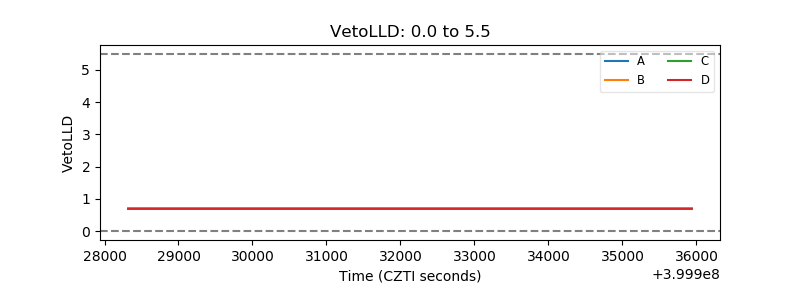 |
| Alpha Counter | 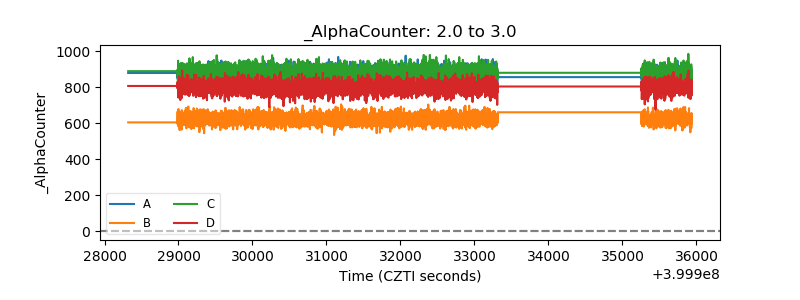 |
| _CPM_Rate | 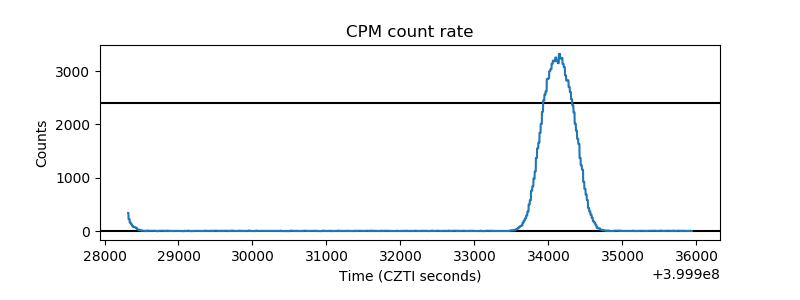 |
| CZT Counter | 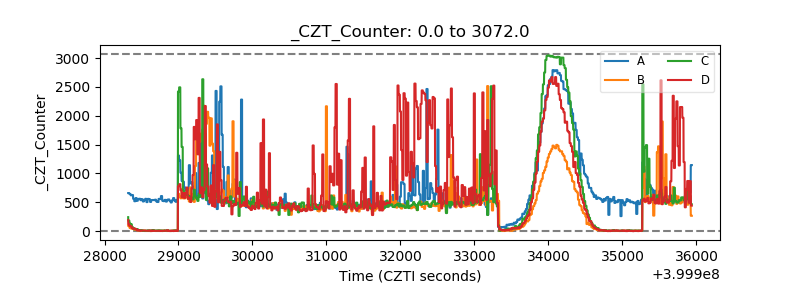 |
| +2.5 Volts monitor | 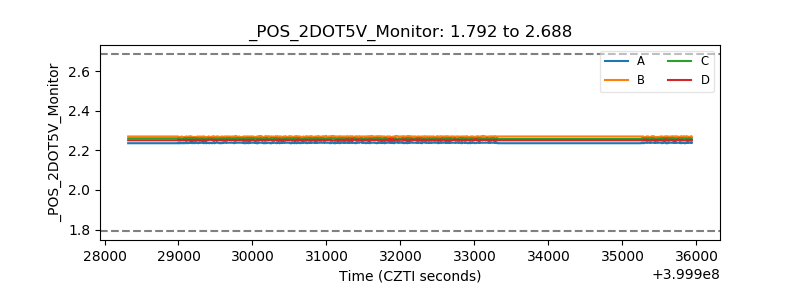 |
| +5 Volts monitor | 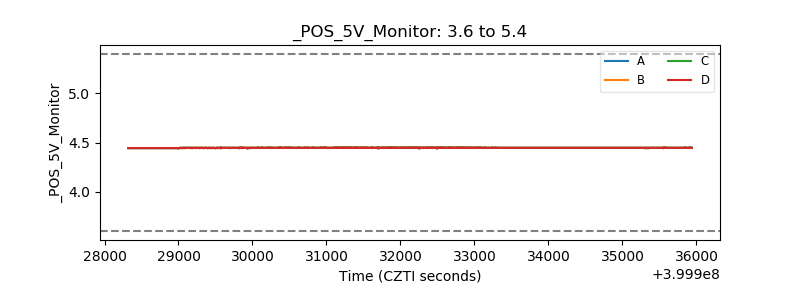 |
| _ROLL_ROT | 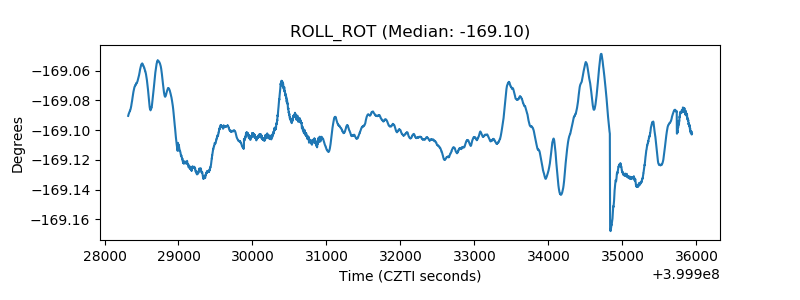 |
| _Roll_DEC | 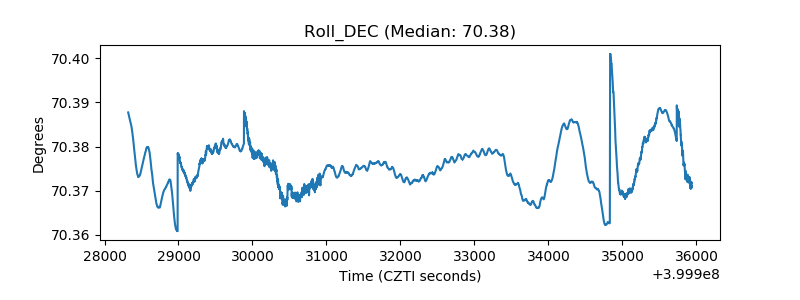 |
| _Roll_RA | 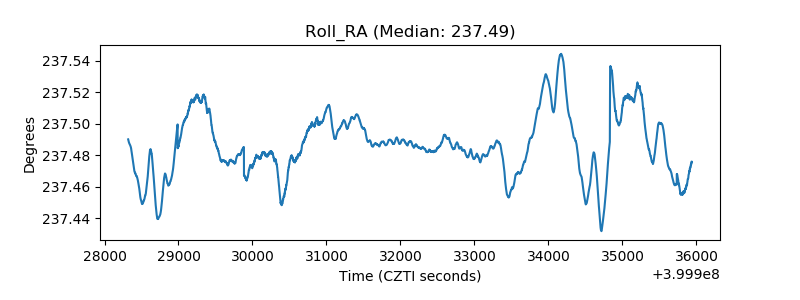 |
| Veto Counter | 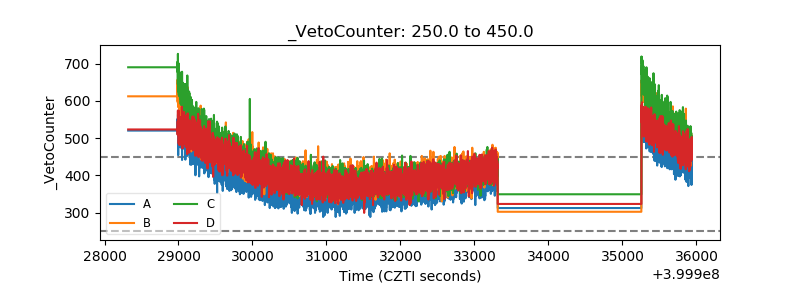 |