| Param | Original file | Final file |
|---|---|---|
| Filename | modeM0/AS1C07_001T11_9000005326_37491cztM0_level2.evt | modeM0/AS1C07_001T11_9000005326_37491cztM0_level2_quad_clean.evt |
| Size (bytes) | 606,061,440 | 89,006,400 |
| Size | 578.0 MB | 84.9 MB |
| Events in quadrant A | 8,207,505 | 421,585 |
| Events in quadrant B | 2,600,555 | 676,406 |
| Events in quadrant C | 2,845,184 | 666,827 |
| Events in quadrant D | 4,369,222 | 585,509 |
| Mode M0 | |||
|---|---|---|---|
| Quadrant | BADHDUFLAG | Total packets | Discarded packets |
| A | 0 | 27593 | 3 |
| B | 0 | 10938 | 2 |
| C | 0 | 11342 | 2 |
| D | 0 | 16240 | 2 |
| Mode M9 | |||
|---|---|---|---|
| Quadrant | BADHDUFLAG | Total packets | Discarded packets |
| A | 0 | 31 | 0 |
| B | 0 | 31 | 0 |
| C | 0 | 31 | 0 |
| D | 0 | 32 | 0 |
| Mode SS | |||
|---|---|---|---|
| Quadrant | BADHDUFLAG | Total packets | Discarded packets |
| A | 0 | 100 | 0 |
| B | 0 | 100 | 0 |
| C | 0 | 100 | 0 |
| D | 0 | 100 | 0 |
| Quadrant | Total seconds | Saturated seconds | Saturation percentage |
|---|---|---|---|
| A | 4900 | 2658 | 54.244898% |
| B | 4900 | 64 | 1.306122% |
| C | 4900 | 100 | 2.040816% |
| D | 4900 | 646 | 13.183673% |
Noise dominated data is calculated using 1-second bins in cleaned event files. If a bin has >2000 counts, and if more than 50% of those come from <1% of pixels, then it is considered to be noise-dominated and hence unusable.
| Quadrant | # 1 sec bins | Bins with >0 counts | Bins with >2000 counts | High rate bins dominated by noise | Noise dominated (total time) | Noise dominated (detector-on time) | Marked lightcurve |
|---|---|---|---|---|---|---|---|
| A | 6963 | 4901 | 2600 | 2600 | 37.34% | 53.05% | 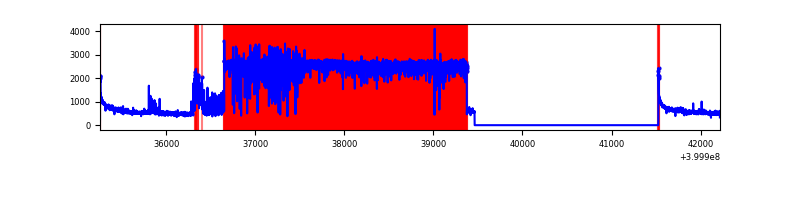 |
| B | 6963 | 4901 | 48 | 48 | 0.69% | 0.98% | 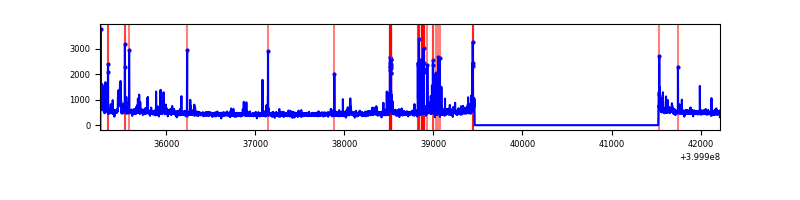 |
| C | 6963 | 4901 | 86 | 86 | 1.24% | 1.75% | 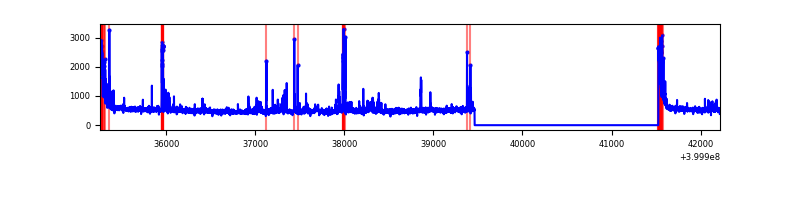 |
| D | 6963 | 4901 | 601 | 601 | 8.63% | 12.26% | 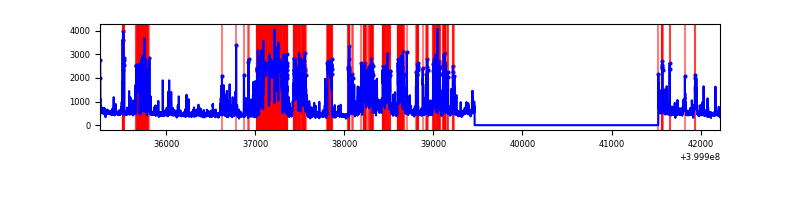 |
Top three noisy pixels from each quadrant. If the there are fewer than three noisy pixels in the level2.evt file, extra rows are filled as -1
| Pixel properties | Quadrant properties | ||||||
|---|---|---|---|---|---|---|---|
| Quadrant | DetID | PixID | Counts | Sigma | Mean | Median | Sigma |
| A | 15 | 222 | 6432395 | 84518.9 | 379 | 371 | 76.1 |
| A | 10 | 83 | 230549 | 3024.61 | 379 | 371 | 76.1 |
| A | 12 | 189 | 27476 | 356.17 | 379 | 371 | 76.1 |
| B | 5 | 172 | 215831 | 2052.29 | 565 | 552 | 104.9 |
| B | 5 | 255 | 30173 | 282.38 | 565 | 552 | 104.9 |
| B | 15 | 35 | 24964 | 232.72 | 565 | 552 | 104.9 |
| C | 15 | 214 | 208074 | 1631.02 | 554 | 560 | 127.2 |
| C | 0 | 10 | 194434 | 1523.82 | 554 | 560 | 127.2 |
| C | 14 | 254 | 135688 | 1062.08 | 554 | 560 | 127.2 |
| D | 13 | 249 | 1212293 | 9672.72 | 514 | 500 | 125.3 |
| D | 2 | 249 | 883756 | 7050.29 | 514 | 500 | 125.3 |
| D | 4 | 239 | 91361 | 725.27 | 514 | 500 | 125.3 |
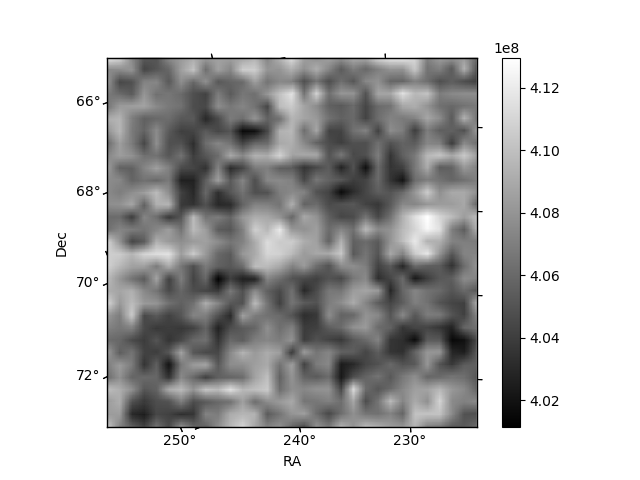
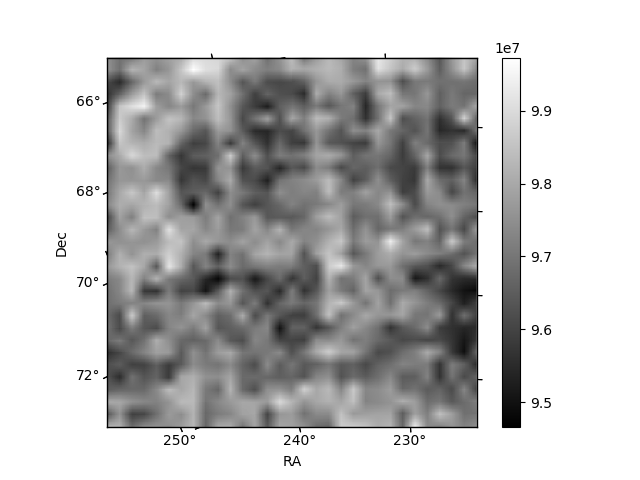
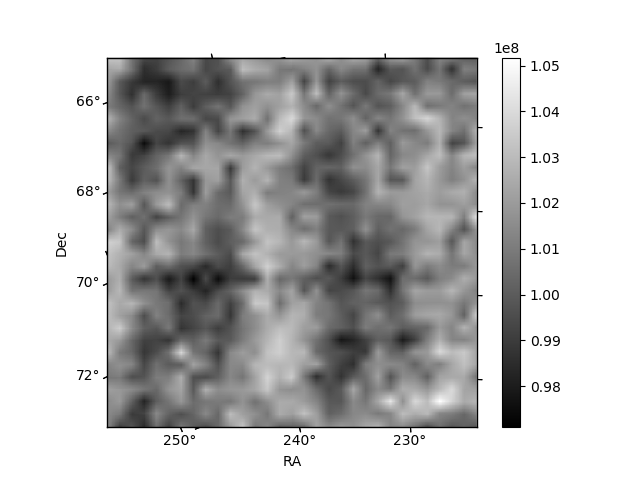
Histogram calculated using DETX and DETY for each event in the final _common_clean file
| Quadrant A | 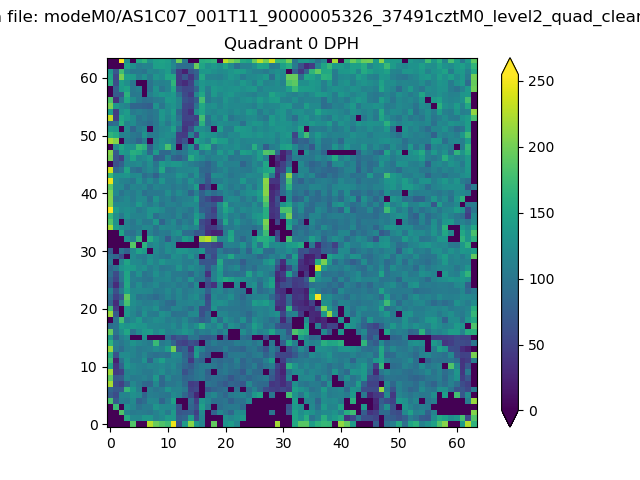 |
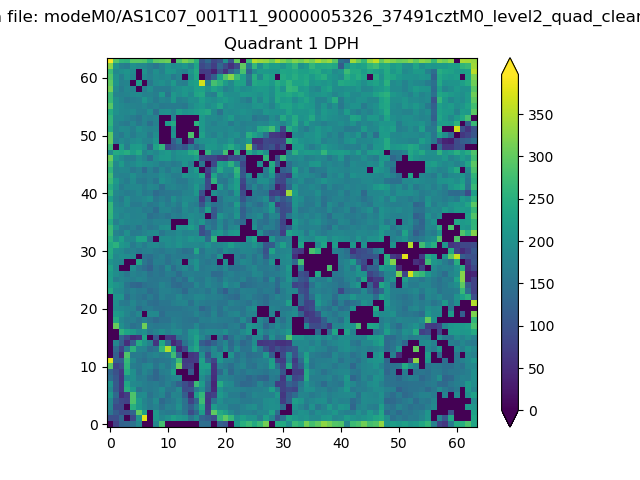 |
Quadrant B |
|---|---|---|---|
| Quadrant D | 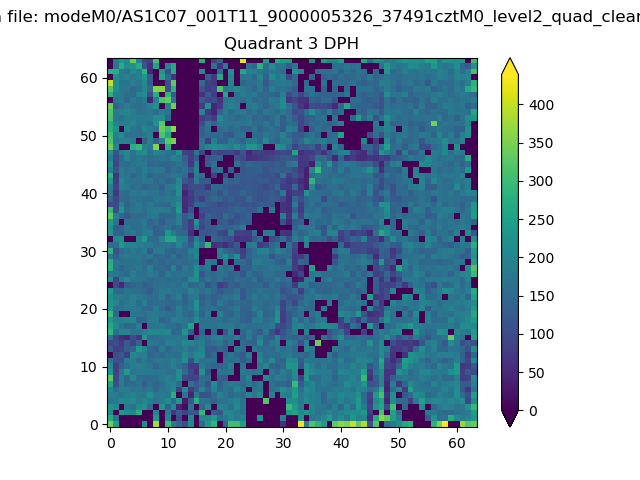 |
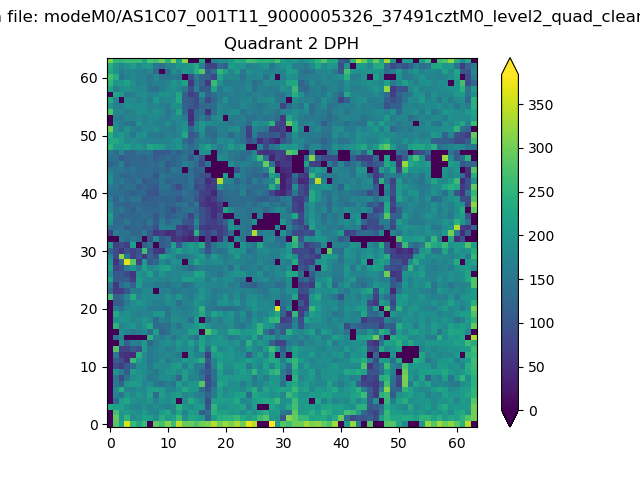 |
Quadrant C |
| Plot type | Count rate plots | Images |
|---|---|---|
| Comparison with Poisson distribution Blue bars denote a histogram of data divided into 1 sec bins. Red curve is a Poisson curve with rate = median count rate of data. |
 |
 |
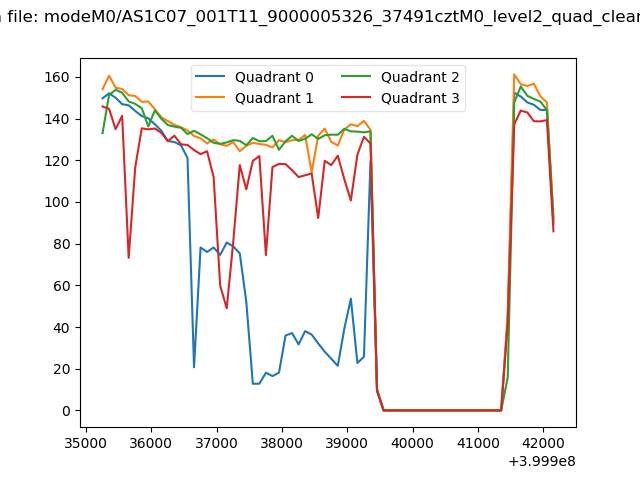
| Quadrant-wise count rates Data is divided into 100 sec bins |
 |
|
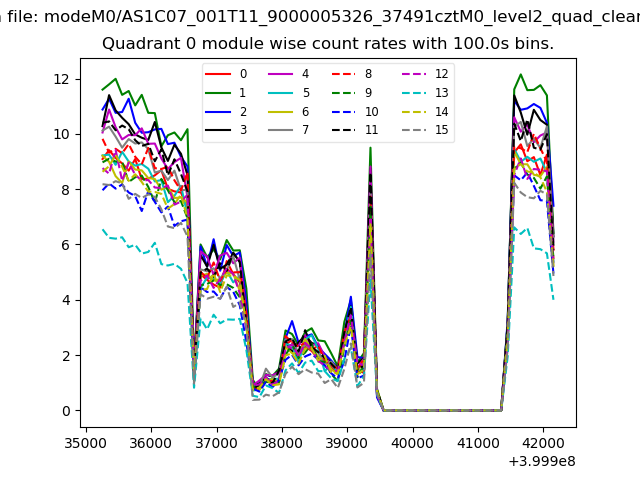
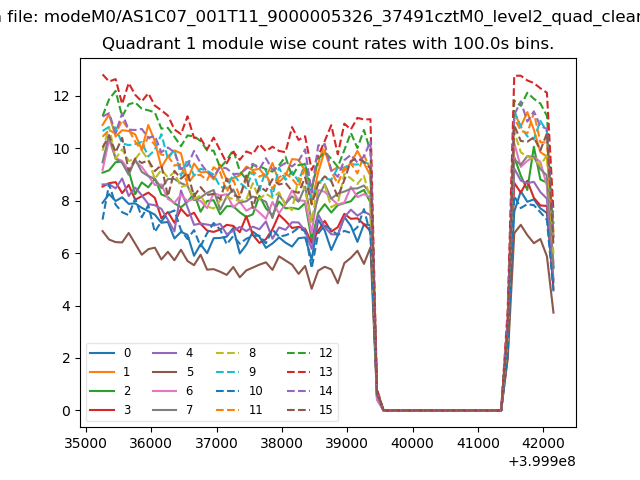
| Module-wise count rates for Quadrant A Data is divided into 100 sec bins |
 |
 |
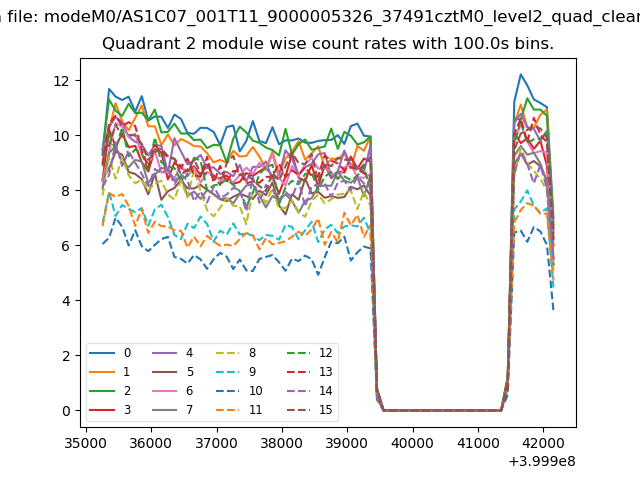
| Module-wise count rates for Quadrant B Data is divided into 100 sec bins |
 |
 |
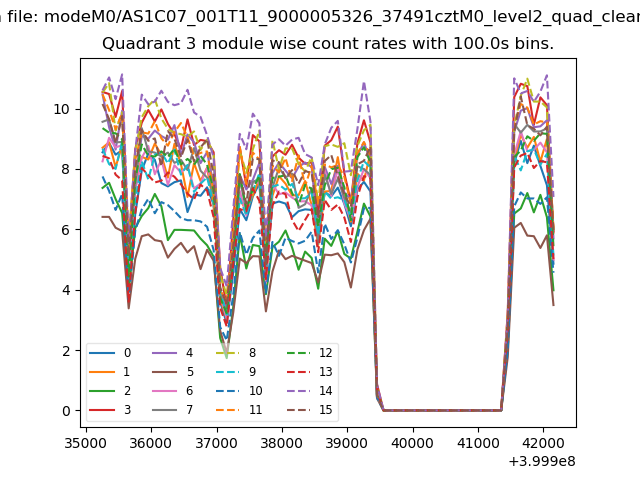
| Module-wise count rates for Quadrant C Data is divided into 100 sec bins |
 |
 |
| Module-wise count rates for Quadrant D Data is divided into 100 sec bins |
 |
 |
| Parameter | Plot |
|---|---|
| CZT HV Monitor | 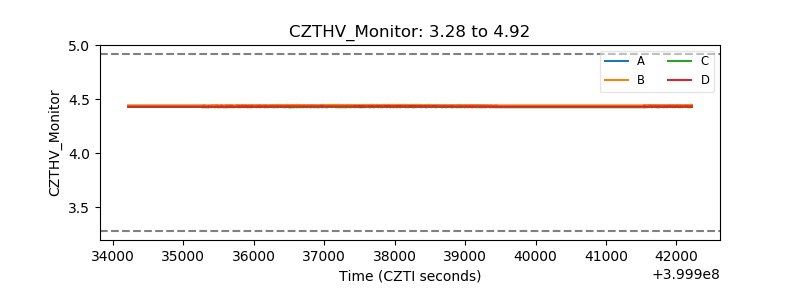 |
| D_VDD | 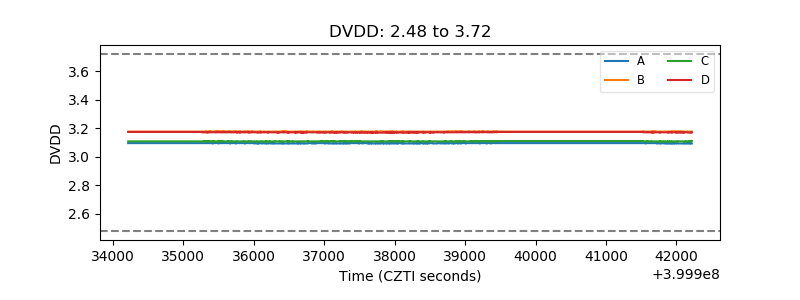 |
| Temperature 1 | 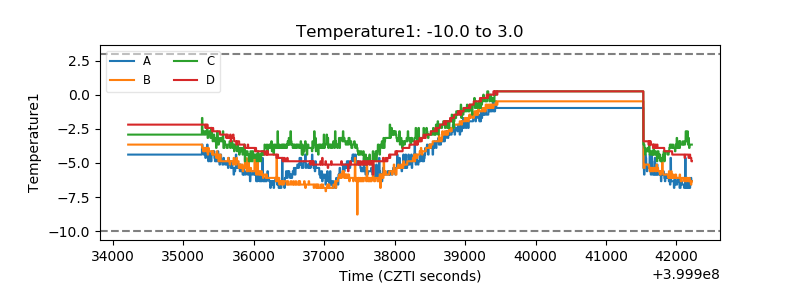 |
| Veto HV Monitor | 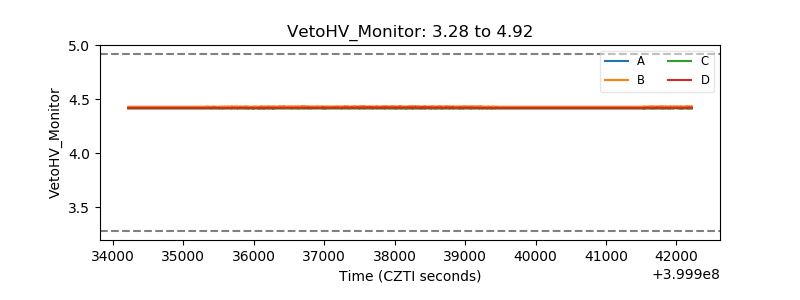 |
| Veto LLD | 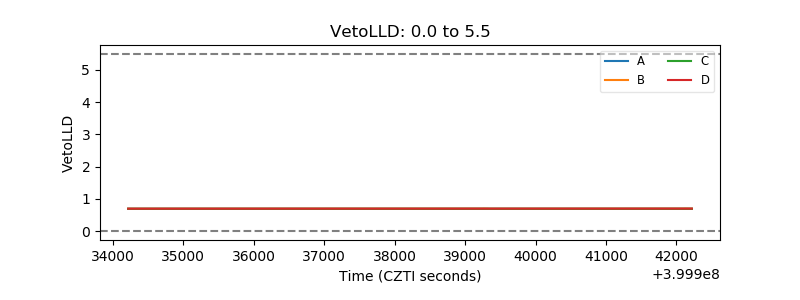 |
| Alpha Counter | 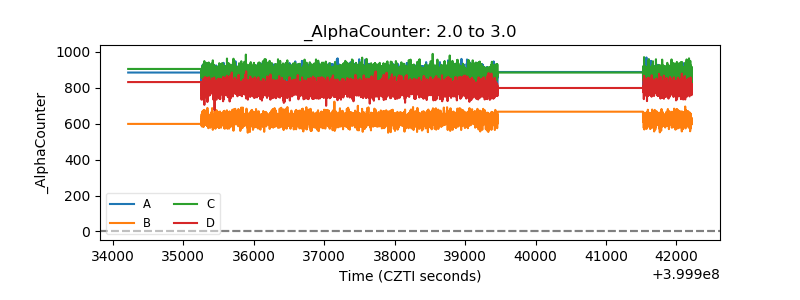 |
| _CPM_Rate |  |
| CZT Counter | 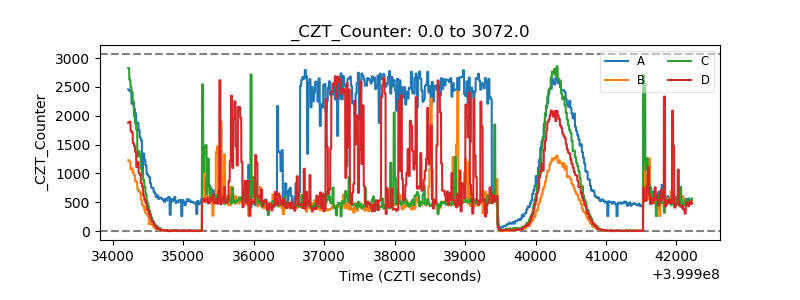 |
| +2.5 Volts monitor | 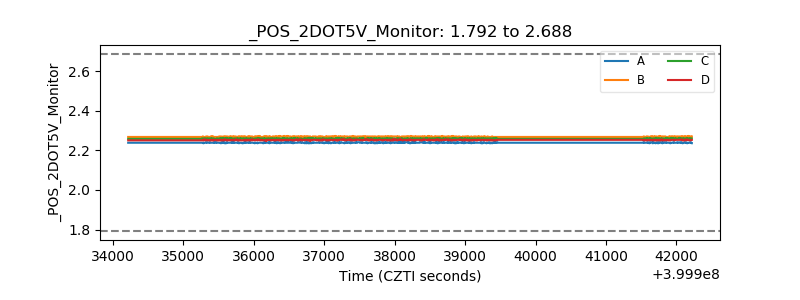 |
| +5 Volts monitor | 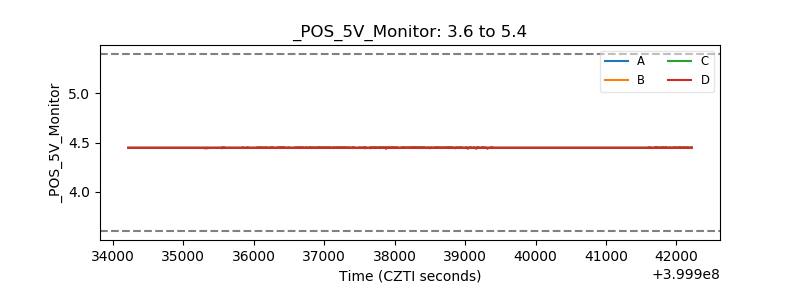 |
| _ROLL_ROT | 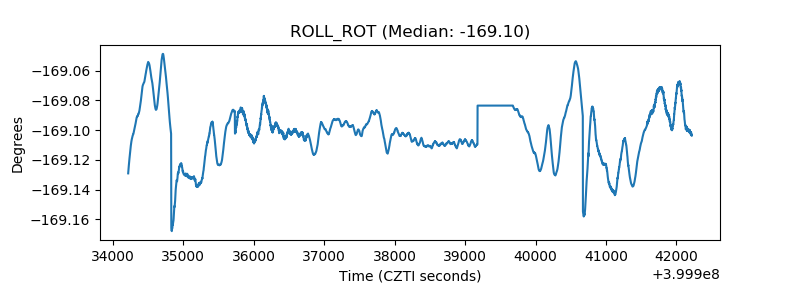 |
| _Roll_DEC | 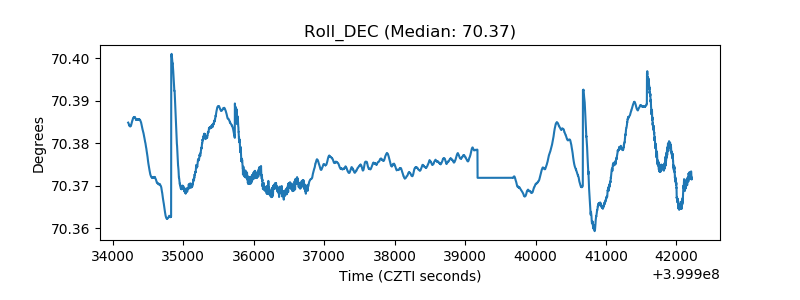 |
| _Roll_RA | 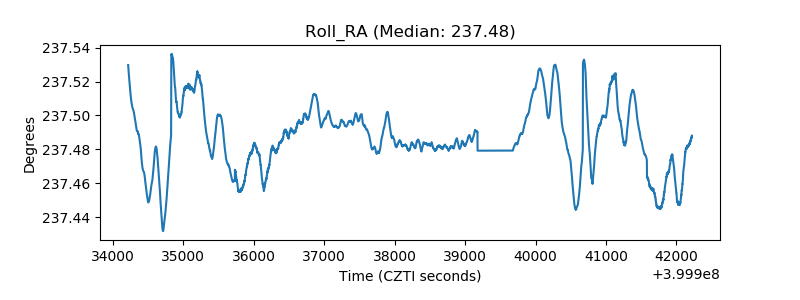 |
| Veto Counter | 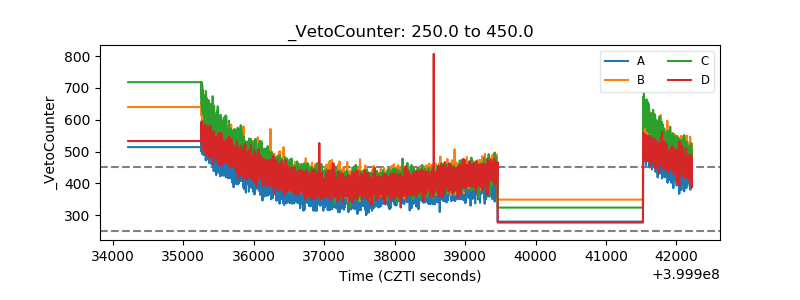 |