| Param | Original file | Final file |
|---|---|---|
| Filename | modeM0/AS1A11_030T02_9000005328cztM0_level2.fits | modeM0/AS1A11_030T02_9000005328cztM0_level2_quad_clean.evt |
| Size (bytes) | 583,603,200 | 587,252,160 |
| Size | 556.6 MB | 560.0 MB |
| Events in quadrant A | 3,552,796 | 3,638,372 |
| Events in quadrant B | 3,368,801 | 3,509,356 |
| Events in quadrant C | 3,485,080 | 3,357,286 |
| Events in quadrant D | 2,941,546 | 2,956,804 |
| Mode M9 | |||
|---|---|---|---|
| Quadrant | BADHDUFLAG | Total packets | Discarded packets |
| A | 0 | 251 | 0 |
| B | 0 | 253 | 0 |
| C | 0 | 251 | 0 |
| D | 0 | 253 | 0 |
| Mode M0 | |||
|---|---|---|---|
| Quadrant | BADHDUFLAG | Total packets | Discarded packets |
| A | 0 | 140209 | 0 |
| B | 0 | 152060 | 0 |
| C | 0 | 143842 | 0 |
| D | 0 | 183583 | 0 |
| Mode SS | |||
|---|---|---|---|
| Quadrant | BADHDUFLAG | Total packets | Discarded packets |
| A | 0 | 1294 | 0 |
| B | 0 | 1302 | 0 |
| C | 0 | 1296 | 0 |
| D | 0 | 1293 | 0 |
| Quadrant | Total seconds | Saturated seconds | Saturation percentage |
|---|---|---|---|
| A | 63107 | 172 | 0.272553% |
| B | 62930 | 1991 | 3.163833% |
| C | 63022 | 1054 | 1.672432% |
| D | 62885 | 3366 | 5.352628% |
Noise dominated data is calculated using 1-second bins in cleaned event files. If a bin has >2000 counts, and if more than 50% of those come from <1% of pixels, then it is considered to be noise-dominated and hence unusable.
| Quadrant | # 1 sec bins | Bins with >0 counts | Bins with >2000 counts | High rate bins dominated by noise | Noise dominated (total time) | Noise dominated (detector-on time) | Marked lightcurve |
|---|---|---|---|---|---|---|---|
| A | 122308 | 64017 | 0 | 0 | 0.00% | 0.00% | 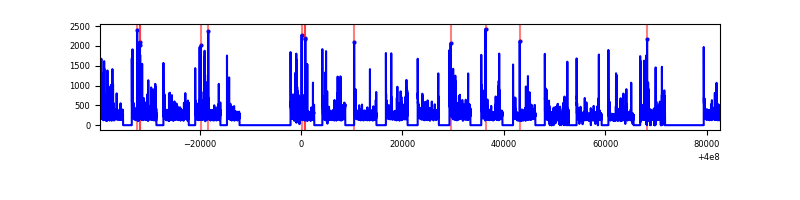 |
| B | 122307 | 63819 | 0 | 0 | 0.00% | 0.00% |  |
| C | 122308 | 63892 | 0 | 0 | 0.00% | 0.00% |  |
| D | 122308 | 63761 | 0 | 0 | 0.00% | 0.00% |  |
Top three noisy pixels from each quadrant. If the there are fewer than three noisy pixels in the level2.evt file, extra rows are filled as -1
| Pixel properties | Quadrant properties | ||||||
|---|---|---|---|---|---|---|---|
| Quadrant | DetID | PixID | Counts | Sigma | Mean | Median | Sigma |
| A | 7 | 110 | 2931 | 8.92 | 929 | 874 | 230.6 |
| A | 9 | 19 | 2908 | 8.82 | 929 | 874 | 230.6 |
| A | 0 | 29 | 2827 | 8.47 | 929 | 874 | 230.6 |
| B | 2 | 9 | 2900 | 11.83 | 892 | 850 | 173.3 |
| B | 3 | 80 | 2587 | 10.02 | 892 | 850 | 173.3 |
| B | 5 | 128 | 2390 | 8.89 | 892 | 850 | 173.3 |
| C | 1 | 81 | 2913 | 8.75 | 921 | 864 | 234.3 |
| C | 1 | 80 | 2858 | 8.51 | 921 | 864 | 234.3 |
| C | 3 | 203 | 2821 | 8.35 | 921 | 864 | 234.3 |
| D | 10 | 189 | 2272 | 6.73 | 841 | 770 | 223.1 |
| D | 7 | 3 | 2242 | 6.6 | 841 | 770 | 223.1 |
| D | 10 | 113 | 2120 | 6.05 | 841 | 770 | 223.1 |
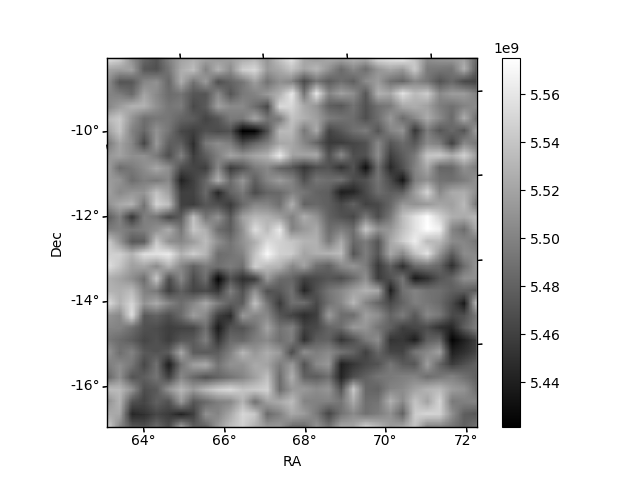
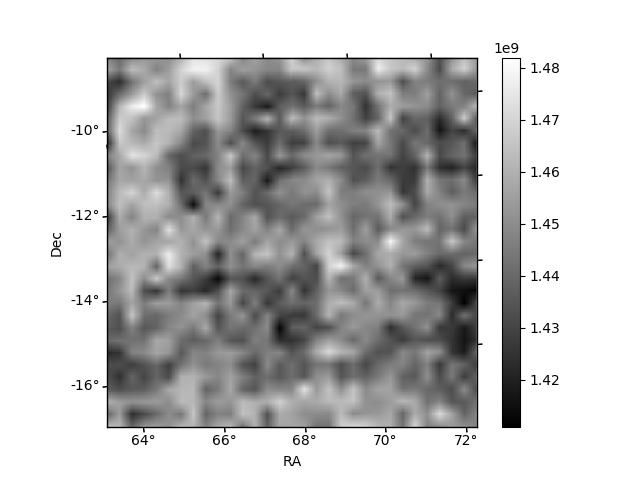
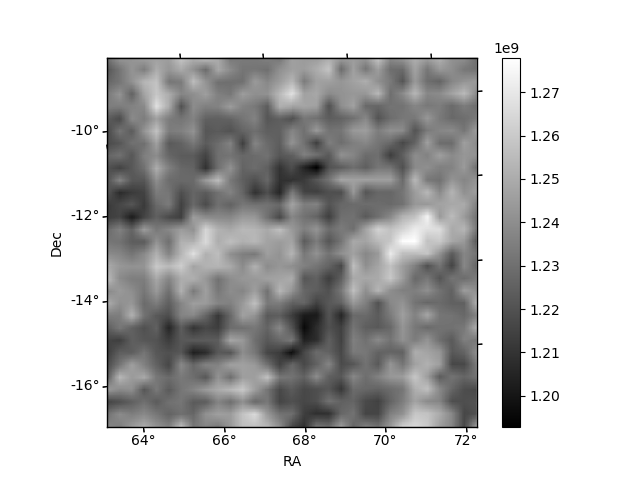
Histogram calculated using DETX and DETY for each event in the final _common_clean file
| Quadrant A | 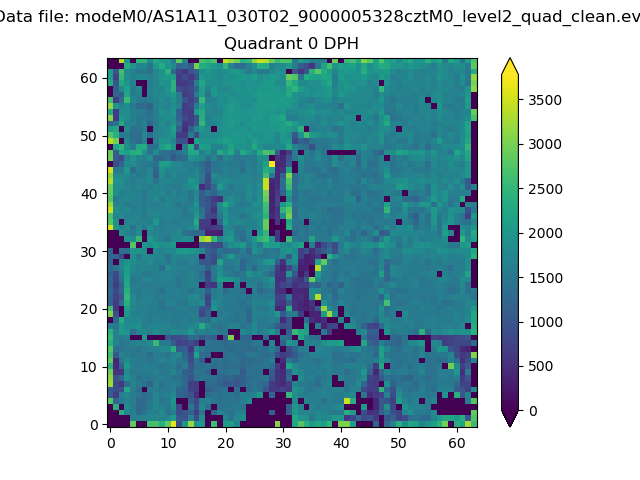 |
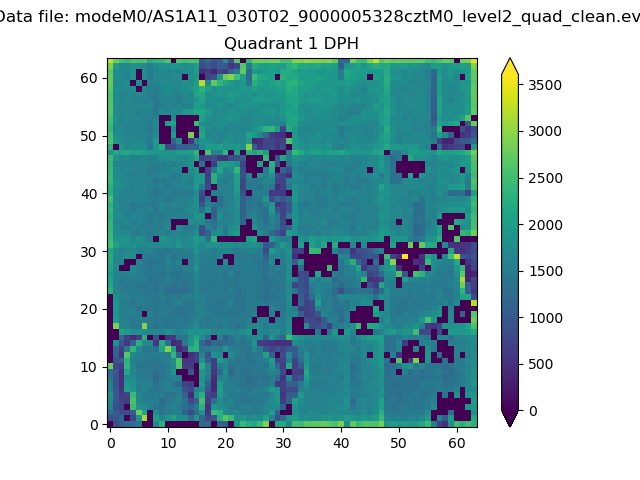 |
Quadrant B |
|---|---|---|---|
| Quadrant D | 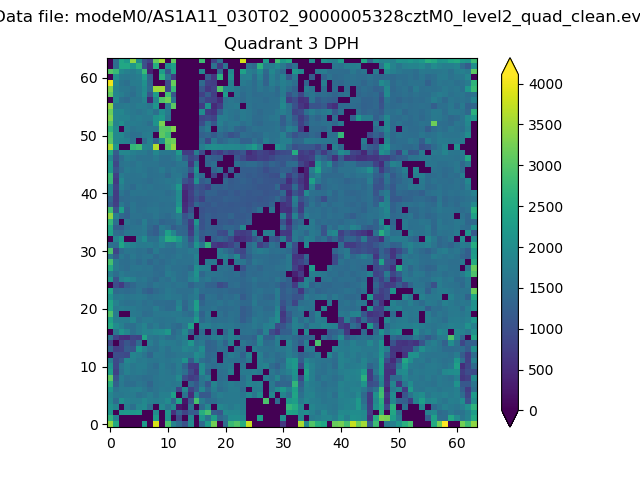 |
 |
Quadrant C |
| Plot type | Count rate plots | Images |
|---|---|---|
| Comparison with Poisson distribution Blue bars denote a histogram of data divided into 1 sec bins. Red curve is a Poisson curve with rate = median count rate of data. |
 |
 |
| Quadrant-wise count rates Data is divided into 100 sec bins |
 |
|
| Module-wise count rates for Quadrant A Data is divided into 100 sec bins |
 |
 |
| Module-wise count rates for Quadrant B Data is divided into 100 sec bins |
 |
 |
| Module-wise count rates for Quadrant C Data is divided into 100 sec bins |
 |
 |
| Module-wise count rates for Quadrant D Data is divided into 100 sec bins |
 |
 |
| Parameter | Plot |
|---|---|
| CZT HV Monitor | 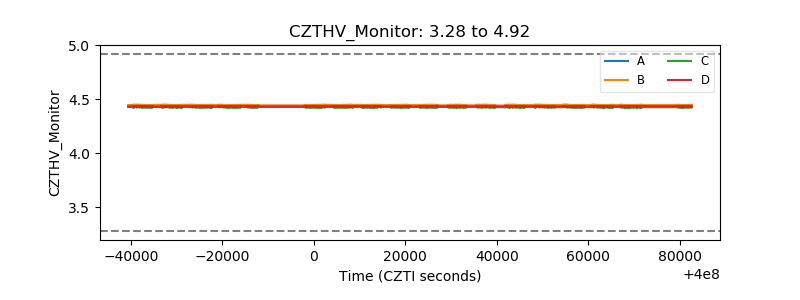 |
| D_VDD |  |
| Temperature 1 |  |
| Veto HV Monitor | 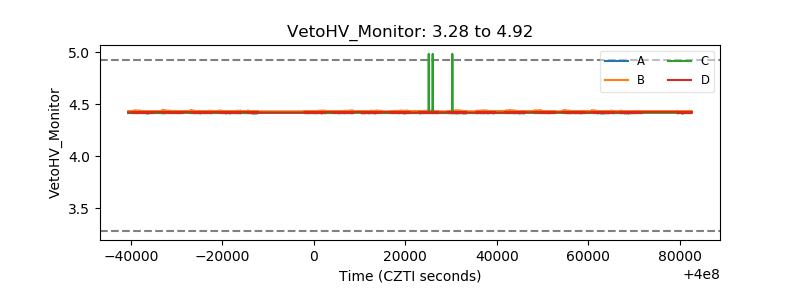 |
| Veto LLD |  |
| Alpha Counter |  |
| _CPM_Rate | 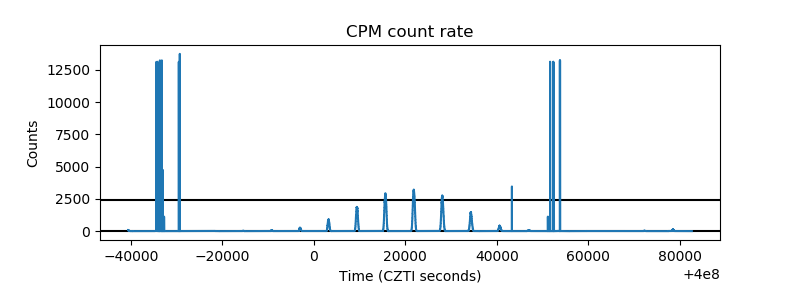 |
| CZT Counter |  |
| +2.5 Volts monitor |  |
| +5 Volts monitor | 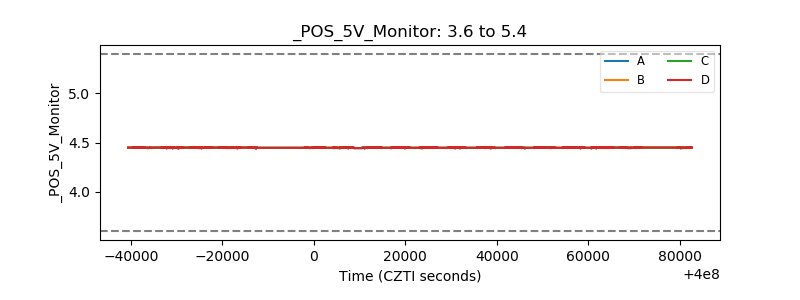 |
| _ROLL_ROT |  |
| _Roll_DEC | 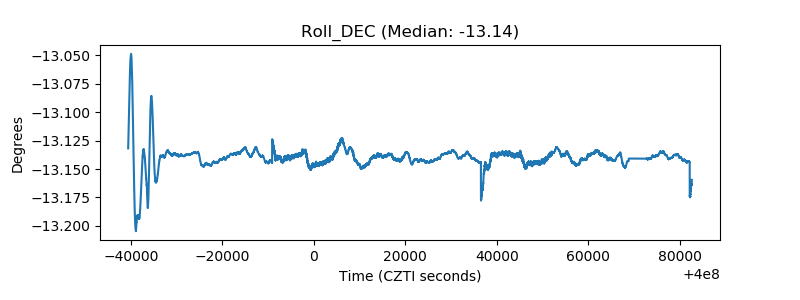 |
| _Roll_RA |  |
| Veto Counter |  |