| Param | Original file | Final file |
|---|---|---|
| Filename | modeM0/AS1A11_030T02_9000005328_37496cztM0_level2.evt | modeM0/AS1A11_030T02_9000005328_37496cztM0_level2_quad_clean.evt |
| Size (bytes) | 11,511,360 | 3,461,760 |
| Size | 11.0 MB | 3.3 MB |
| Events in quadrant A | 87,097 | 21,812 |
| Events in quadrant B | 75,840 | 21,804 |
| Events in quadrant C | 92,659 | 20,744 |
| Events in quadrant D | 77,380 | 19,242 |
| Mode M9 | |||
|---|---|---|---|
| Quadrant | BADHDUFLAG | Total packets | Discarded packets |
| A | 0 | 8 | 3 |
| B | 0 | 9 | 6 |
| C | 0 | 11 | 10 |
| D | 0 | 10 | 7 |
| Mode M0 | |||
|---|---|---|---|
| Quadrant | BADHDUFLAG | Total packets | Discarded packets |
| A | 0 | 2323 | 1957 |
| B | 0 | 2111 | 1754 |
| C | 0 | 2547 | 2164 |
| D | 0 | 2484 | 2134 |
| Mode SS | |||
|---|---|---|---|
| Quadrant | BADHDUFLAG | Total packets | Discarded packets |
| A | 0 | 20 | 17 |
| B | 0 | 19 | 13 |
| C | 0 | 21 | 18 |
| D | 0 | 21 | 17 |
| Quadrant | Total seconds | Saturated seconds | Saturation percentage |
|---|---|---|---|
| A | 181 | 0 | 0.000000% |
| B | 178 | 0 | 0.000000% |
| C | 176 | 0 | 0.000000% |
| D | 168 | 1 | 0.595238% |
Noise dominated data is calculated using 1-second bins in cleaned event files. If a bin has >2000 counts, and if more than 50% of those come from <1% of pixels, then it is considered to be noise-dominated and hence unusable.
| Quadrant | # 1 sec bins | Bins with >0 counts | Bins with >2000 counts | High rate bins dominated by noise | Noise dominated (total time) | Noise dominated (detector-on time) | Marked lightcurve |
|---|---|---|---|---|---|---|---|
| A | 1080 | 297 | 0 | 0 | 0.00% | 0.00% | 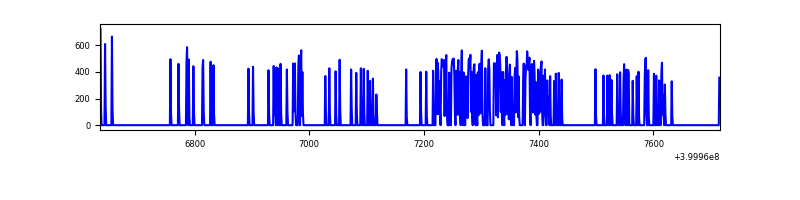 |
| B | 990 | 301 | 0 | 0 | 0.00% | 0.00% | 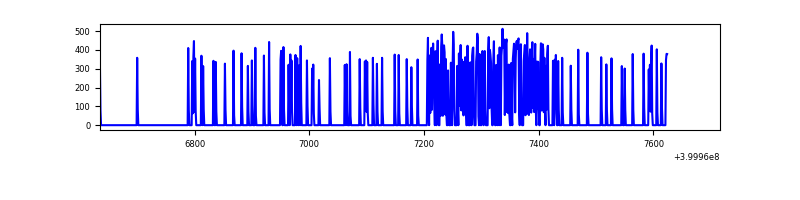 |
| C | 951 | 286 | 0 | 0 | 0.00% | 0.00% | 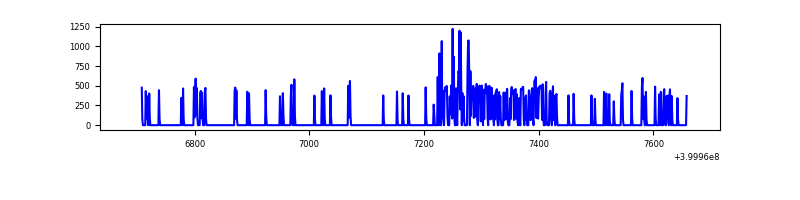 |
| D | 961 | 269 | 0 | 0 | 0.00% | 0.00% | 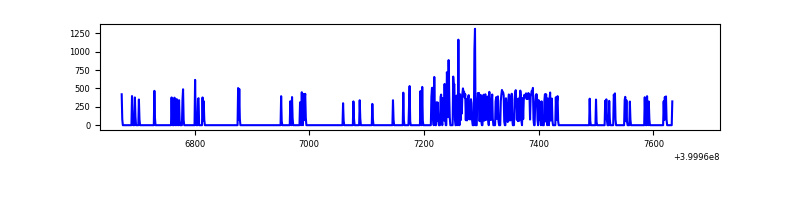 |
Top three noisy pixels from each quadrant. If the there are fewer than three noisy pixels in the level2.evt file, extra rows are filled as -1
| Pixel properties | Quadrant properties | ||||||
|---|---|---|---|---|---|---|---|
| Quadrant | DetID | PixID | Counts | Sigma | Mean | Median | Sigma |
| A | 10 | 83 | 8677 | 1437.54 | 19 | 19 | 6.0 |
| A | 9 | 143 | 436 | 69.24 | 19 | 19 | 6.0 |
| A | 15 | 222 | 401 | 63.43 | 19 | 19 | 6.0 |
| B | 12 | 111 | 476 | 81.12 | 19 | 18 | 5.6 |
| B | 11 | 111 | 436 | 74.04 | 19 | 18 | 5.6 |
| B | 14 | 111 | 397 | 67.13 | 19 | 18 | 5.6 |
| C | 14 | 254 | 9904 | 1557.0 | 18 | 18 | 6.3 |
| C | 15 | 214 | 7580 | 1190.98 | 18 | 18 | 6.3 |
| C | 14 | 128 | 760 | 116.86 | 18 | 18 | 6.3 |
| D | 13 | 249 | 4025 | 643.68 | 17 | 16 | 6.2 |
| D | 2 | 249 | 2666 | 425.48 | 17 | 16 | 6.2 |
| D | 7 | 38 | 1528 | 242.76 | 17 | 16 | 6.2 |
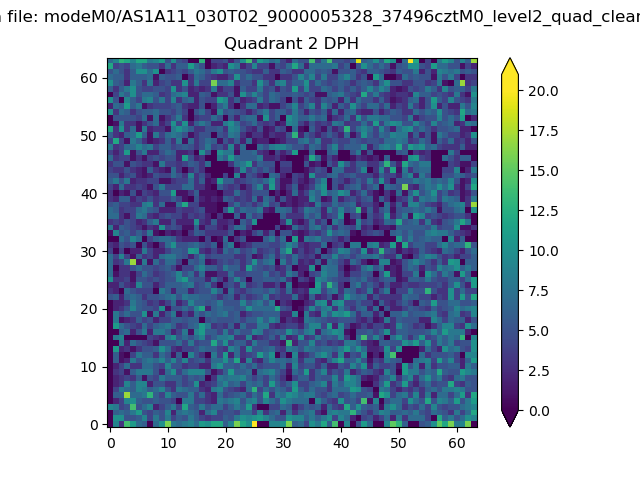
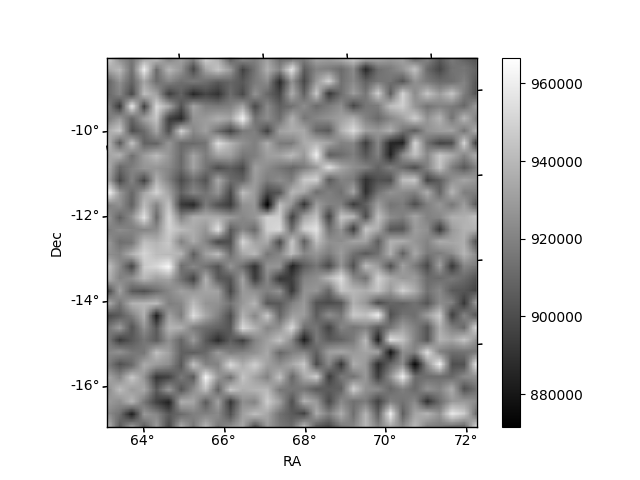
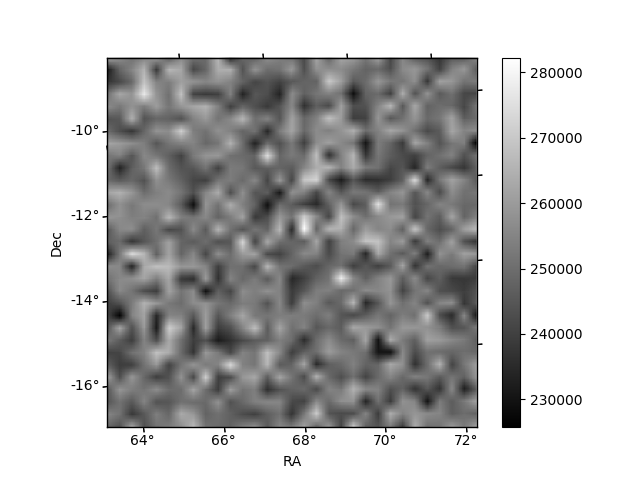
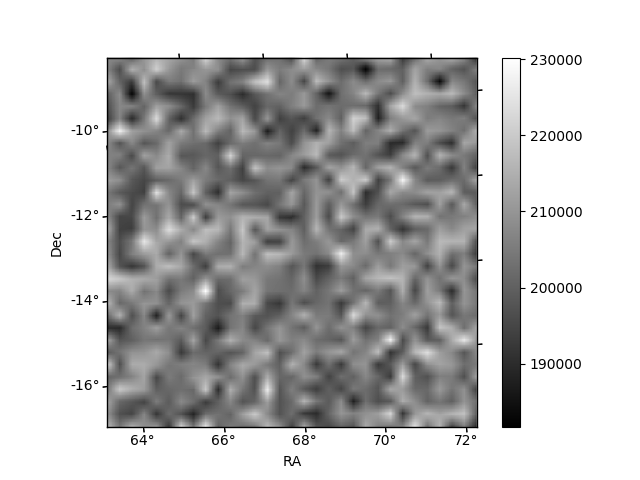
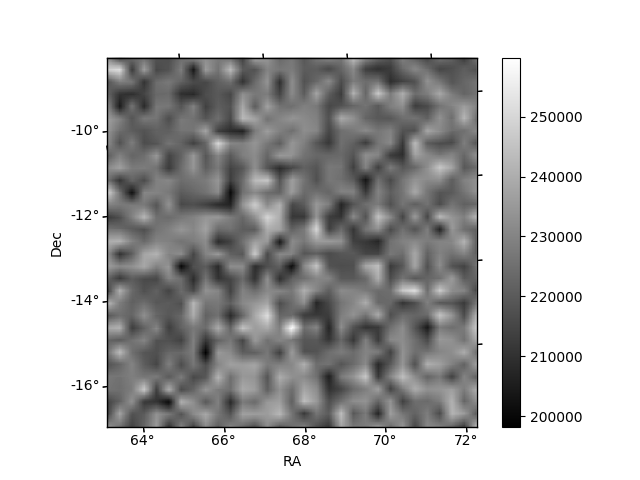
Histogram calculated using DETX and DETY for each event in the final _common_clean file
| Quadrant A | 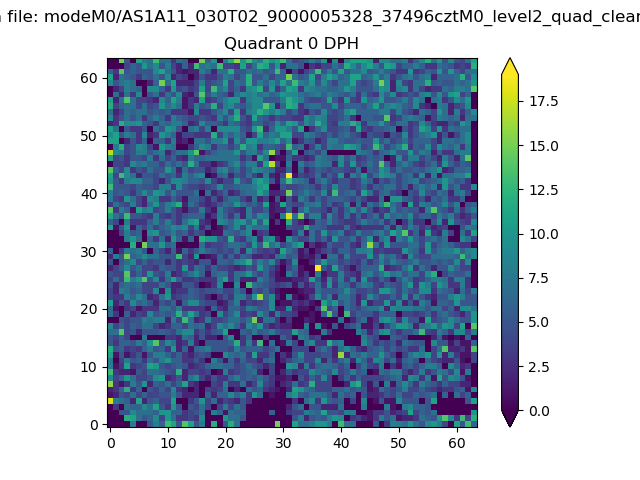 |
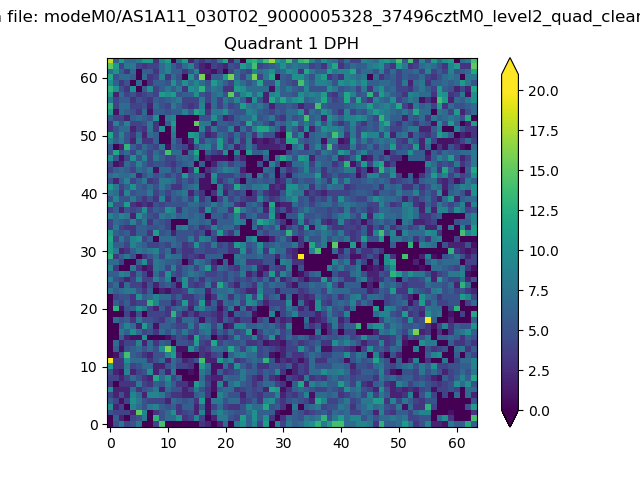 |
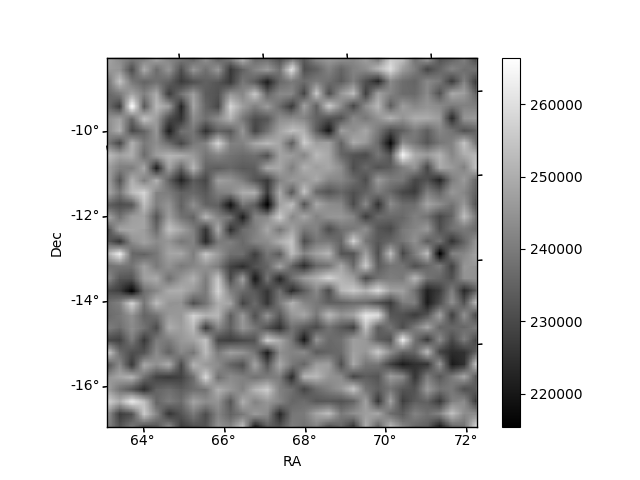
Quadrant B |
|---|---|---|---|
| Quadrant D | 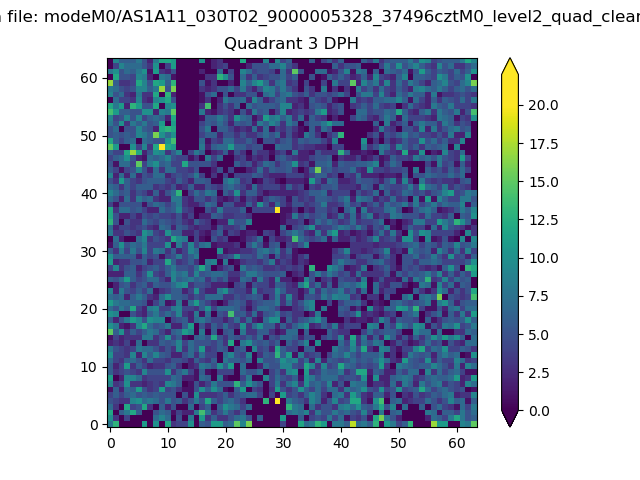 |
 |
Quadrant C |
| Plot type | Count rate plots | Images |
|---|---|---|
| Comparison with Poisson distribution Blue bars denote a histogram of data divided into 1 sec bins. Red curve is a Poisson curve with rate = median count rate of data. |
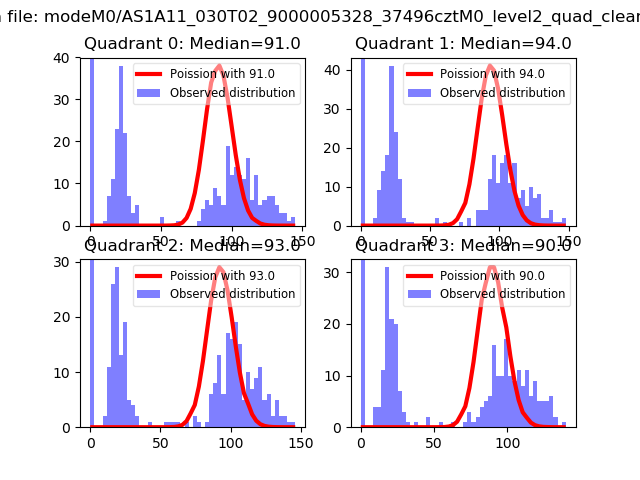 |
 |
| Quadrant-wise count rates Data is divided into 100 sec bins |
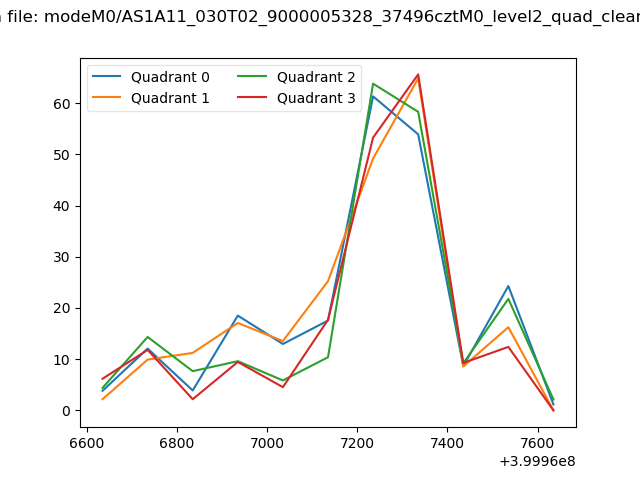 |
|
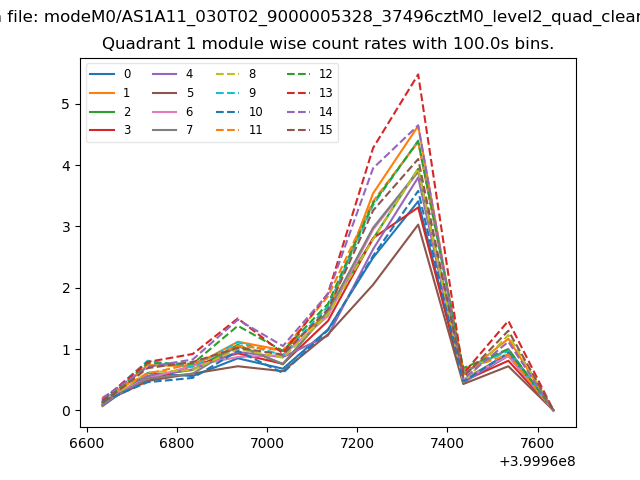
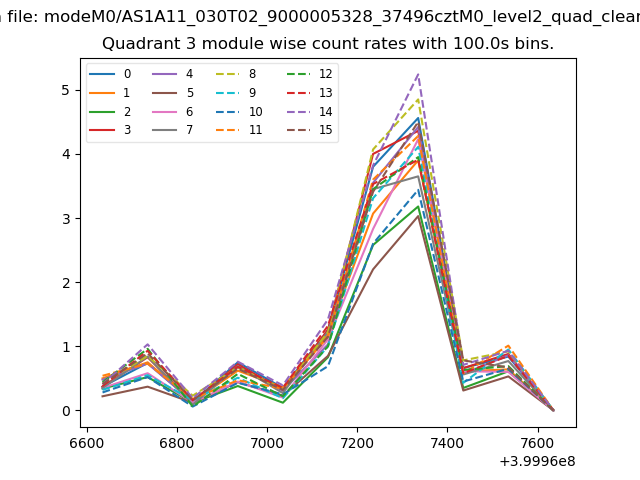
| Module-wise count rates for Quadrant A Data is divided into 100 sec bins |
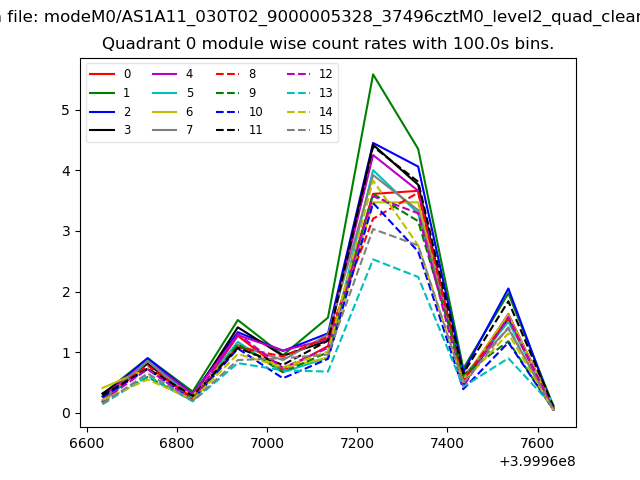 |
 |
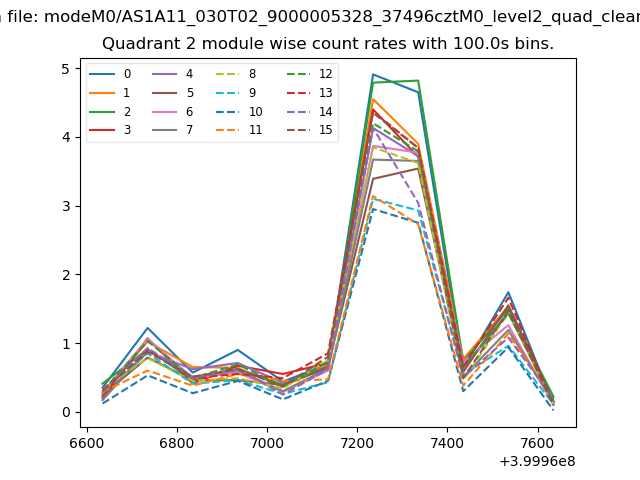
| Module-wise count rates for Quadrant B Data is divided into 100 sec bins |
 |
 |
| Module-wise count rates for Quadrant C Data is divided into 100 sec bins |
 |
 |
| Module-wise count rates for Quadrant D Data is divided into 100 sec bins |
 |
 |
| Parameter | Plot |
|---|---|
| CZT HV Monitor | 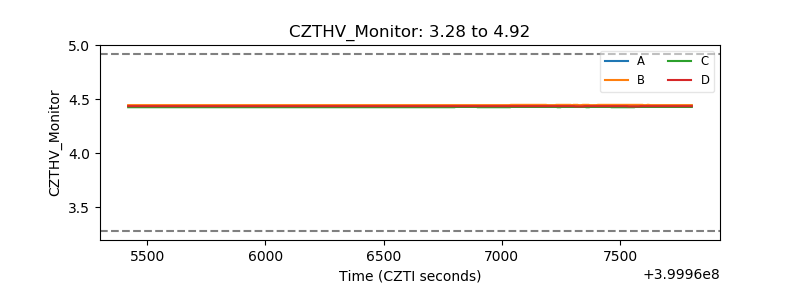 |
| D_VDD | 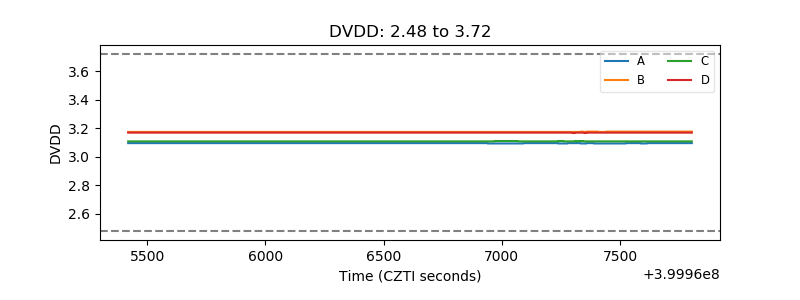 |
| Temperature 1 | 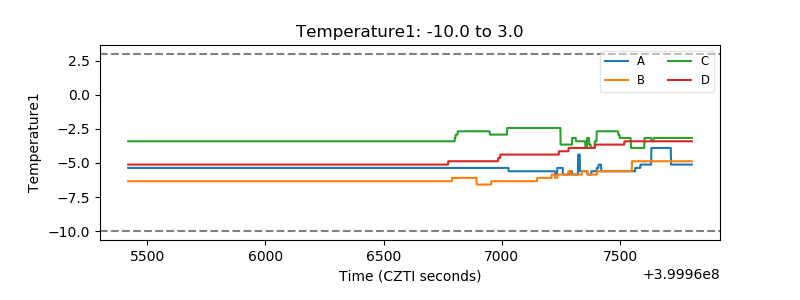 |
| Veto HV Monitor | 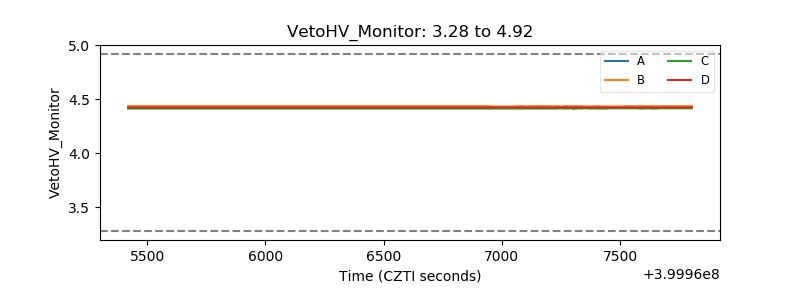 |
| Veto LLD | 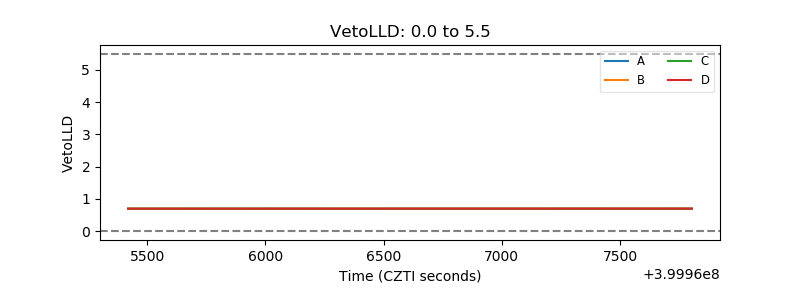 |
| Alpha Counter | 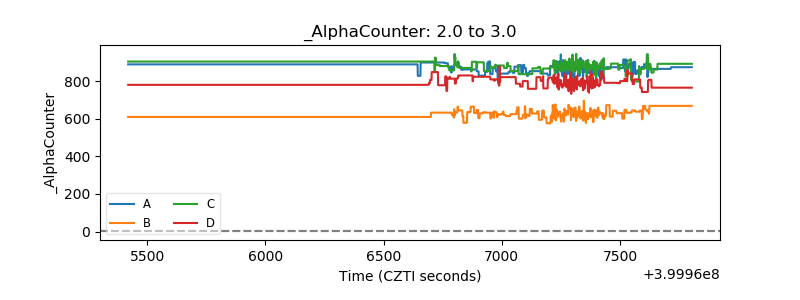 |
| _CPM_Rate | 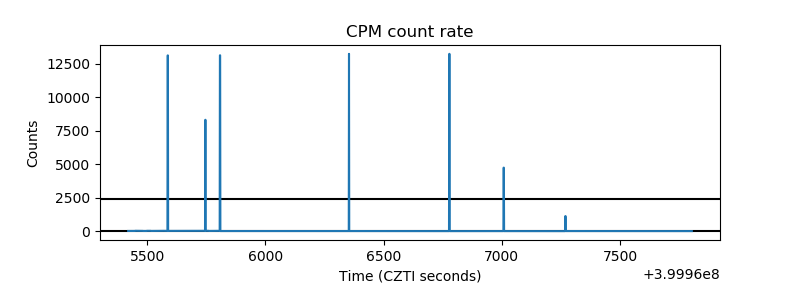 |
| CZT Counter | 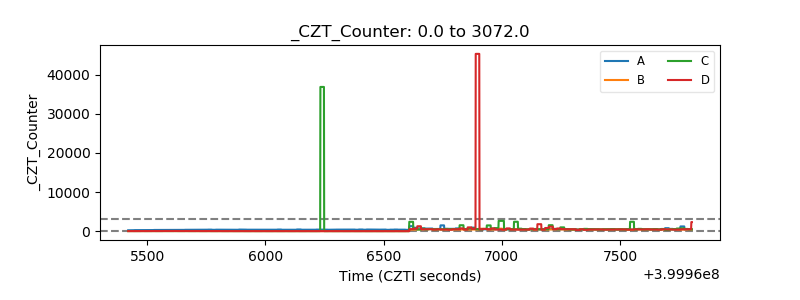 |
| +2.5 Volts monitor | 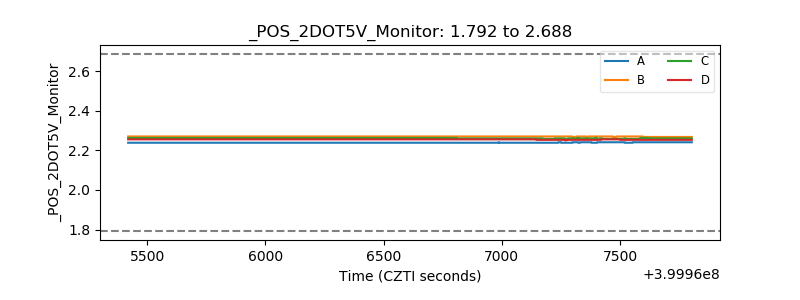 |
| +5 Volts monitor | 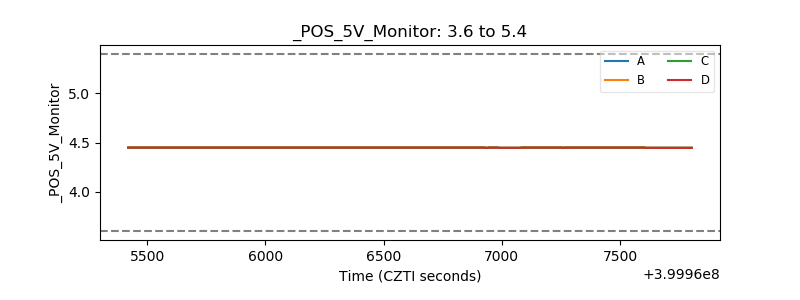 |
| _ROLL_ROT | 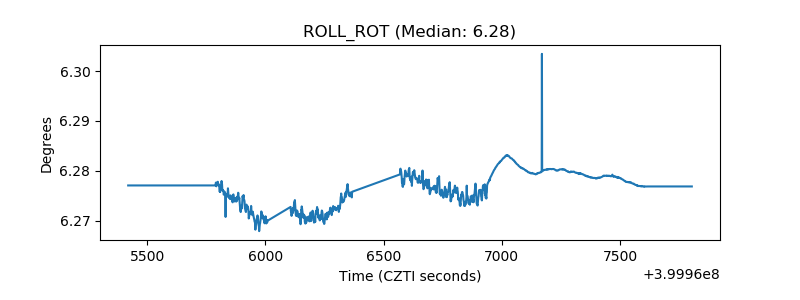 |
| _Roll_DEC |  |
| _Roll_RA | 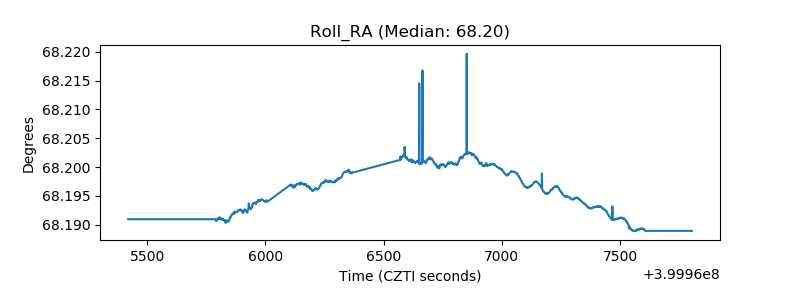 |
| Veto Counter | 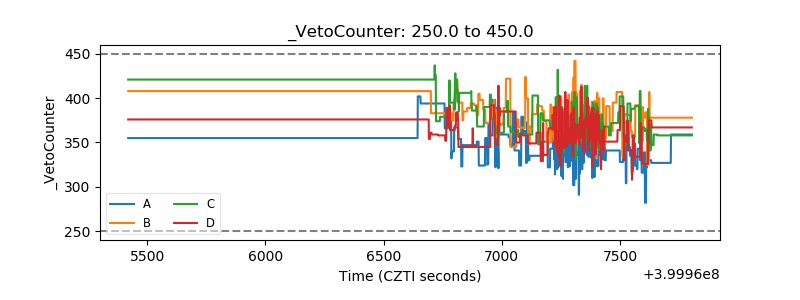 |