| Param | Original file | Final file |
|---|---|---|
| Filename | modeM0/AS1A11_030T02_9000005328_37500cztM0_level2.evt | modeM0/AS1A11_030T02_9000005328_37500cztM0_level2_quad_clean.evt |
| Size (bytes) | 1,205,360,640 | 166,245,120 |
| Size | 1.1 GB | 158.5 MB |
| Events in quadrant A | 8,262,433 | 1,023,811 |
| Events in quadrant B | 9,360,193 | 994,401 |
| Events in quadrant C | 8,395,844 | 994,350 |
| Events in quadrant D | 9,430,931 | 944,031 |
| Mode M9 | |||
|---|---|---|---|
| Quadrant | BADHDUFLAG | Total packets | Discarded packets |
| A | 0 | 47 | 0 |
| B | 0 | 47 | 0 |
| C | 0 | 47 | 0 |
| D | 0 | 48 | 0 |
| Mode M0 | |||
|---|---|---|---|
| Quadrant | BADHDUFLAG | Total packets | Discarded packets |
| A | 0 | 33935 | 5 |
| B | 0 | 37812 | 4 |
| C | 0 | 34166 | 4 |
| D | 0 | 38653 | 4 |
| Mode SS | |||
|---|---|---|---|
| Quadrant | BADHDUFLAG | Total packets | Discarded packets |
| A | 0 | 318 | 0 |
| B | 0 | 318 | 0 |
| C | 0 | 318 | 0 |
| D | 0 | 318 | 0 |
| Quadrant | Total seconds | Saturated seconds | Saturation percentage |
|---|---|---|---|
| A | 15624 | 42 | 0.268817% |
| B | 15624 | 556 | 3.558628% |
| C | 15624 | 153 | 0.979263% |
| D | 15624 | 426 | 2.726575% |
Noise dominated data is calculated using 1-second bins in cleaned event files. If a bin has >2000 counts, and if more than 50% of those come from <1% of pixels, then it is considered to be noise-dominated and hence unusable.
| Quadrant | # 1 sec bins | Bins with >0 counts | Bins with >2000 counts | High rate bins dominated by noise | Noise dominated (total time) | Noise dominated (detector-on time) | Marked lightcurve |
|---|---|---|---|---|---|---|---|
| A | 19800 | 15627 | 18 | 18 | 0.09% | 0.12% | 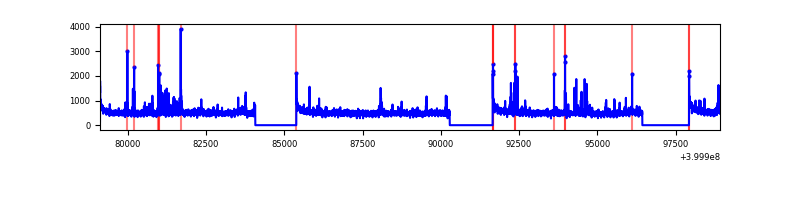 |
| B | 19800 | 15627 | 401 | 401 | 2.03% | 2.57% | 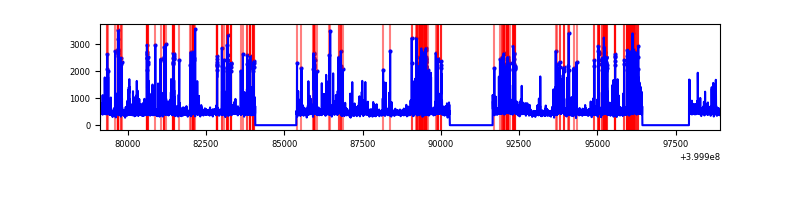 |
| C | 19800 | 15627 | 136 | 136 | 0.69% | 0.87% | 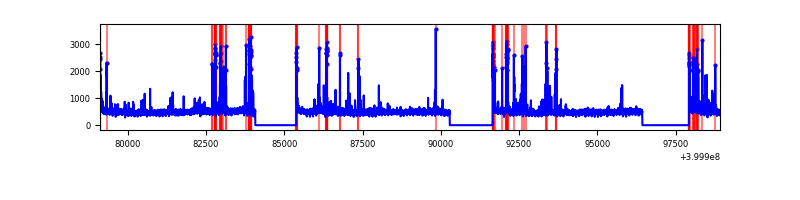 |
| D | 19800 | 15627 | 378 | 378 | 1.91% | 2.42% |  |
Top three noisy pixels from each quadrant. If the there are fewer than three noisy pixels in the level2.evt file, extra rows are filled as -1
| Pixel properties | Quadrant properties | ||||||
|---|---|---|---|---|---|---|---|
| Quadrant | DetID | PixID | Counts | Sigma | Mean | Median | Sigma |
| A | 10 | 83 | 744510 | 2062.99 | 1791 | 1755 | 360.0 |
| A | 9 | 143 | 159512 | 438.17 | 1791 | 1755 | 360.0 |
| A | 6 | 10 | 125871 | 344.73 | 1791 | 1755 | 360.0 |
| B | 5 | 172 | 1612298 | 4809.97 | 1758 | 1710 | 334.8 |
| B | 15 | 35 | 171375 | 506.7 | 1758 | 1710 | 334.8 |
| B | 5 | 184 | 158692 | 468.82 | 1758 | 1710 | 334.8 |
| C | 15 | 214 | 667020 | 1634.6 | 1744 | 1754 | 407.0 |
| C | 14 | 254 | 637019 | 1560.88 | 1744 | 1754 | 407.0 |
| C | 0 | 10 | 178690 | 434.74 | 1744 | 1754 | 407.0 |
| D | 13 | 249 | 1177513 | 2779.76 | 1732 | 1686 | 423.0 |
| D | 2 | 249 | 543022 | 1279.77 | 1732 | 1686 | 423.0 |
| D | 2 | 250 | 315074 | 740.88 | 1732 | 1686 | 423.0 |
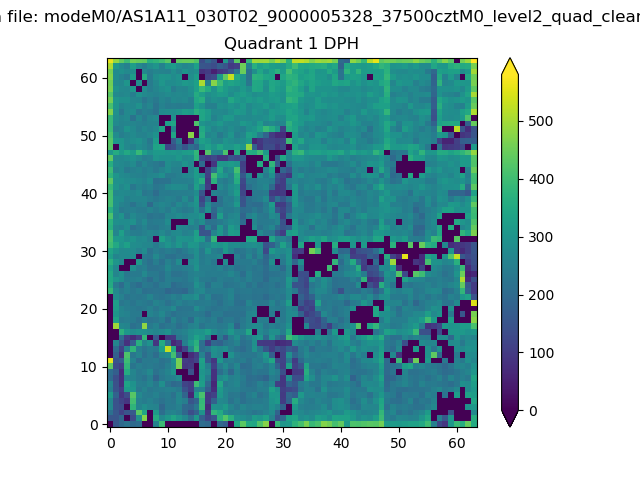
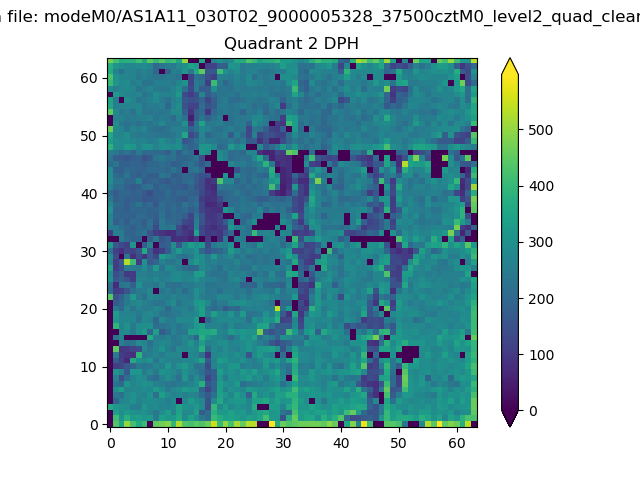
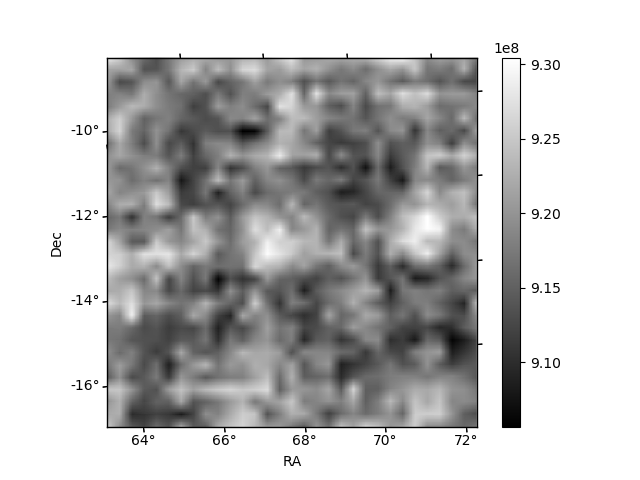
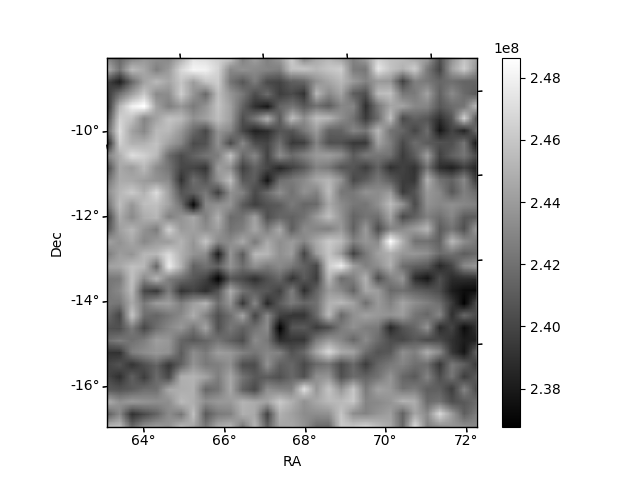
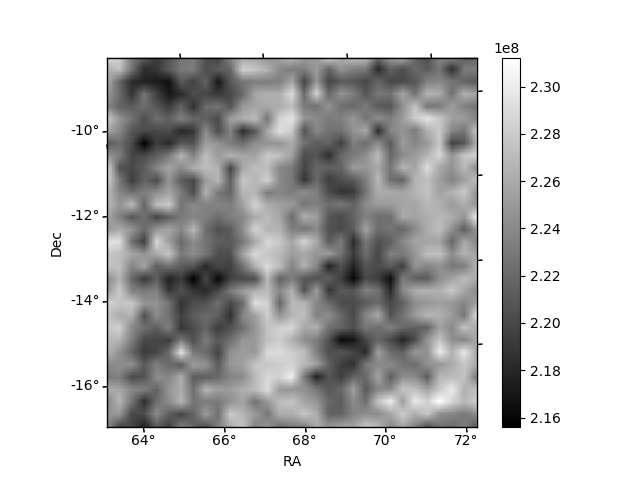
Histogram calculated using DETX and DETY for each event in the final _common_clean file
| Quadrant A | 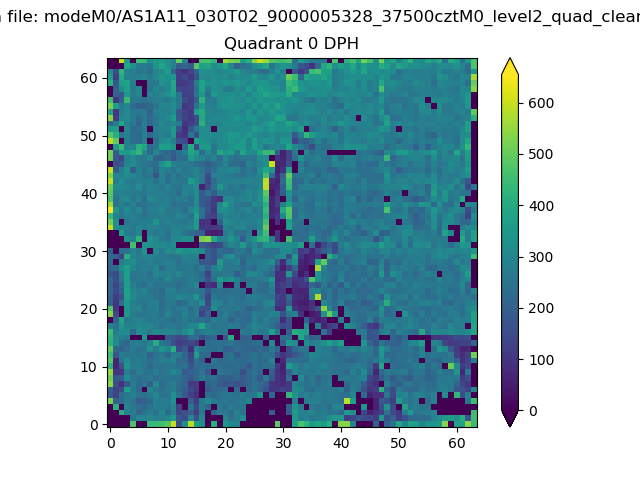 |
 |
Quadrant B |
|---|---|---|---|
| Quadrant D | 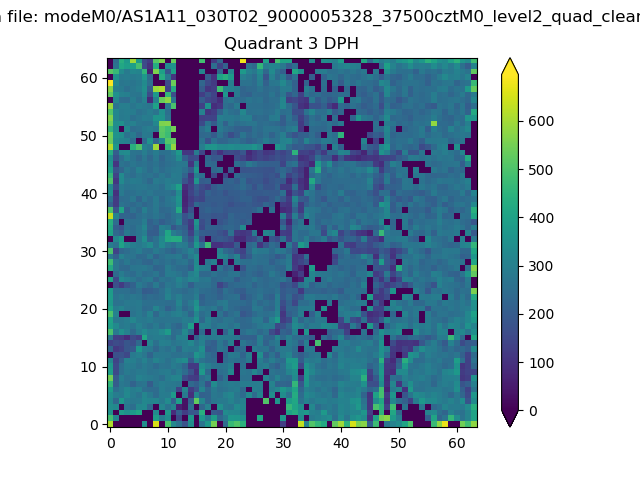 |
 |
Quadrant C |
| Plot type | Count rate plots | Images |
|---|---|---|
| Comparison with Poisson distribution Blue bars denote a histogram of data divided into 1 sec bins. Red curve is a Poisson curve with rate = median count rate of data. |
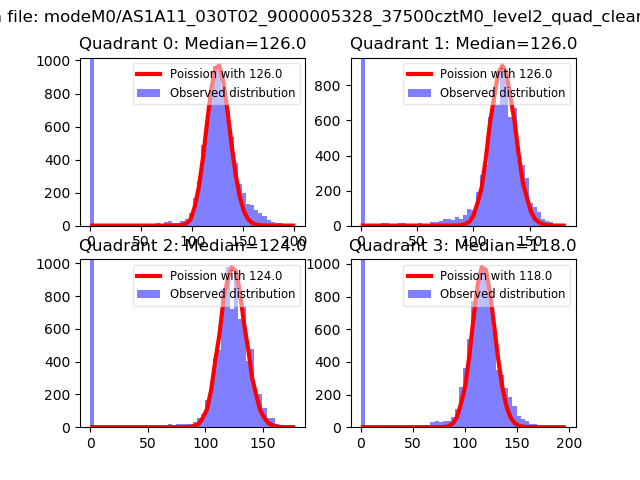 |
 |
| Quadrant-wise count rates Data is divided into 100 sec bins |
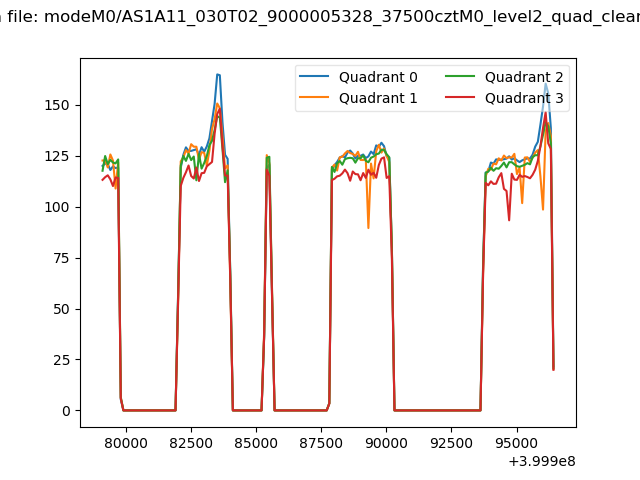 |
|
| Module-wise count rates for Quadrant A Data is divided into 100 sec bins |
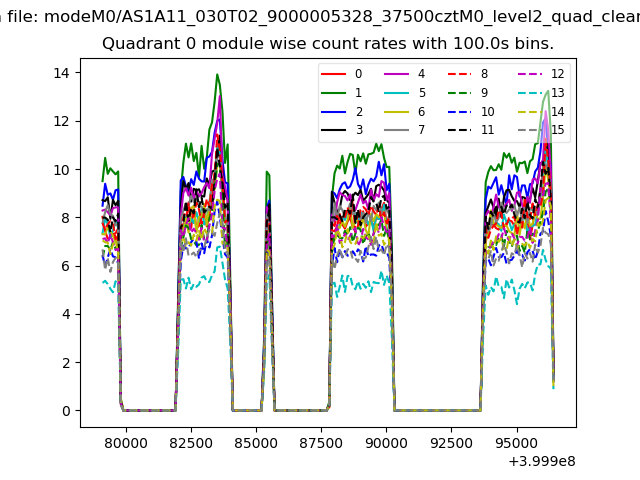 |
 |
| Module-wise count rates for Quadrant B Data is divided into 100 sec bins |
 |
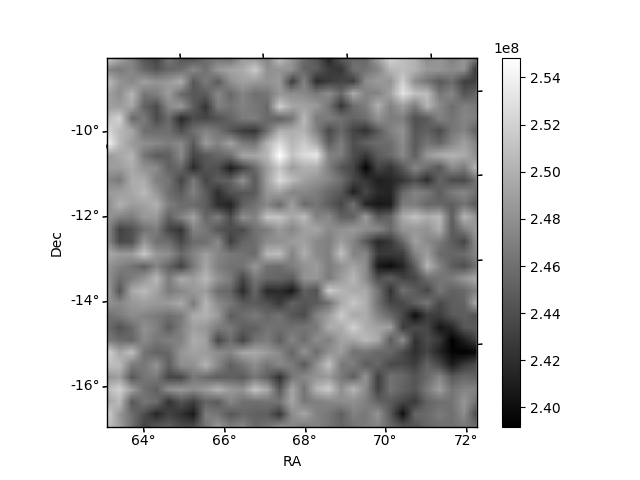 |
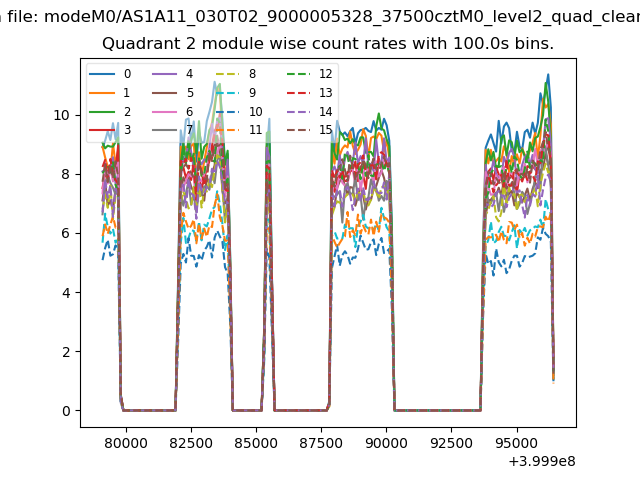
| Module-wise count rates for Quadrant C Data is divided into 100 sec bins |
 |
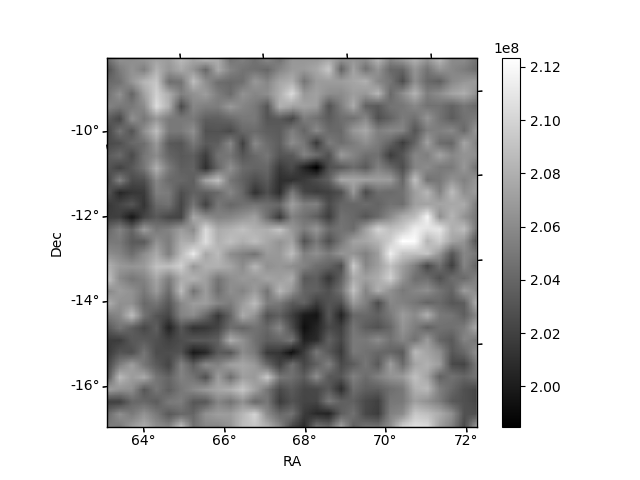 |
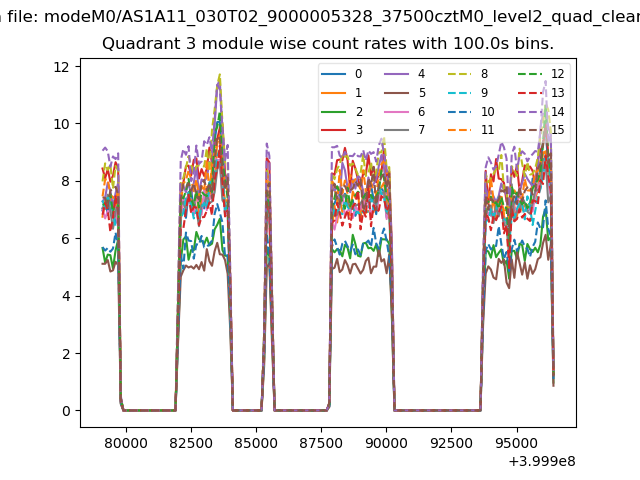
| Module-wise count rates for Quadrant D Data is divided into 100 sec bins |
 |
 |
| Parameter | Plot |
|---|---|
| CZT HV Monitor |  |
| D_VDD | 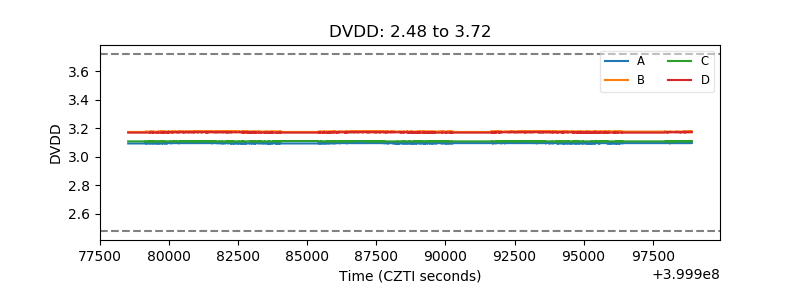 |
| Temperature 1 | 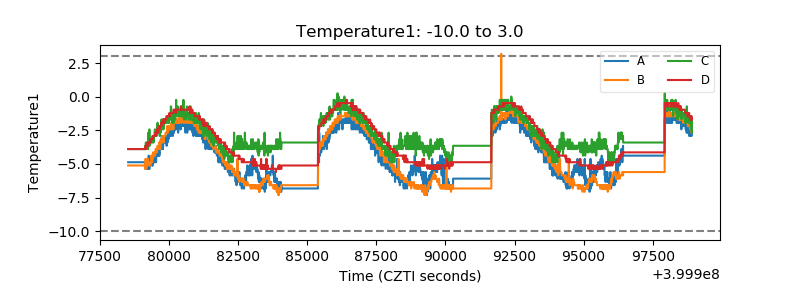 |
| Veto HV Monitor | 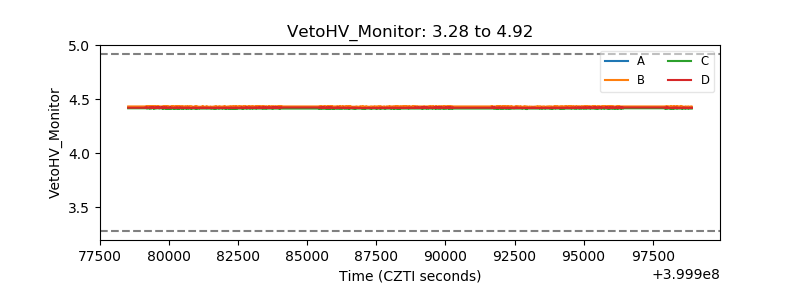 |
| Veto LLD | 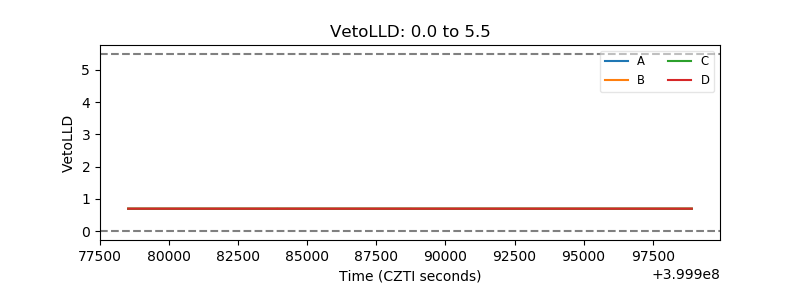 |
| Alpha Counter | 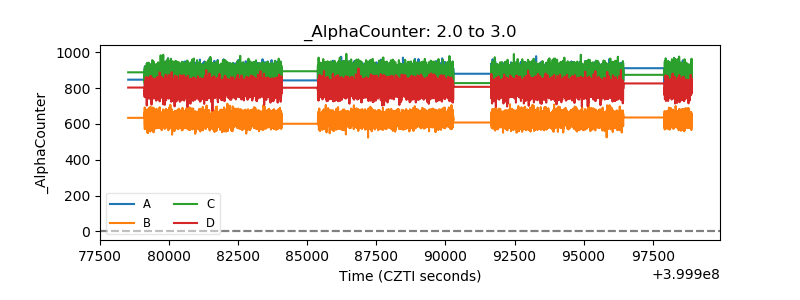 |
| _CPM_Rate | 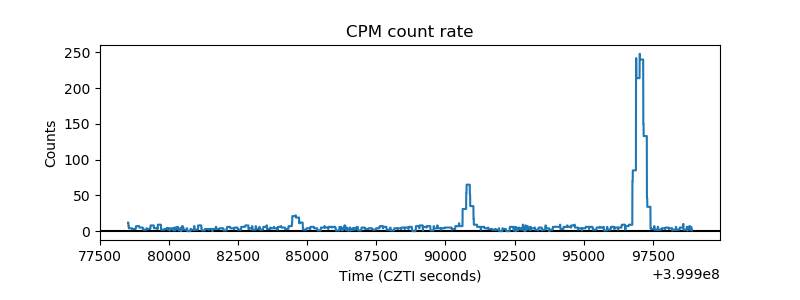 |
| CZT Counter | 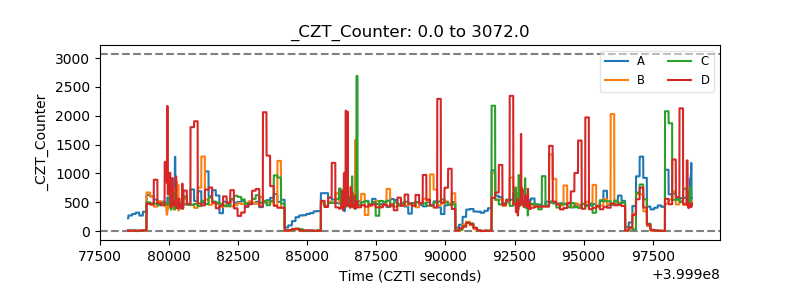 |
| +2.5 Volts monitor | 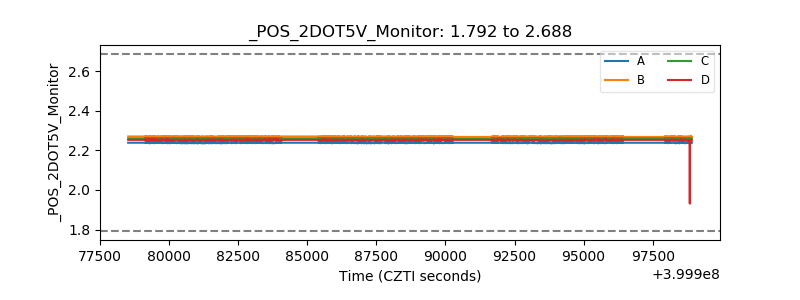 |
| +5 Volts monitor | 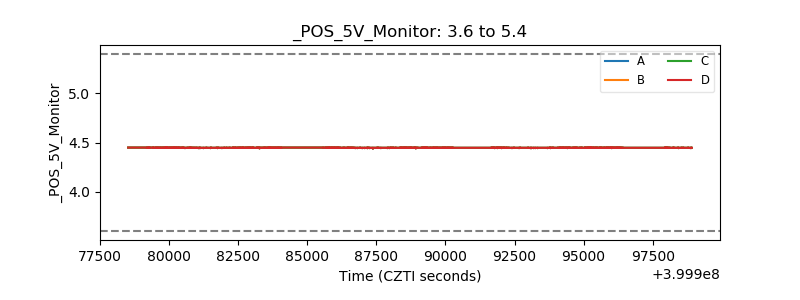 |
| _ROLL_ROT | 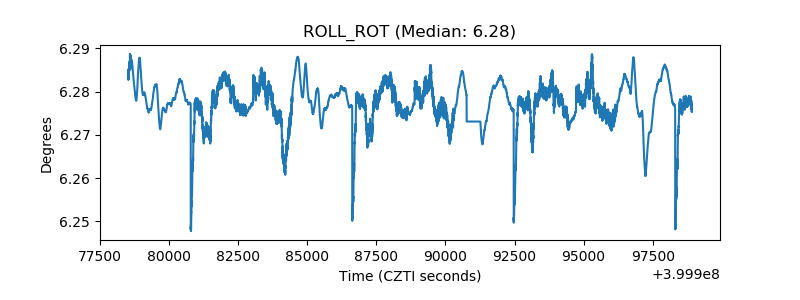 |
| _Roll_DEC | 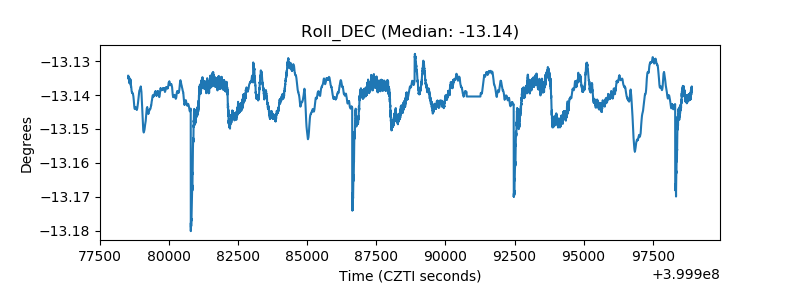 |
| _Roll_RA | 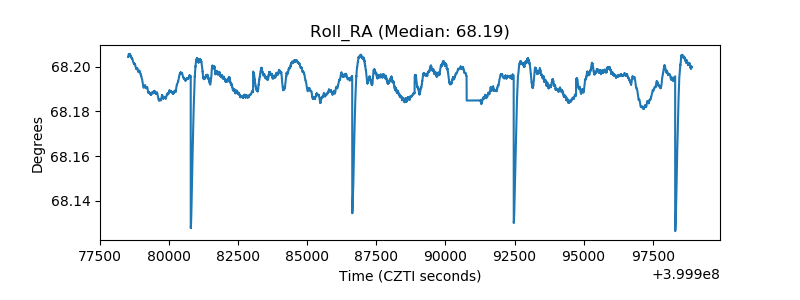 |
| Veto Counter | 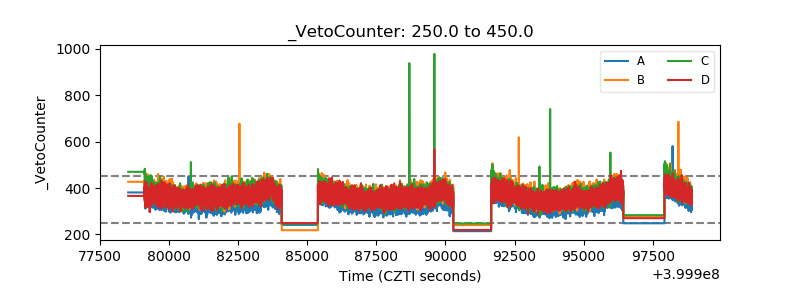 |