| Param | Original file | Final file |
|---|---|---|
| Filename | modeM0/AS1A11_030T02_9000005328_37501cztM0_level2.evt | modeM0/AS1A11_030T02_9000005328_37501cztM0_level2_quad_clean.evt |
| Size (bytes) | 2,051,694,720 | 273,173,760 |
| Size | 1.9 GB | 260.5 MB |
| Events in quadrant A | 14,277,911 | 1,657,507 |
| Events in quadrant B | 14,655,386 | 1,642,485 |
| Events in quadrant C | 15,000,881 | 1,602,223 |
| Events in quadrant D | 16,395,323 | 1,529,087 |
| Mode M9 | |||
|---|---|---|---|
| Quadrant | BADHDUFLAG | Total packets | Discarded packets |
| A | 0 | 86 | 0 |
| B | 0 | 86 | 0 |
| C | 0 | 86 | 0 |
| D | 0 | 86 | 0 |
| Mode M0 | |||
|---|---|---|---|
| Quadrant | BADHDUFLAG | Total packets | Discarded packets |
| A | 0 | 58521 | 12 |
| B | 0 | 60819 | 15 |
| C | 0 | 60501 | 8 |
| D | 0 | 66807 | 14 |
| Mode SS | |||
|---|---|---|---|
| Quadrant | BADHDUFLAG | Total packets | Discarded packets |
| A | 0 | 548 | 0 |
| B | 0 | 548 | 0 |
| C | 0 | 548 | 0 |
| D | 0 | 548 | 0 |
| Quadrant | Total seconds | Saturated seconds | Saturation percentage |
|---|---|---|---|
| A | 26774 | 88 | 0.328677% |
| B | 26771 | 511 | 1.908782% |
| C | 26775 | 471 | 1.759104% |
| D | 26771 | 732 | 2.734302% |
Noise dominated data is calculated using 1-second bins in cleaned event files. If a bin has >2000 counts, and if more than 50% of those come from <1% of pixels, then it is considered to be noise-dominated and hence unusable.
| Quadrant | # 1 sec bins | Bins with >0 counts | Bins with >2000 counts | High rate bins dominated by noise | Noise dominated (total time) | Noise dominated (detector-on time) | Marked lightcurve |
|---|---|---|---|---|---|---|---|
| A | 44189 | 26783 | 45 | 45 | 0.10% | 0.17% | 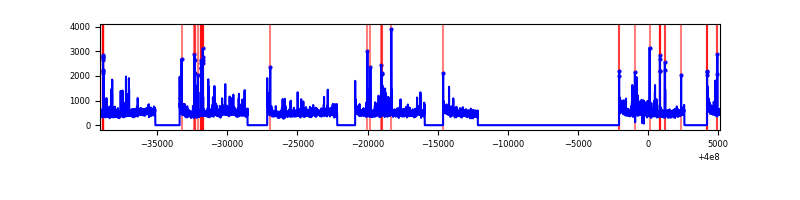 |
| B | 44188 | 26780 | 355 | 355 | 0.80% | 1.33% | 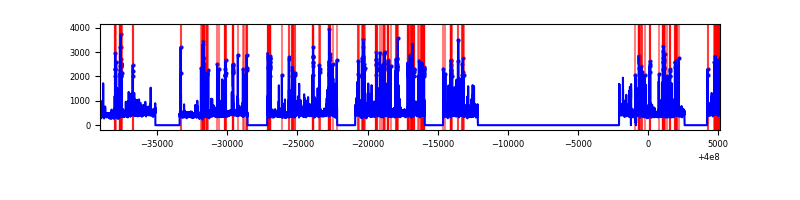 |
| C | 44189 | 26782 | 406 | 406 | 0.92% | 1.52% | 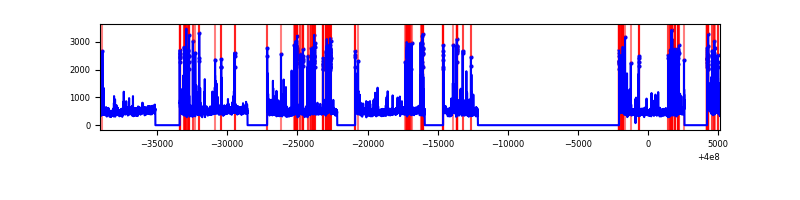 |
| D | 44189 | 26780 | 676 | 676 | 1.53% | 2.52% | 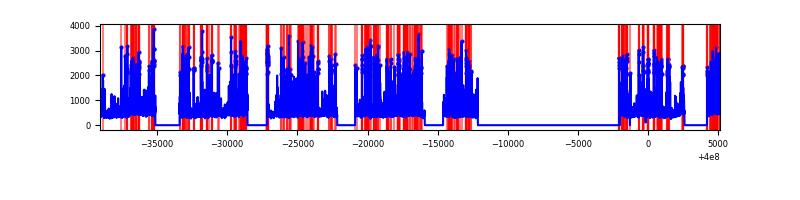 |
Top three noisy pixels from each quadrant. If the there are fewer than three noisy pixels in the level2.evt file, extra rows are filled as -1
| Pixel properties | Quadrant properties | ||||||
|---|---|---|---|---|---|---|---|
| Quadrant | DetID | PixID | Counts | Sigma | Mean | Median | Sigma |
| A | 10 | 83 | 1208391 | 1950.09 | 3094 | 3034 | 618.1 |
| A | 15 | 222 | 374325 | 600.7 | 3094 | 3034 | 618.1 |
| A | 9 | 143 | 221924 | 354.13 | 3094 | 3034 | 618.1 |
| B | 5 | 172 | 1584448 | 2696.82 | 3052 | 2969 | 586.4 |
| B | 15 | 35 | 359998 | 608.83 | 3052 | 2969 | 586.4 |
| B | 0 | 229 | 196265 | 329.62 | 3052 | 2969 | 586.4 |
| C | 14 | 254 | 1476455 | 2111.53 | 2985 | 3003 | 697.8 |
| C | 15 | 214 | 1125633 | 1608.78 | 2985 | 3003 | 697.8 |
| C | 14 | 128 | 252833 | 358.02 | 2985 | 3003 | 697.8 |
| D | 13 | 249 | 2146764 | 2926.91 | 2993 | 2912 | 732.5 |
| D | 2 | 249 | 603297 | 819.68 | 2993 | 2912 | 732.5 |
| D | 2 | 250 | 521120 | 707.49 | 2993 | 2912 | 732.5 |
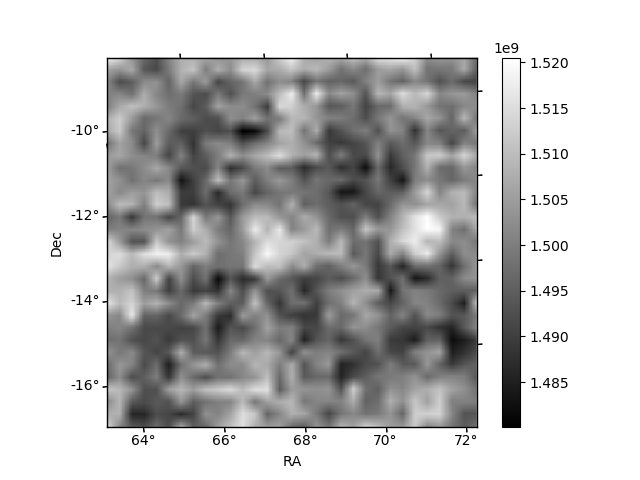
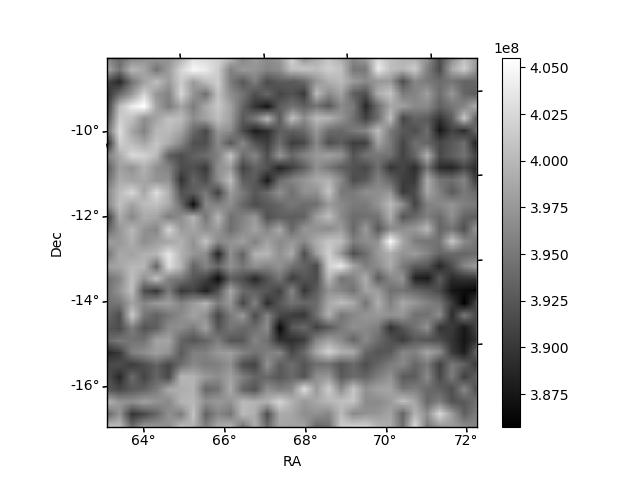
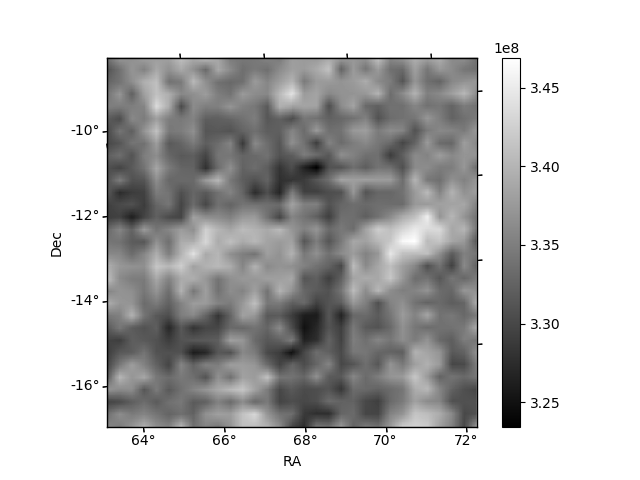
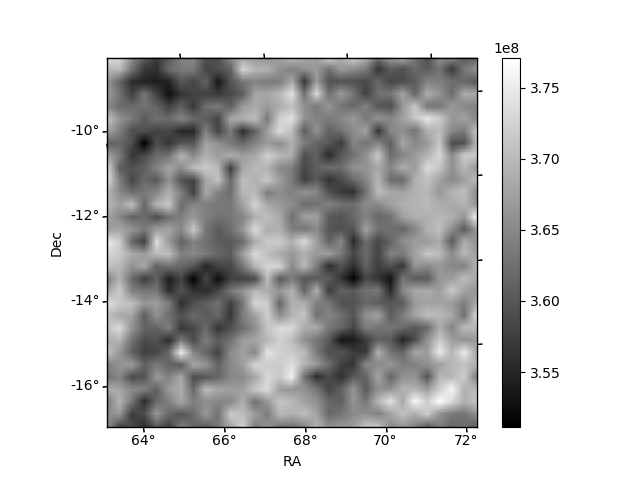
Histogram calculated using DETX and DETY for each event in the final _common_clean file
| Quadrant A | 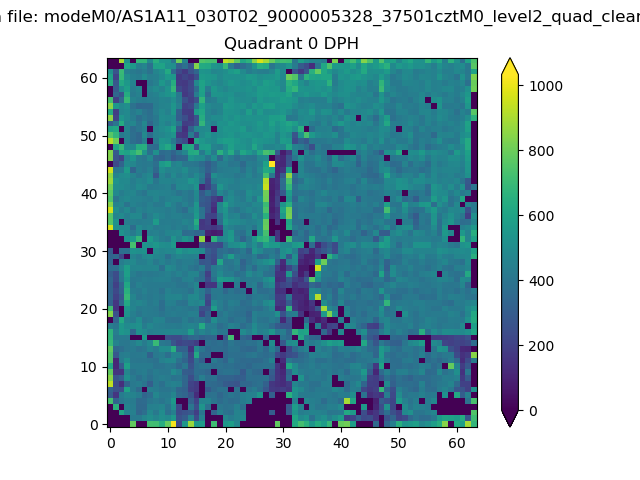 |
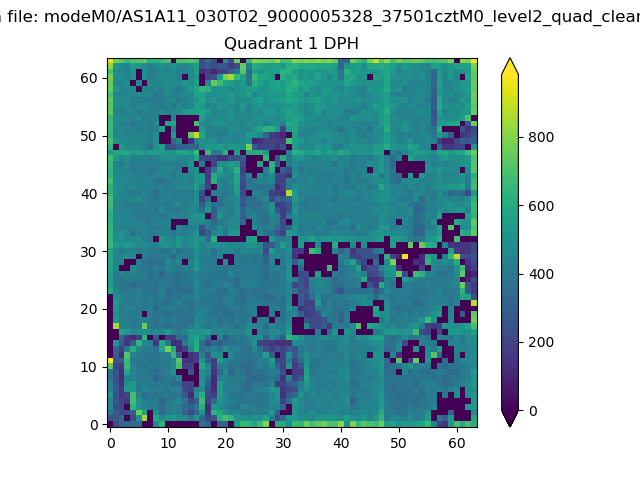 |
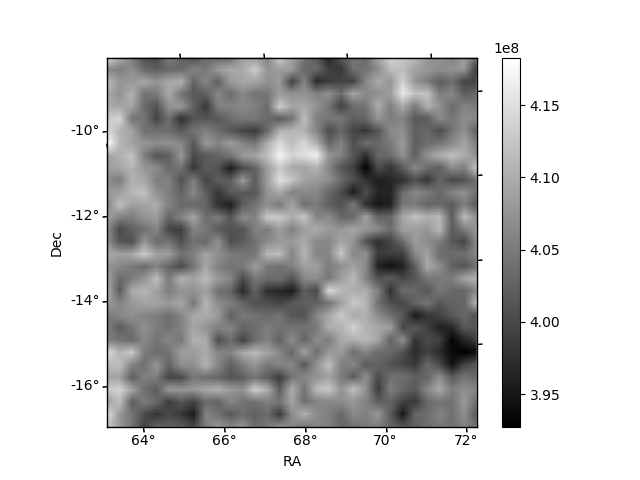
Quadrant B |
|---|---|---|---|
| Quadrant D | 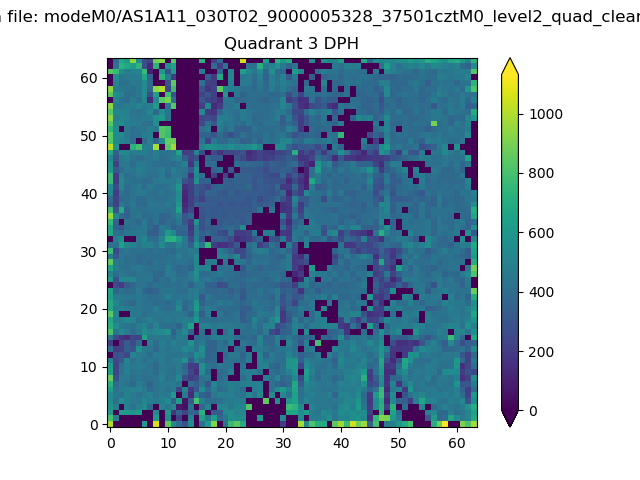 |
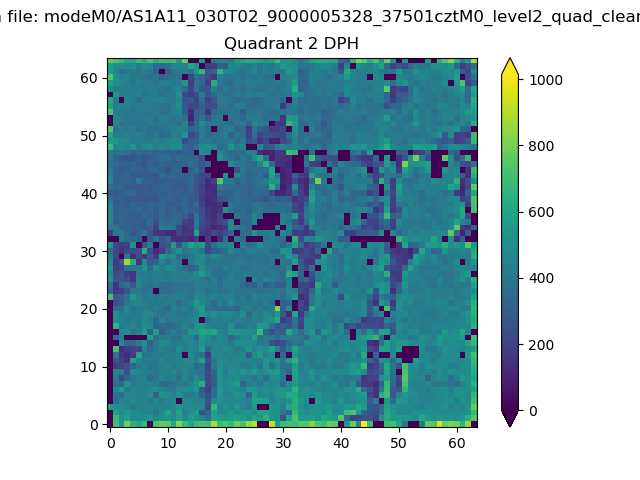 |
Quadrant C |
| Plot type | Count rate plots | Images |
|---|---|---|
| Comparison with Poisson distribution Blue bars denote a histogram of data divided into 1 sec bins. Red curve is a Poisson curve with rate = median count rate of data. |
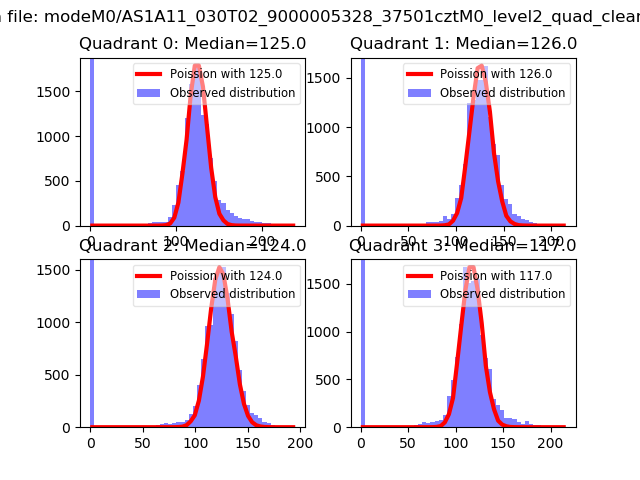 |
 |
| Quadrant-wise count rates Data is divided into 100 sec bins |
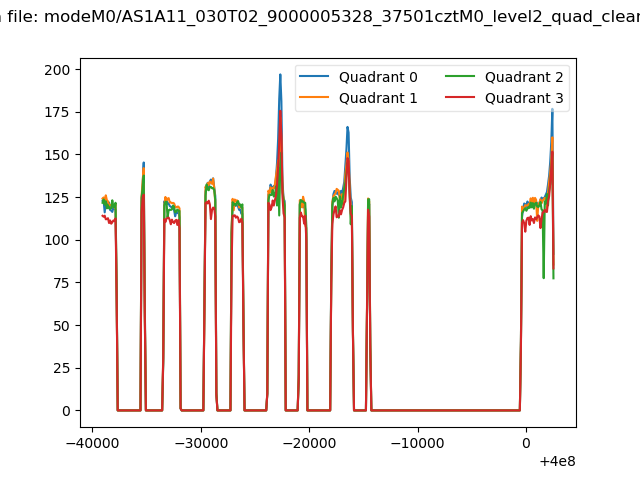 |
|
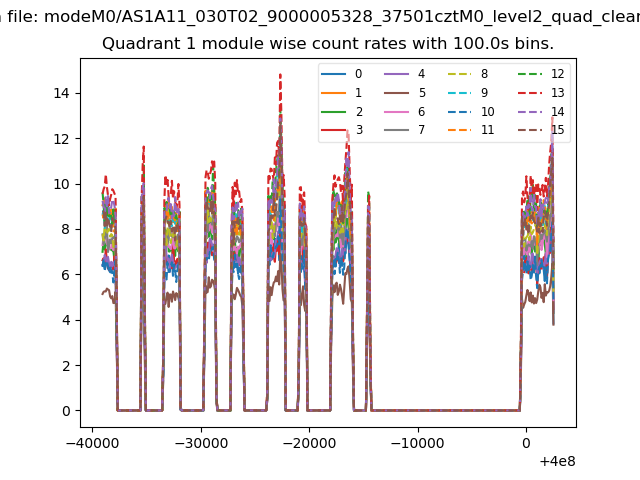
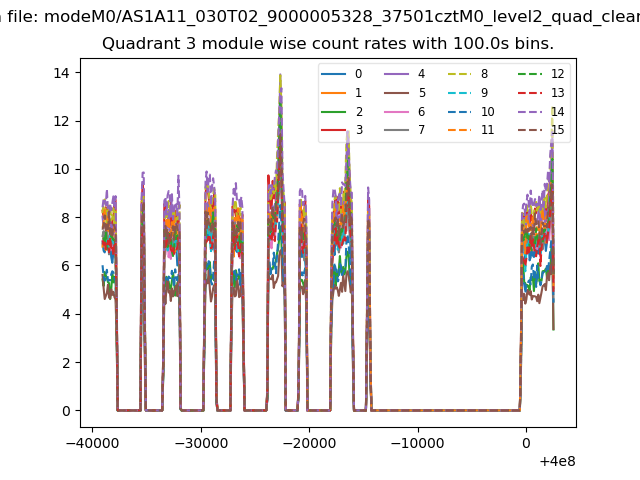
| Module-wise count rates for Quadrant A Data is divided into 100 sec bins |
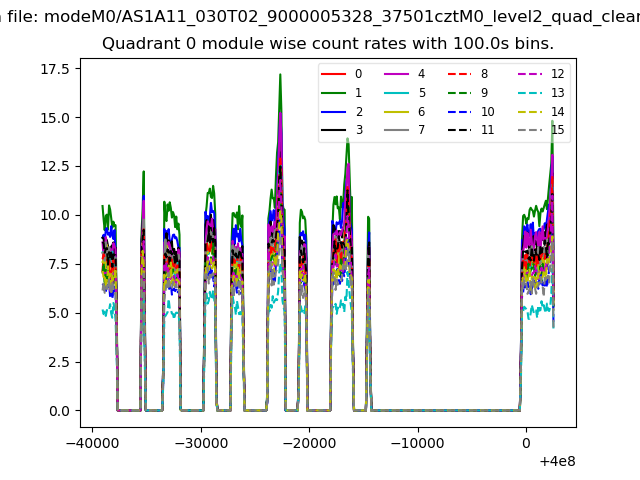 |
 |
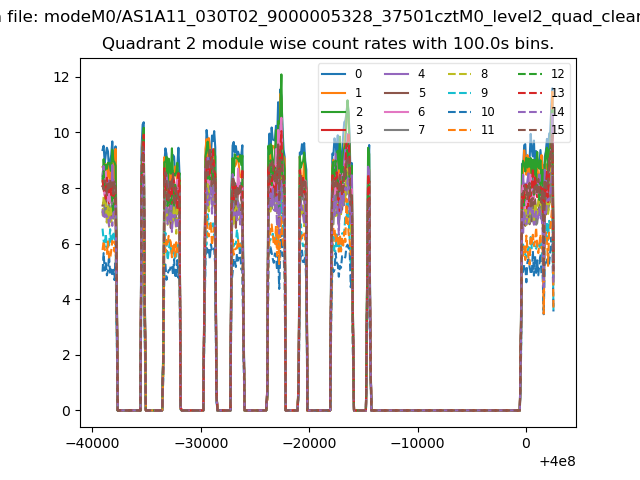
| Module-wise count rates for Quadrant B Data is divided into 100 sec bins |
 |
 |
| Module-wise count rates for Quadrant C Data is divided into 100 sec bins |
 |
 |
| Module-wise count rates for Quadrant D Data is divided into 100 sec bins |
 |
 |
| Parameter | Plot |
|---|---|
| CZT HV Monitor |  |
| D_VDD | 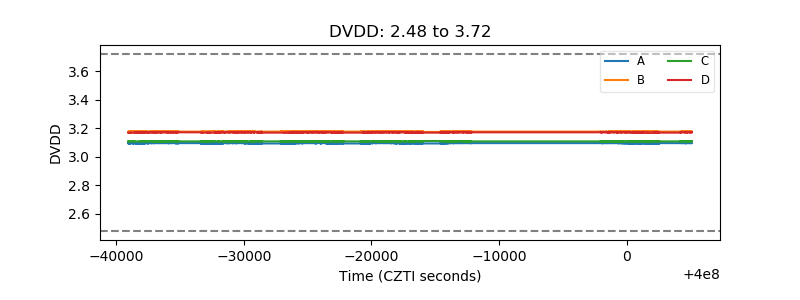 |
| Temperature 1 | 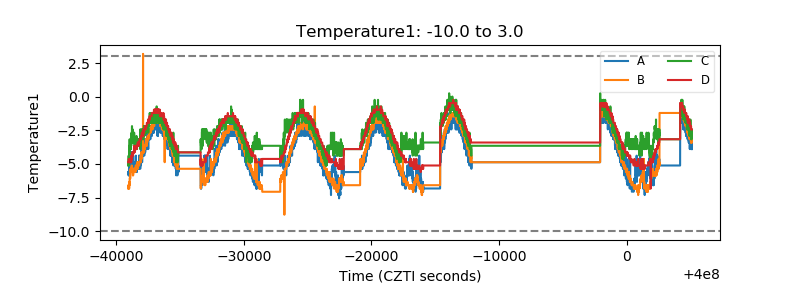 |
| Veto HV Monitor | 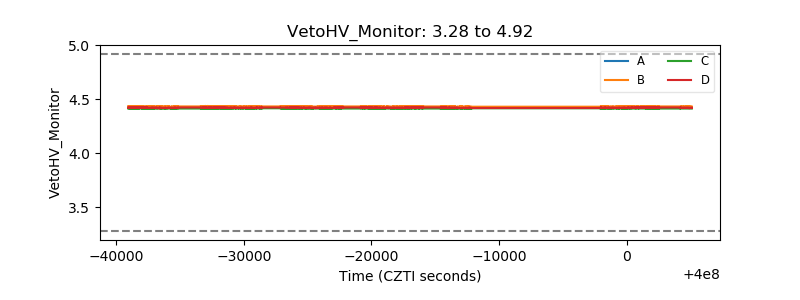 |
| Veto LLD | 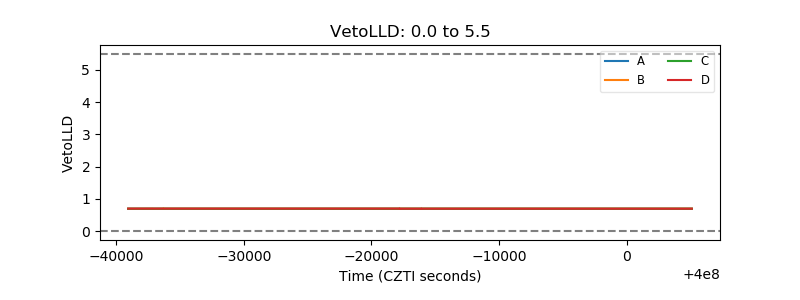 |
| Alpha Counter | 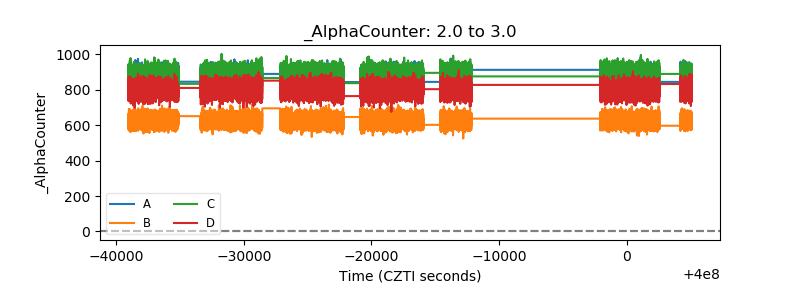 |
| _CPM_Rate | 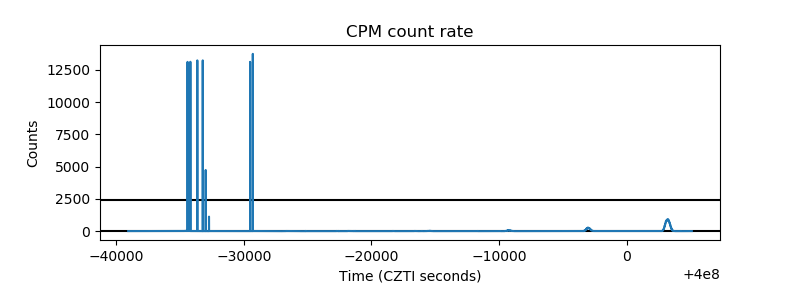 |
| CZT Counter | 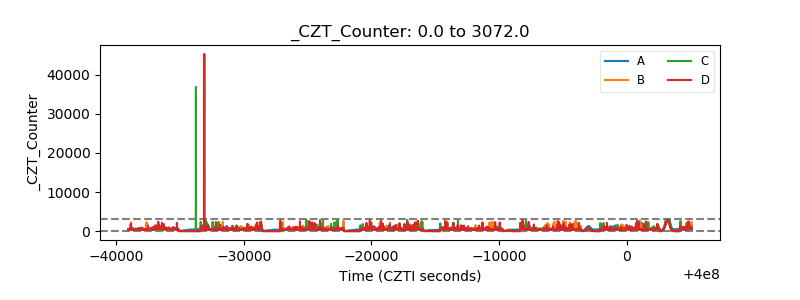 |
| +2.5 Volts monitor | 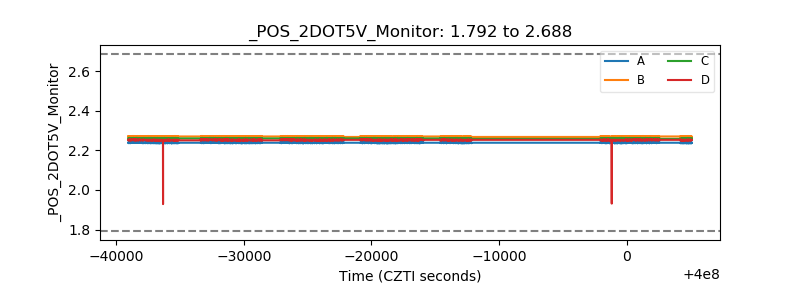 |
| +5 Volts monitor | 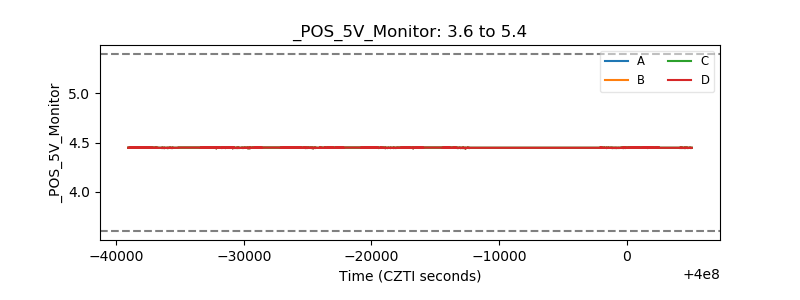 |
| _ROLL_ROT | 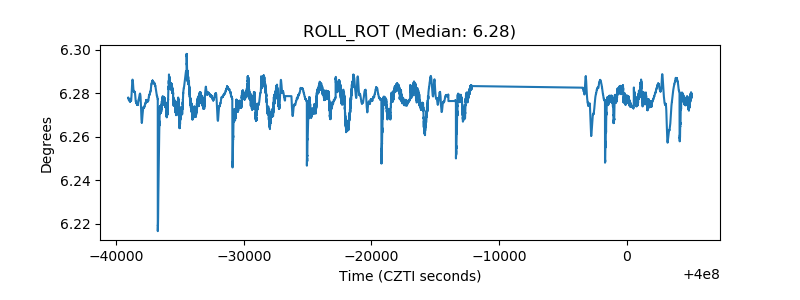 |
| _Roll_DEC | 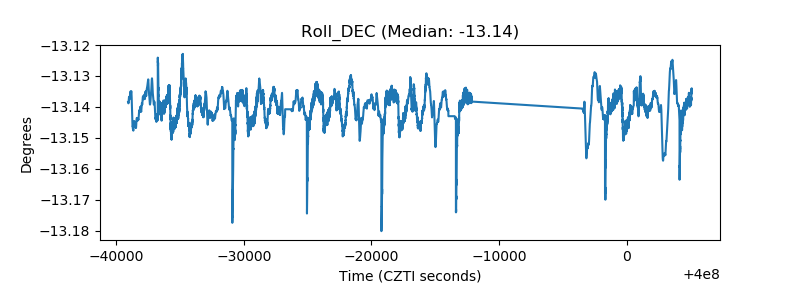 |
| _Roll_RA | 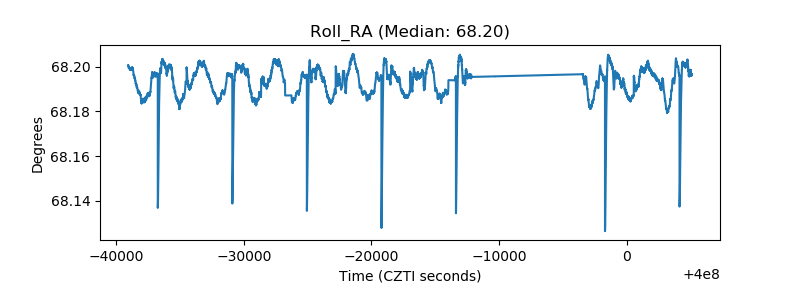 |
| Veto Counter | 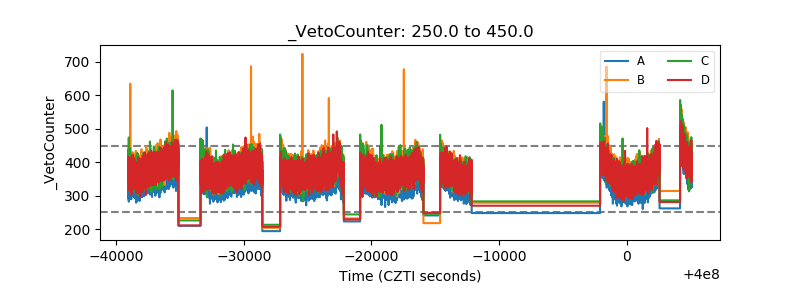 |