| Param | Original file | Final file |
|---|---|---|
| Filename | modeM0/AS1A11_030T02_9000005328_37503cztM0_level2.evt | modeM0/AS1A11_030T02_9000005328_37503cztM0_level2_quad_clean.evt |
| Size (bytes) | 486,498,240 | 70,145,280 |
| Size | 464.0 MB | 66.9 MB |
| Events in quadrant A | 2,961,339 | 464,794 |
| Events in quadrant B | 3,329,566 | 447,569 |
| Events in quadrant C | 3,201,540 | 426,771 |
| Events in quadrant D | 4,872,796 | 404,530 |
| Mode M9 | |||
|---|---|---|---|
| Quadrant | BADHDUFLAG | Total packets | Discarded packets |
| A | 0 | 34 | 0 |
| B | 0 | 34 | 0 |
| C | 0 | 34 | 0 |
| D | 0 | 34 | 0 |
| Mode M0 | |||
|---|---|---|---|
| Quadrant | BADHDUFLAG | Total packets | Discarded packets |
| A | 0 | 12236 | 6 |
| B | 0 | 13302 | 10 |
| C | 0 | 12835 | 3 |
| D | 0 | 18214 | 10 |
| Mode SS | |||
|---|---|---|---|
| Quadrant | BADHDUFLAG | Total packets | Discarded packets |
| A | 0 | 112 | 0 |
| B | 0 | 112 | 0 |
| C | 0 | 112 | 0 |
| D | 0 | 112 | 0 |
| Quadrant | Total seconds | Saturated seconds | Saturation percentage |
|---|---|---|---|
| A | 5433 | 24 | 0.441745% |
| B | 5433 | 196 | 3.607583% |
| C | 5434 | 103 | 1.895473% |
| D | 5432 | 458 | 8.431517% |
Noise dominated data is calculated using 1-second bins in cleaned event files. If a bin has >2000 counts, and if more than 50% of those come from <1% of pixels, then it is considered to be noise-dominated and hence unusable.
| Quadrant | # 1 sec bins | Bins with >0 counts | Bins with >2000 counts | High rate bins dominated by noise | Noise dominated (total time) | Noise dominated (detector-on time) | Marked lightcurve |
|---|---|---|---|---|---|---|---|
| A | 8811 | 5437 | 11 | 11 | 0.12% | 0.20% | 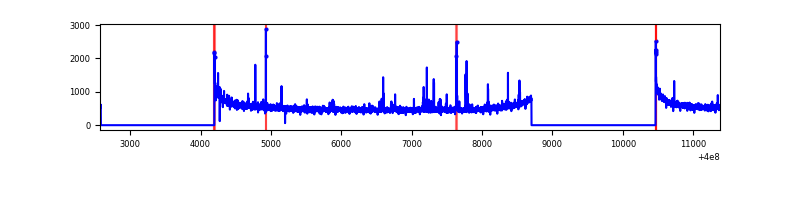 |
| B | 8811 | 5436 | 131 | 131 | 1.49% | 2.41% | 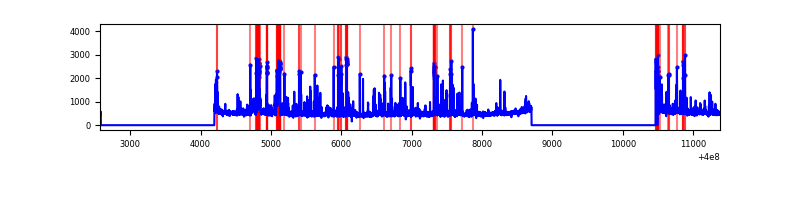 |
| C | 8811 | 5437 | 78 | 78 | 0.89% | 1.43% | 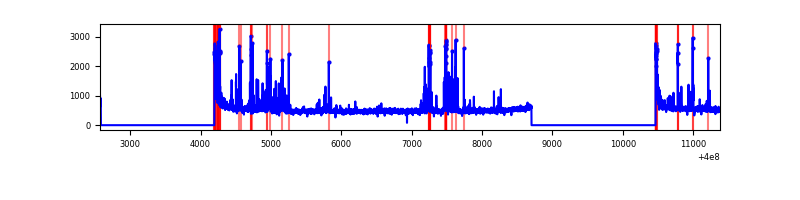 |
| D | 8811 | 5436 | 460 | 460 | 5.22% | 8.46% | 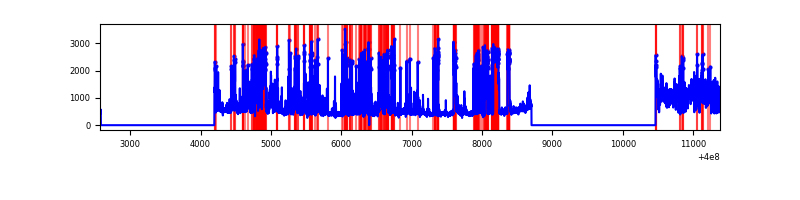 |
Top three noisy pixels from each quadrant. If the there are fewer than three noisy pixels in the level2.evt file, extra rows are filled as -1
| Pixel properties | Quadrant properties | ||||||
|---|---|---|---|---|---|---|---|
| Quadrant | DetID | PixID | Counts | Sigma | Mean | Median | Sigma |
| A | 10 | 83 | 307224 | 2297.42 | 651 | 639 | 133.4 |
| A | 6 | 10 | 37916 | 279.34 | 651 | 639 | 133.4 |
| A | 15 | 222 | 27764 | 203.26 | 651 | 639 | 133.4 |
| B | 5 | 172 | 338492 | 2792.44 | 634 | 618 | 121.0 |
| B | 15 | 35 | 163293 | 1344.46 | 634 | 618 | 121.0 |
| B | 5 | 255 | 117498 | 965.98 | 634 | 618 | 121.0 |
| C | 14 | 254 | 328846 | 2260.28 | 623 | 628 | 145.2 |
| C | 15 | 214 | 230623 | 1583.87 | 623 | 628 | 145.2 |
| C | 0 | 10 | 94078 | 643.55 | 623 | 628 | 145.2 |
| D | 13 | 249 | 1236673 | 8136.38 | 611 | 593 | 151.9 |
| D | 1 | 52 | 580182 | 3815.09 | 611 | 593 | 151.9 |
| D | 2 | 249 | 280005 | 1839.2 | 611 | 593 | 151.9 |
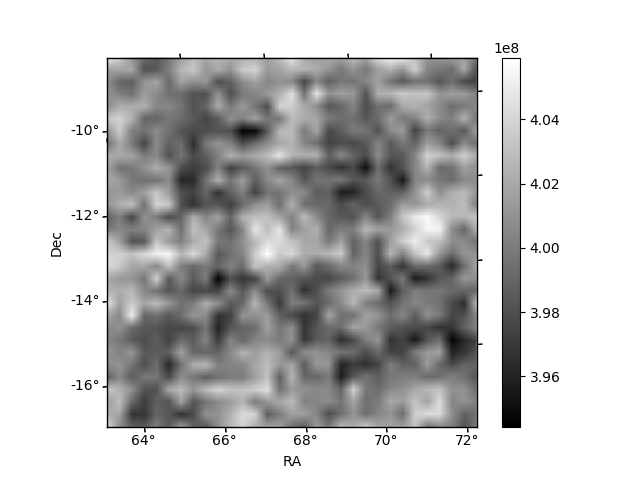
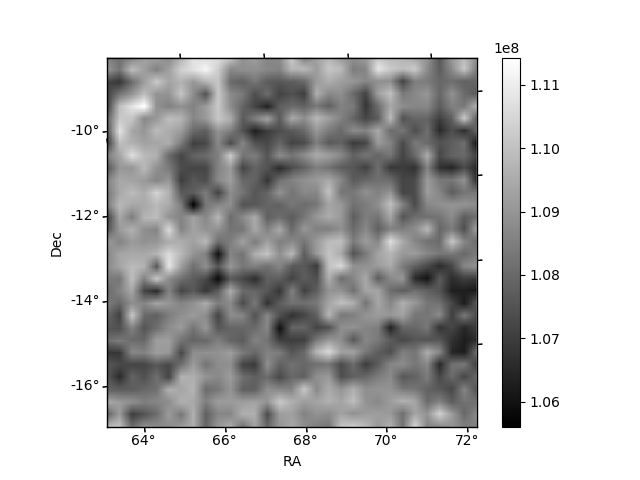
Histogram calculated using DETX and DETY for each event in the final _common_clean file
| Quadrant A | 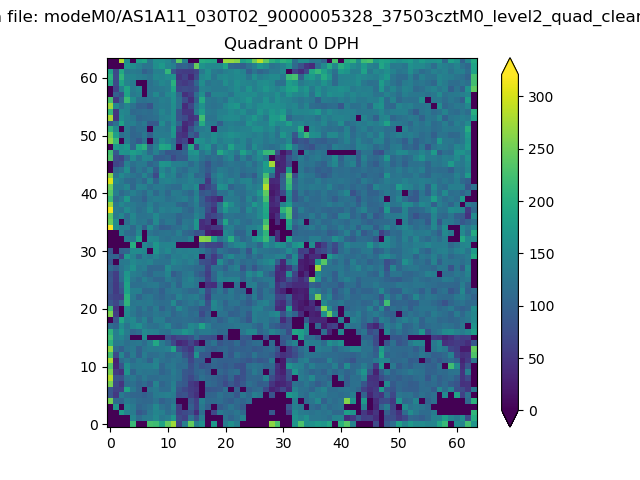 |
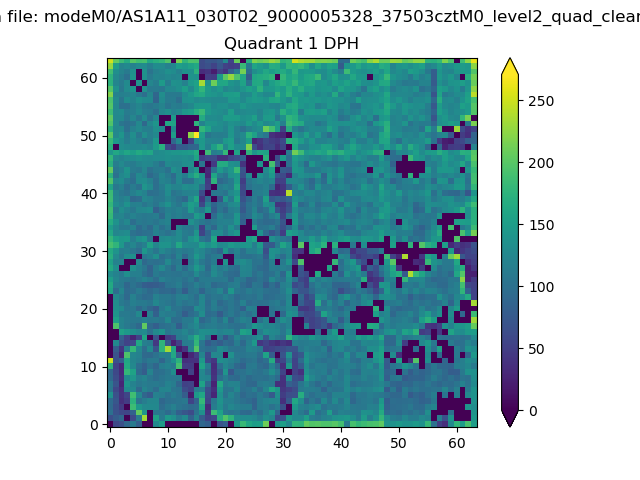 |
Quadrant B |
|---|---|---|---|
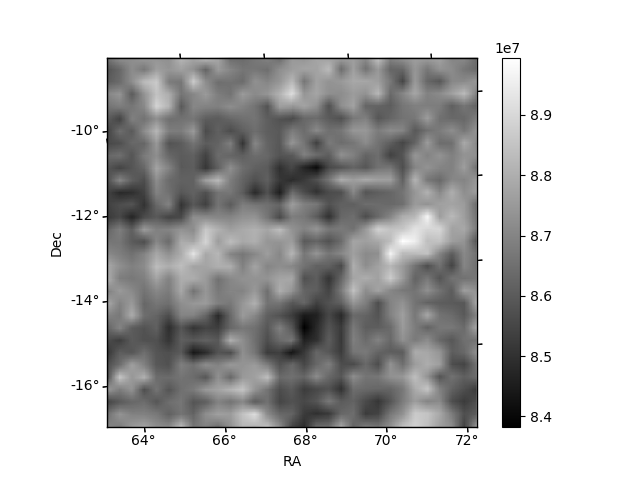
| Quadrant D | 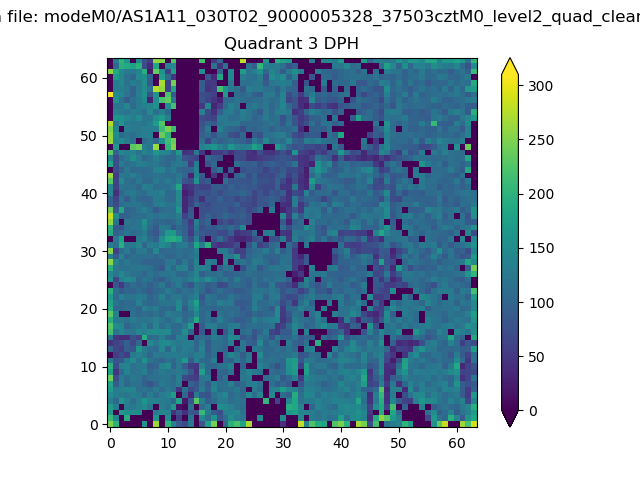 |
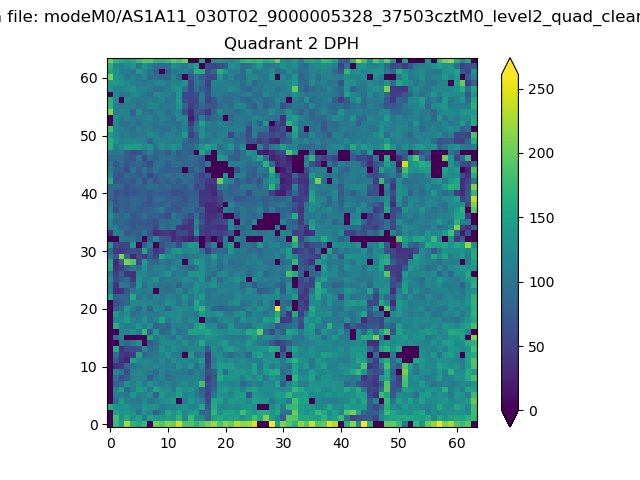 |
Quadrant C |
| Plot type | Count rate plots | Images |
|---|---|---|
| Comparison with Poisson distribution Blue bars denote a histogram of data divided into 1 sec bins. Red curve is a Poisson curve with rate = median count rate of data. |
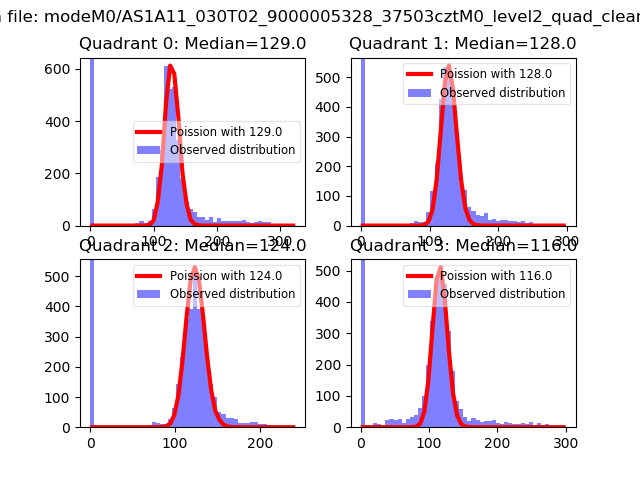 |
 |
| Quadrant-wise count rates Data is divided into 100 sec bins |
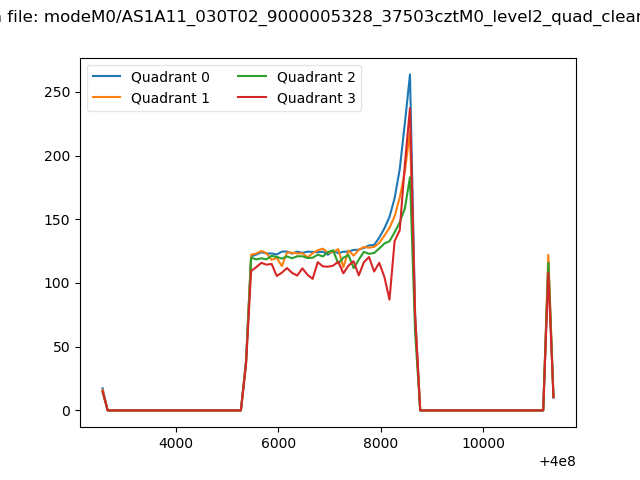 |
|
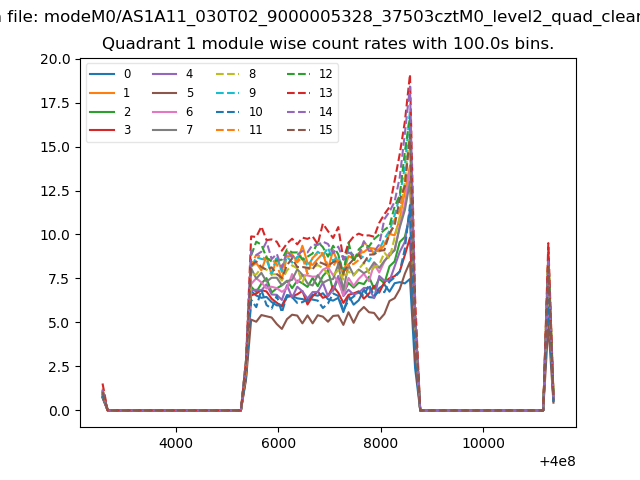
| Module-wise count rates for Quadrant A Data is divided into 100 sec bins |
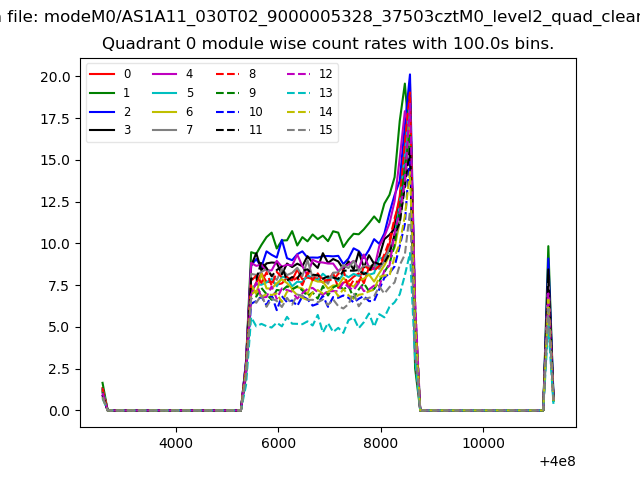 |
 |
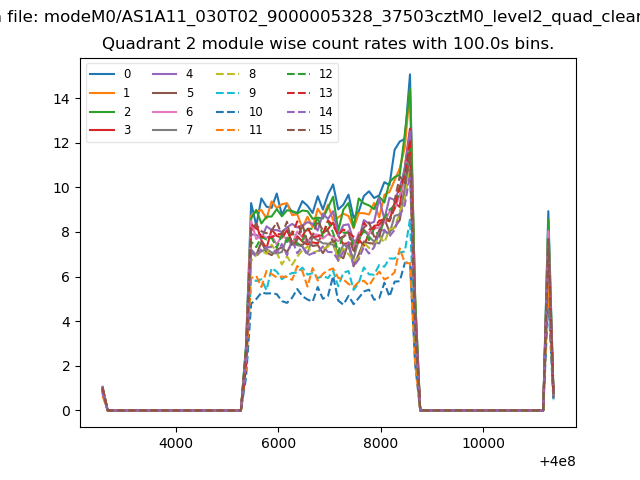
| Module-wise count rates for Quadrant B Data is divided into 100 sec bins |
 |
 |
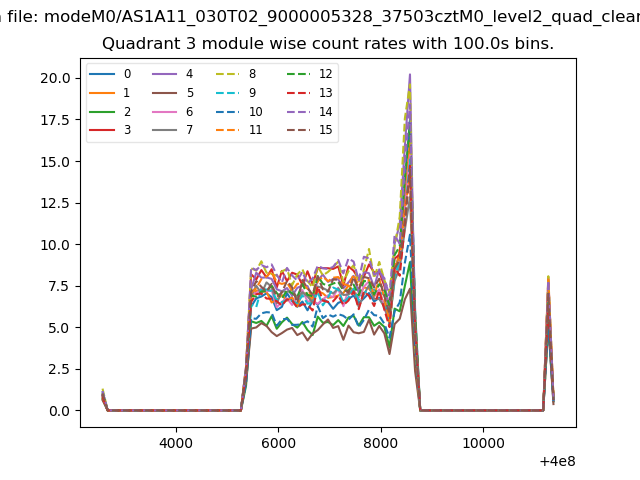
| Module-wise count rates for Quadrant C Data is divided into 100 sec bins |
 |
 |
| Module-wise count rates for Quadrant D Data is divided into 100 sec bins |
 |
 |
| Parameter | Plot |
|---|---|
| CZT HV Monitor | 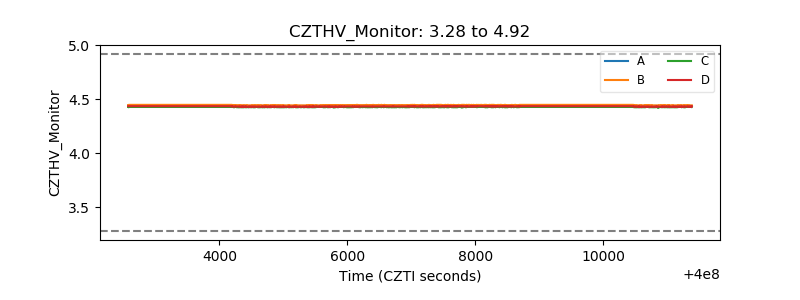 |
| D_VDD | 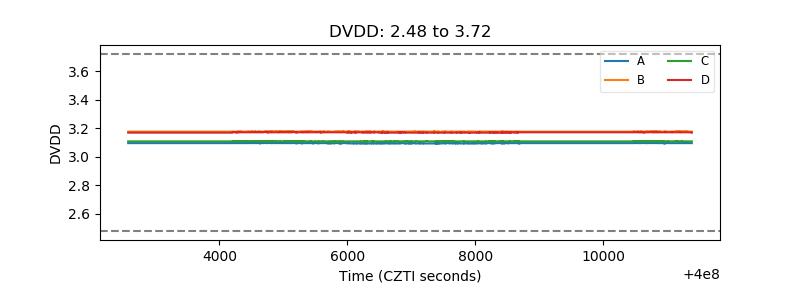 |
| Temperature 1 | 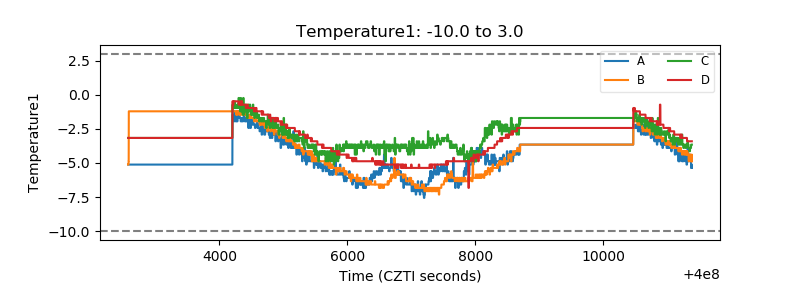 |
| Veto HV Monitor | 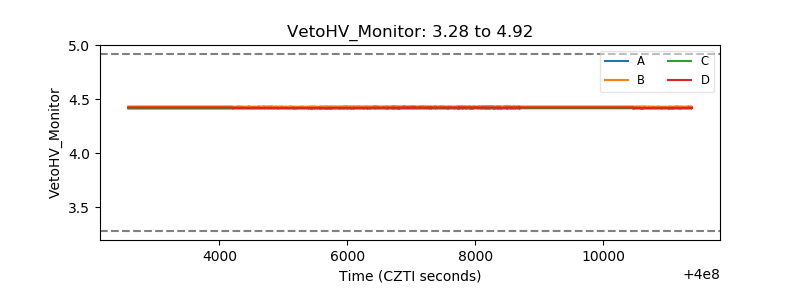 |
| Veto LLD | 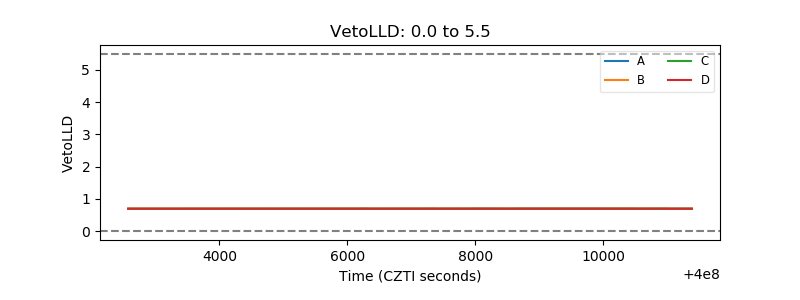 |
| Alpha Counter |  |
| _CPM_Rate | 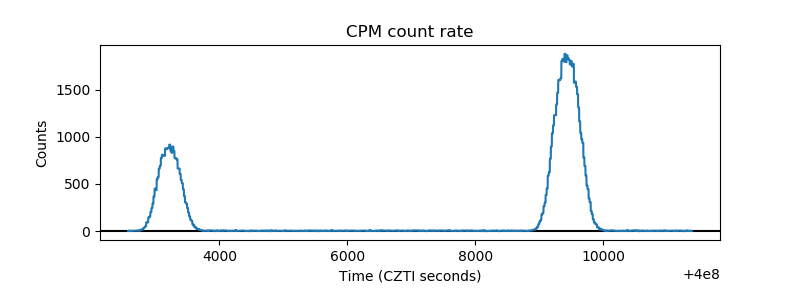 |
| CZT Counter | 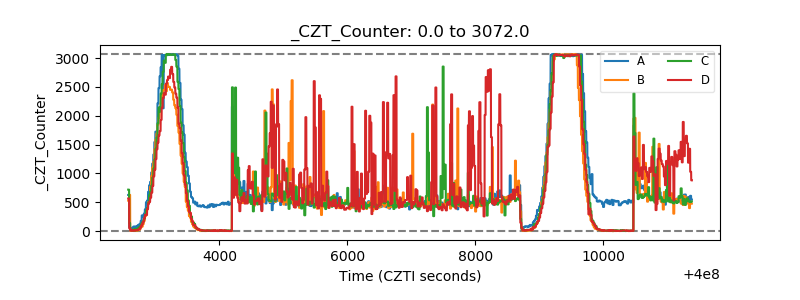 |
| +2.5 Volts monitor | 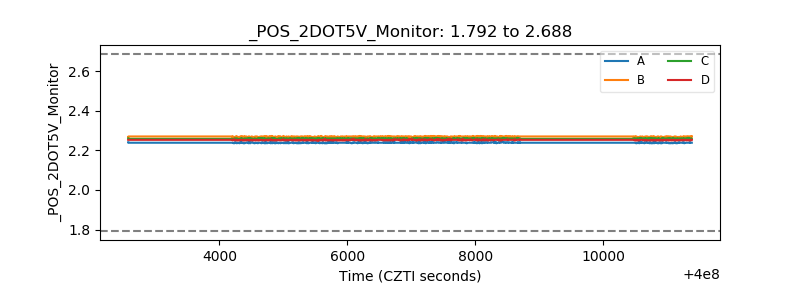 |
| +5 Volts monitor | 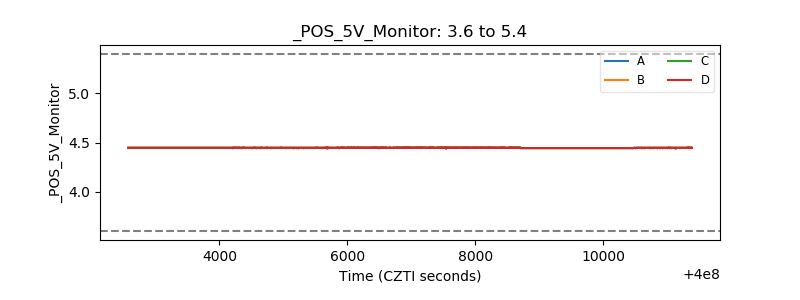 |
| _ROLL_ROT |  |
| _Roll_DEC | 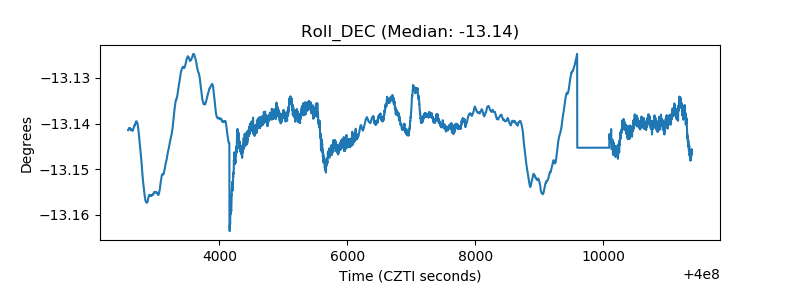 |
| _Roll_RA | 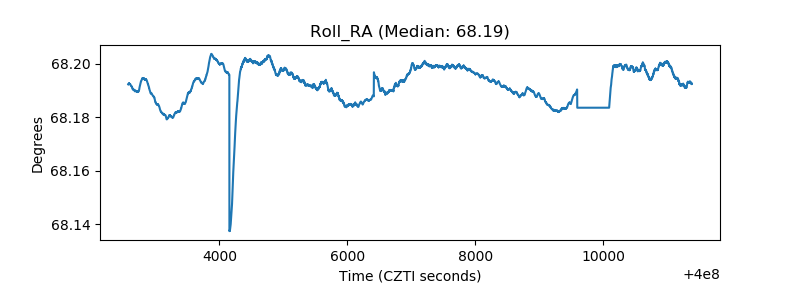 |
| Veto Counter |  |