| Param | Original file | Final file |
|---|---|---|
| Filename | modeM0/AS1A11_030T02_9000005328_37504cztM0_level2.evt | modeM0/AS1A11_030T02_9000005328_37504cztM0_level2_quad_clean.evt |
| Size (bytes) | 459,777,600 | 78,940,800 |
| Size | 438.5 MB | 75.3 MB |
| Events in quadrant A | 2,783,278 | 521,456 |
| Events in quadrant B | 3,225,658 | 518,327 |
| Events in quadrant C | 3,024,310 | 512,347 |
| Events in quadrant D | 4,540,812 | 476,278 |
| Mode M9 | |||
|---|---|---|---|
| Quadrant | BADHDUFLAG | Total packets | Discarded packets |
| A | 0 | 22 | 0 |
| B | 0 | 22 | 0 |
| C | 0 | 22 | 0 |
| D | 0 | 23 | 0 |
| Mode M0 | |||
|---|---|---|---|
| Quadrant | BADHDUFLAG | Total packets | Discarded packets |
| A | 0 | 11456 | 5 |
| B | 0 | 12846 | 8 |
| C | 0 | 12101 | 4 |
| D | 0 | 17038 | 42 |
| Mode SS | |||
|---|---|---|---|
| Quadrant | BADHDUFLAG | Total packets | Discarded packets |
| A | 0 | 106 | 0 |
| B | 0 | 106 | 0 |
| C | 0 | 106 | 0 |
| D | 0 | 106 | 0 |
| Quadrant | Total seconds | Saturated seconds | Saturation percentage |
|---|---|---|---|
| A | 5168 | 20 | 0.386997% |
| B | 5166 | 187 | 3.619822% |
| C | 5167 | 78 | 1.509580% |
| D | 5159 | 211 | 4.089940% |
Noise dominated data is calculated using 1-second bins in cleaned event files. If a bin has >2000 counts, and if more than 50% of those come from <1% of pixels, then it is considered to be noise-dominated and hence unusable.
| Quadrant | # 1 sec bins | Bins with >0 counts | Bins with >2000 counts | High rate bins dominated by noise | Noise dominated (total time) | Noise dominated (detector-on time) | Marked lightcurve |
|---|---|---|---|---|---|---|---|
| A | 7052 | 5170 | 8 | 8 | 0.11% | 0.15% |  |
| B | 7052 | 5169 | 148 | 148 | 2.10% | 2.86% | 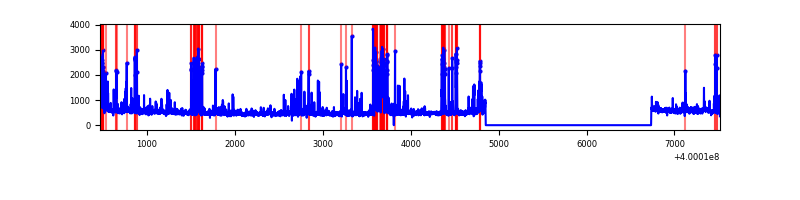 |
| C | 7052 | 5170 | 65 | 65 | 0.92% | 1.26% | 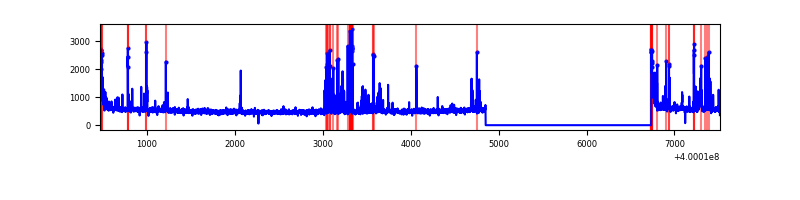 |
| D | 7052 | 5167 | 193 | 193 | 2.74% | 3.74% | 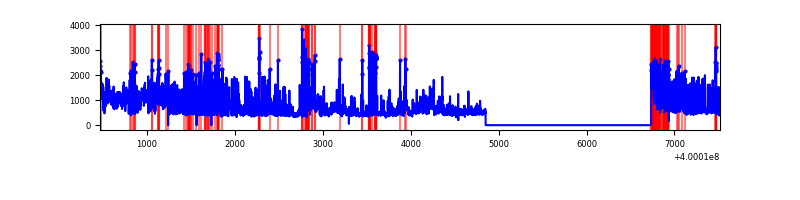 |
Top three noisy pixels from each quadrant. If the there are fewer than three noisy pixels in the level2.evt file, extra rows are filled as -1
| Pixel properties | Quadrant properties | ||||||
|---|---|---|---|---|---|---|---|
| Quadrant | DetID | PixID | Counts | Sigma | Mean | Median | Sigma |
| A | 10 | 83 | 294031 | 2336.18 | 621 | 610 | 125.6 |
| A | 6 | 10 | 35615 | 278.71 | 621 | 610 | 125.6 |
| A | 15 | 222 | 30630 | 239.02 | 621 | 610 | 125.6 |
| B | 5 | 172 | 388026 | 3314.04 | 612 | 595 | 116.9 |
| B | 5 | 255 | 237843 | 2029.39 | 612 | 595 | 116.9 |
| B | 0 | 190 | 45974 | 388.17 | 612 | 595 | 116.9 |
| C | 14 | 254 | 314867 | 2215.03 | 608 | 613 | 141.9 |
| C | 15 | 214 | 221204 | 1554.84 | 608 | 613 | 141.9 |
| C | 0 | 10 | 87745 | 614.15 | 608 | 613 | 141.9 |
| D | 1 | 52 | 1479813 | 10079.61 | 595 | 578 | 146.8 |
| D | 13 | 249 | 412680 | 2808.09 | 595 | 578 | 146.8 |
| D | 2 | 153 | 128062 | 868.68 | 595 | 578 | 146.8 |
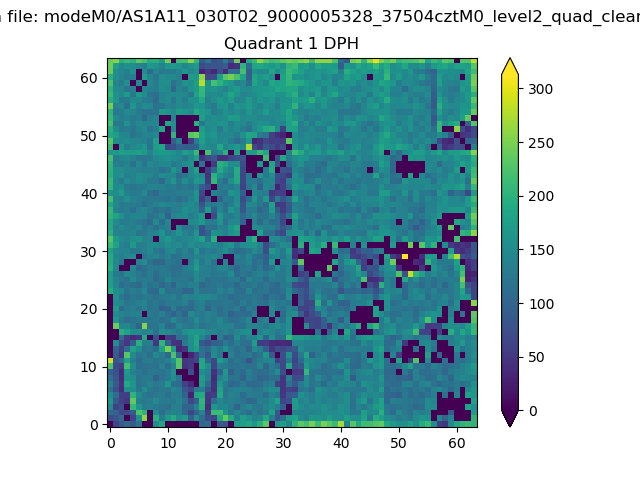
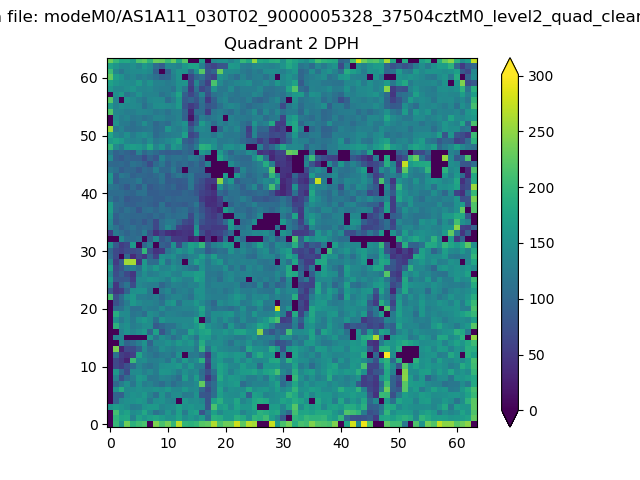
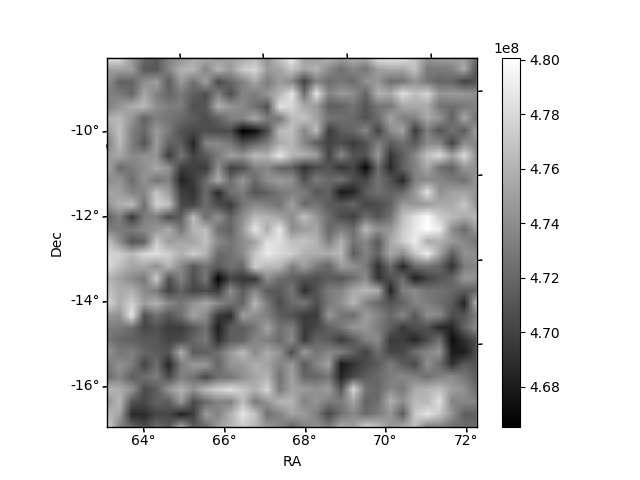
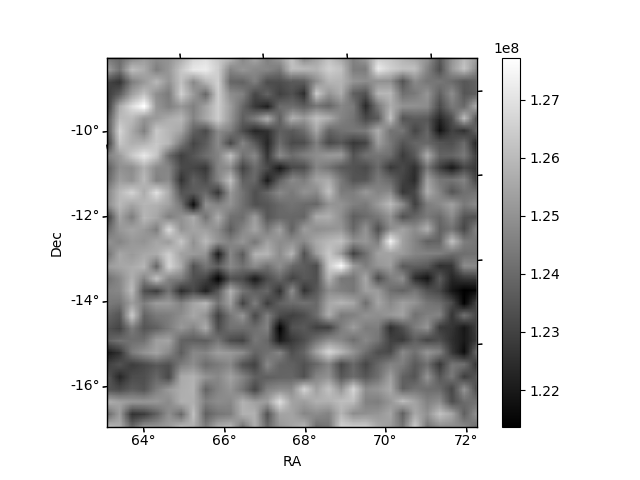
Histogram calculated using DETX and DETY for each event in the final _common_clean file
| Quadrant A | 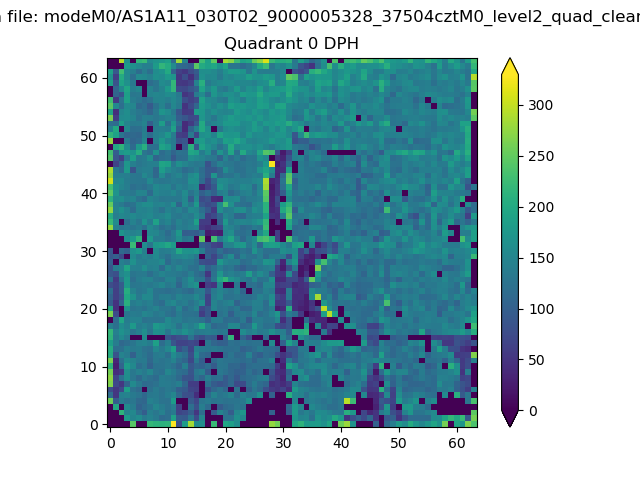 |
 |
Quadrant B |
|---|---|---|---|
| Quadrant D | 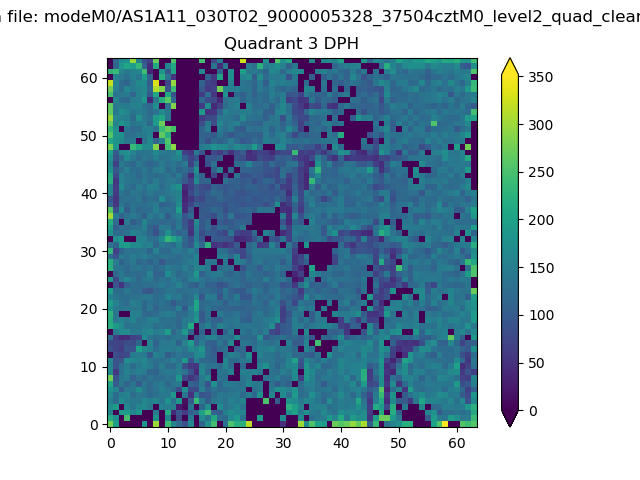 |
 |
Quadrant C |
| Plot type | Count rate plots | Images |
|---|---|---|
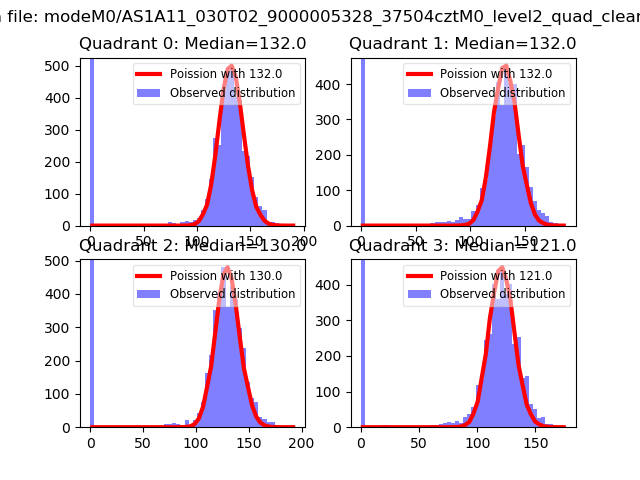
| Comparison with Poisson distribution Blue bars denote a histogram of data divided into 1 sec bins. Red curve is a Poisson curve with rate = median count rate of data. |
 |
 |
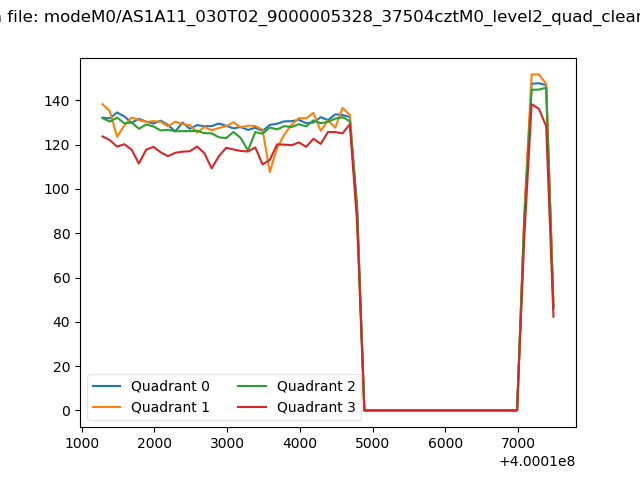
| Quadrant-wise count rates Data is divided into 100 sec bins |
 |
|
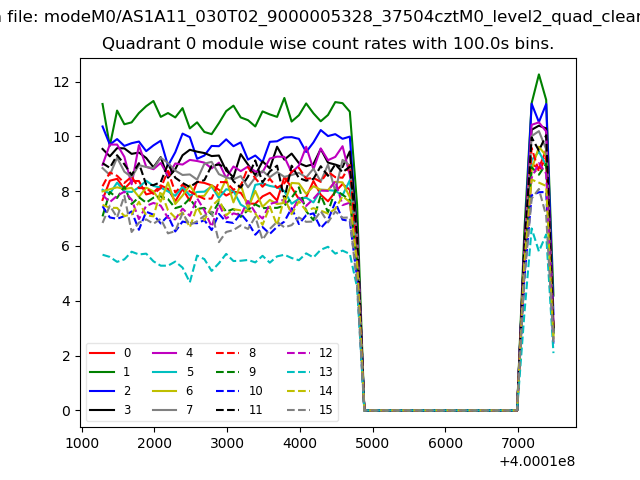
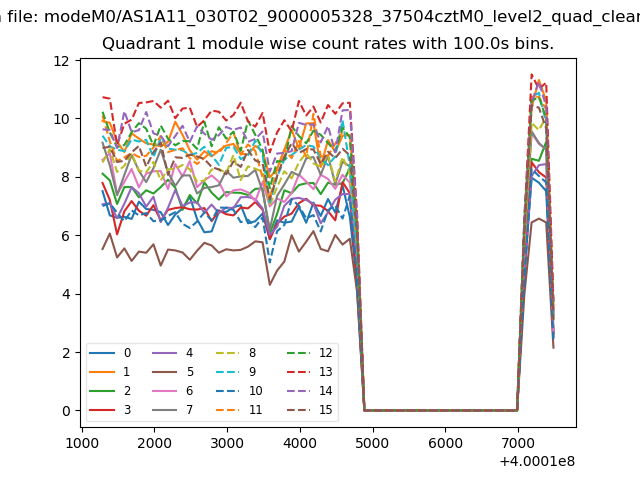
| Module-wise count rates for Quadrant A Data is divided into 100 sec bins |
 |
 |
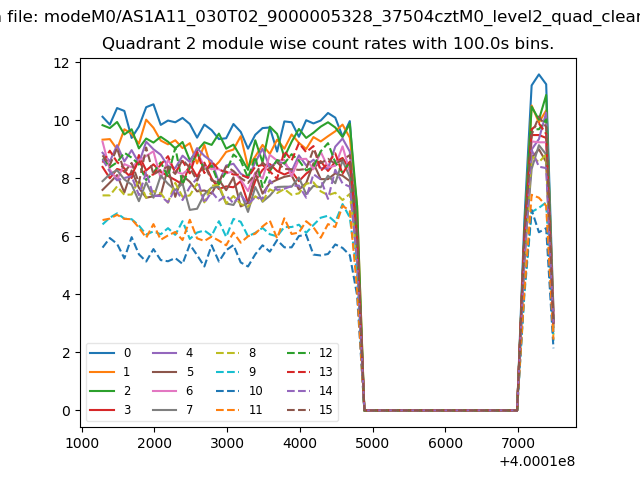
| Module-wise count rates for Quadrant B Data is divided into 100 sec bins |
 |
 |
| Module-wise count rates for Quadrant C Data is divided into 100 sec bins |
 |
 |
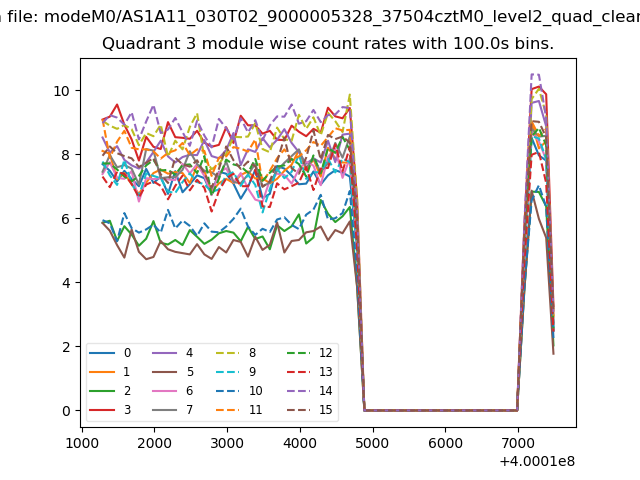
| Module-wise count rates for Quadrant D Data is divided into 100 sec bins |
 |
 |
| Parameter | Plot |
|---|---|
| CZT HV Monitor | 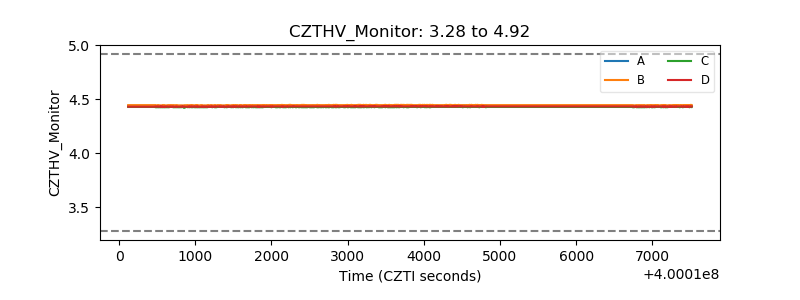 |
| D_VDD | 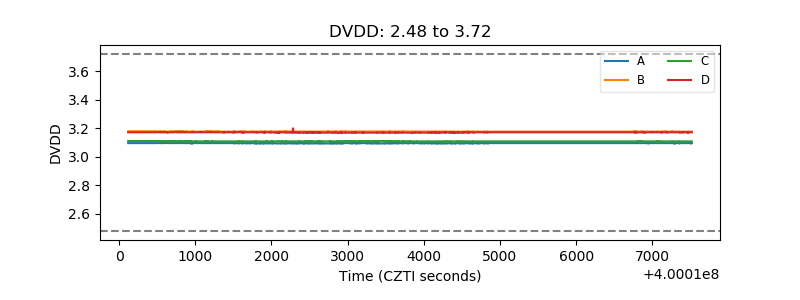 |
| Temperature 1 | 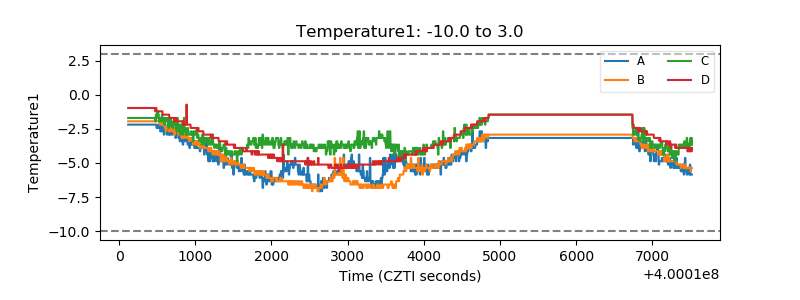 |
| Veto HV Monitor | 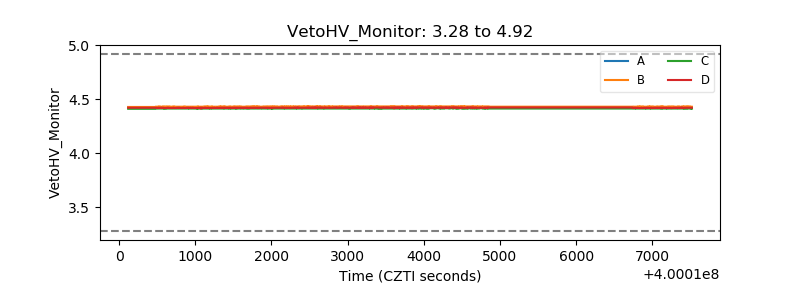 |
| Veto LLD | 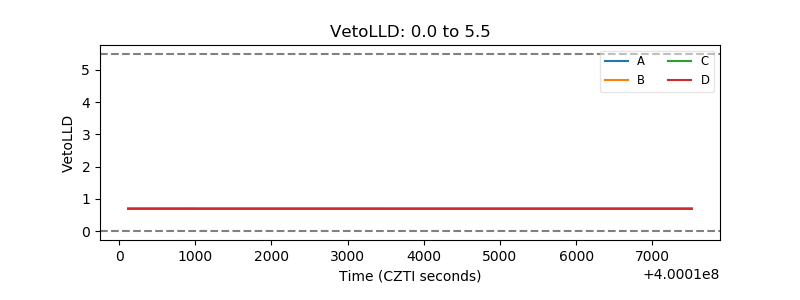 |
| Alpha Counter | 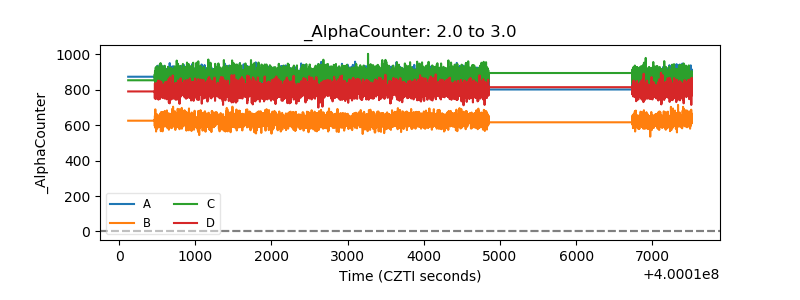 |
| _CPM_Rate | 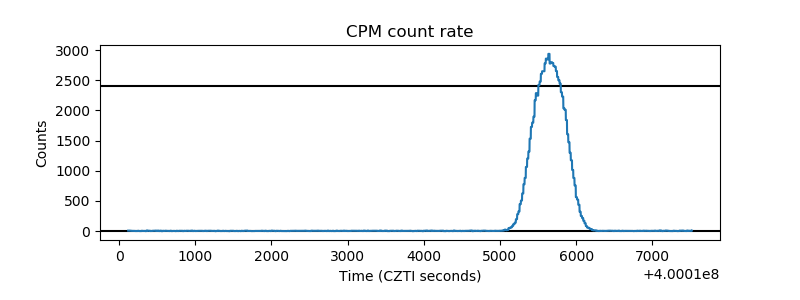 |
| CZT Counter | 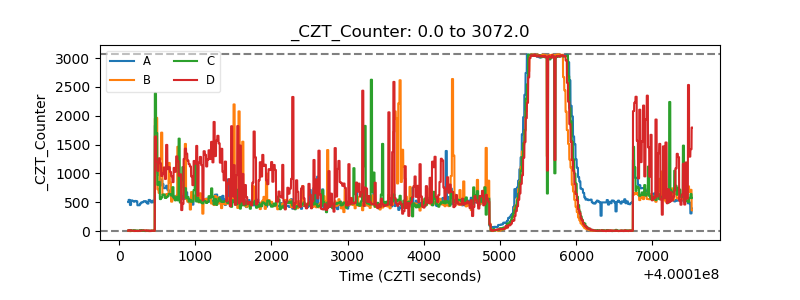 |
| +2.5 Volts monitor | 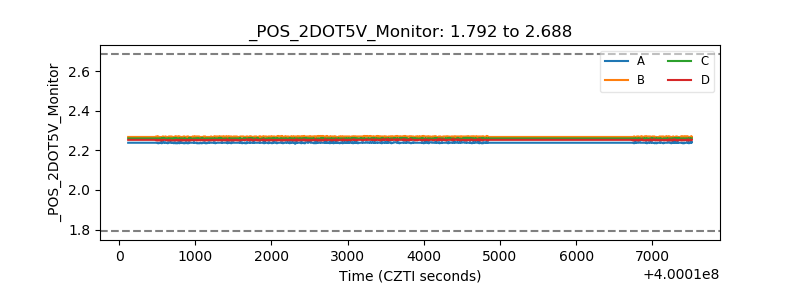 |
| +5 Volts monitor | 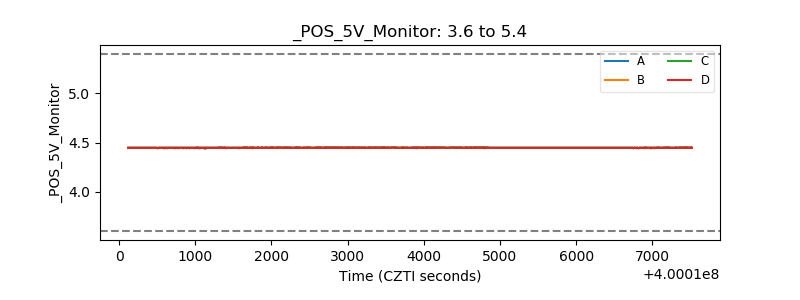 |
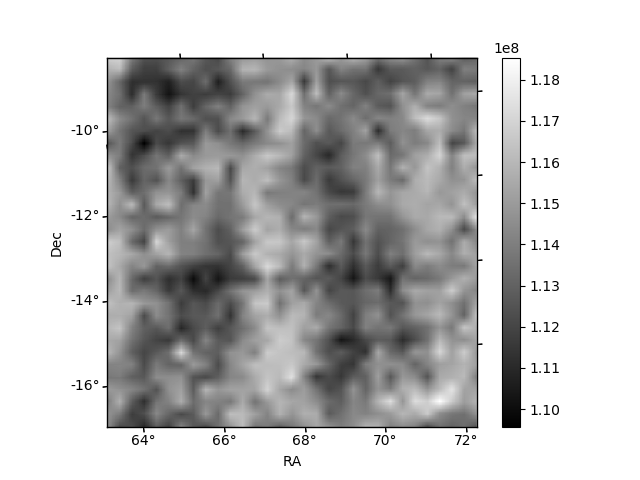
| _ROLL_ROT | 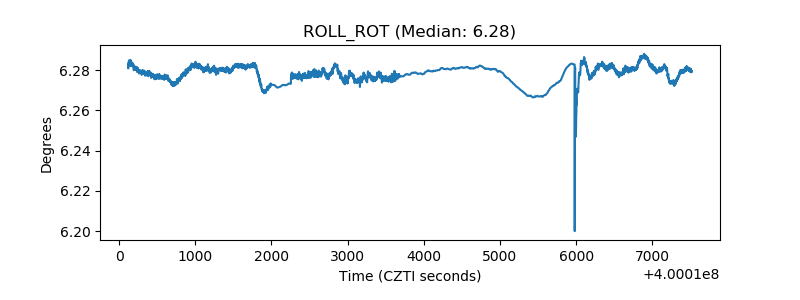 |
| _Roll_DEC | 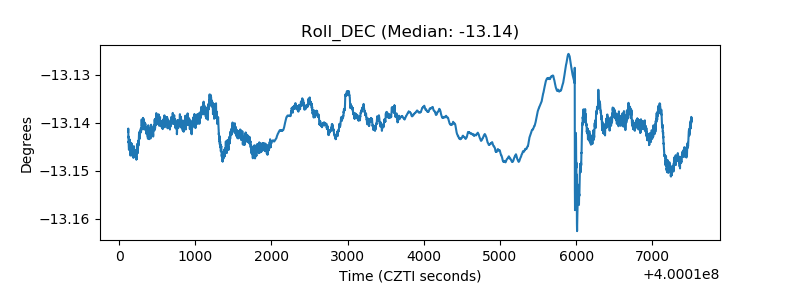 |
| _Roll_RA | 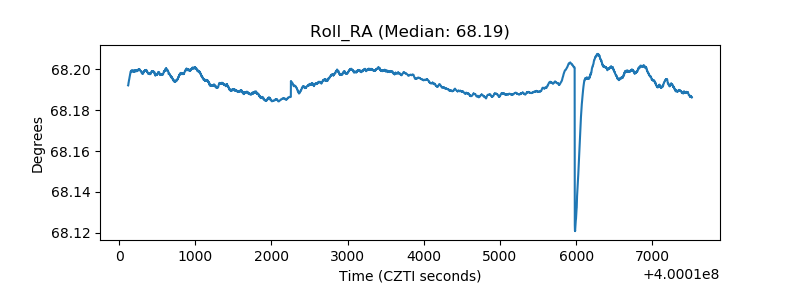 |
| Veto Counter | 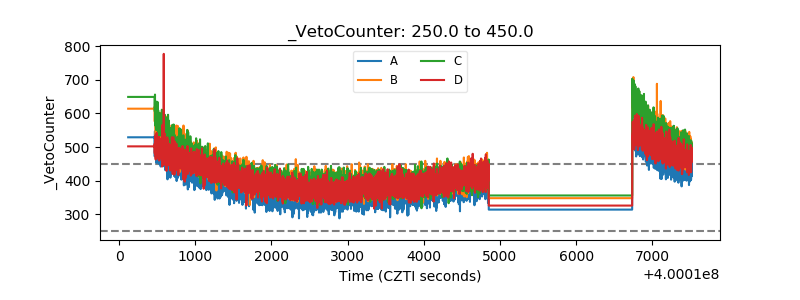 |