| Param | Original file | Final file |
|---|---|---|
| Filename | modeM0/AS1A11_030T02_9000005328_37505cztM0_level2.evt | modeM0/AS1A11_030T02_9000005328_37505cztM0_level2_quad_clean.evt |
| Size (bytes) | 393,019,200 | 77,483,520 |
| Size | 374.8 MB | 73.9 MB |
| Events in quadrant A | 2,534,963 | 531,582 |
| Events in quadrant B | 2,953,081 | 516,844 |
| Events in quadrant C | 2,835,467 | 516,249 |
| Events in quadrant D | 3,280,496 | 472,729 |
| Mode M9 | |||
|---|---|---|---|
| Quadrant | BADHDUFLAG | Total packets | Discarded packets |
| A | 0 | 24 | 0 |
| B | 0 | 25 | 0 |
| C | 0 | 25 | 0 |
| D | 0 | 26 | 0 |
| Mode M0 | |||
|---|---|---|---|
| Quadrant | BADHDUFLAG | Total packets | Discarded packets |
| A | 0 | 11206 | 928 |
| B | 0 | 13092 | 1521 |
| C | 0 | 12556 | 1488 |
| D | 0 | 14528 | 1836 |
| Mode SS | |||
|---|---|---|---|
| Quadrant | BADHDUFLAG | Total packets | Discarded packets |
| A | 0 | 98 | 6 |
| B | 0 | 99 | 1 |
| C | 0 | 98 | 6 |
| D | 0 | 98 | 3 |
| Quadrant | Total seconds | Saturated seconds | Saturation percentage |
|---|---|---|---|
| A | 4434 | 16 | 0.360848% |
| B | 4364 | 220 | 5.041247% |
| C | 4385 | 108 | 2.462942% |
| D | 4284 | 139 | 3.244631% |
Noise dominated data is calculated using 1-second bins in cleaned event files. If a bin has >2000 counts, and if more than 50% of those come from <1% of pixels, then it is considered to be noise-dominated and hence unusable.
| Quadrant | # 1 sec bins | Bins with >0 counts | Bins with >2000 counts | High rate bins dominated by noise | Noise dominated (total time) | Noise dominated (detector-on time) | Marked lightcurve |
|---|---|---|---|---|---|---|---|
| A | 6975 | 4792 | 4 | 4 | 0.06% | 0.08% | 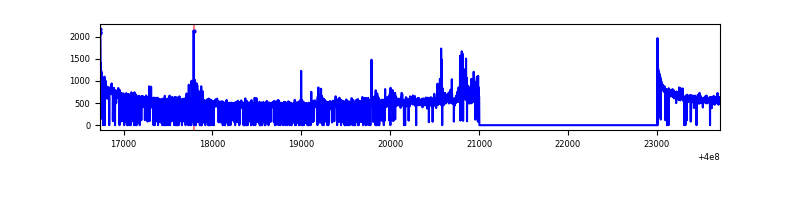 |
| B | 6975 | 4740 | 172 | 172 | 2.47% | 3.63% | 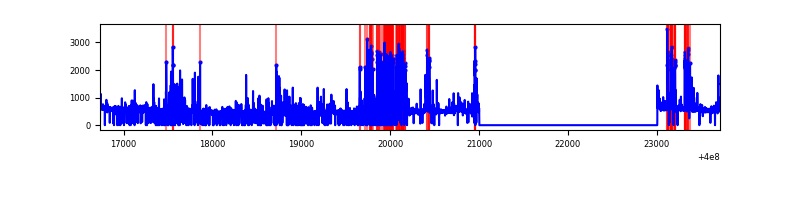 |
| C | 6975 | 4773 | 85 | 85 | 1.22% | 1.78% | 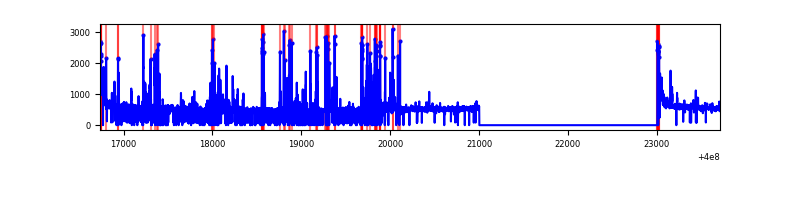 |
| D | 6975 | 4721 | 115 | 115 | 1.65% | 2.44% | 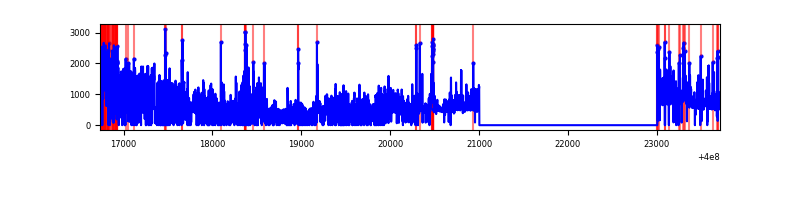 |
Top three noisy pixels from each quadrant. If the there are fewer than three noisy pixels in the level2.evt file, extra rows are filled as -1
| Pixel properties | Quadrant properties | ||||||
|---|---|---|---|---|---|---|---|
| Quadrant | DetID | PixID | Counts | Sigma | Mean | Median | Sigma |
| A | 10 | 83 | 253235 | 2293.45 | 544 | 534 | 110.2 |
| A | 15 | 222 | 128758 | 1163.73 | 544 | 534 | 110.2 |
| A | 13 | 6 | 20937 | 185.17 | 544 | 534 | 110.2 |
| B | 5 | 172 | 689970 | 6848.5 | 528 | 516 | 100.7 |
| B | 5 | 255 | 66327 | 653.72 | 528 | 516 | 100.7 |
| B | 0 | 190 | 43253 | 424.52 | 528 | 516 | 100.7 |
| C | 14 | 254 | 469673 | 3790.24 | 530 | 535 | 123.8 |
| C | 15 | 214 | 187513 | 1510.62 | 530 | 535 | 123.8 |
| C | 0 | 10 | 103297 | 830.23 | 530 | 535 | 123.8 |
| D | 1 | 52 | 841837 | 6755.5 | 509 | 496 | 124.5 |
| D | 13 | 249 | 170680 | 1366.48 | 509 | 496 | 124.5 |
| D | 2 | 153 | 123348 | 986.43 | 509 | 496 | 124.5 |
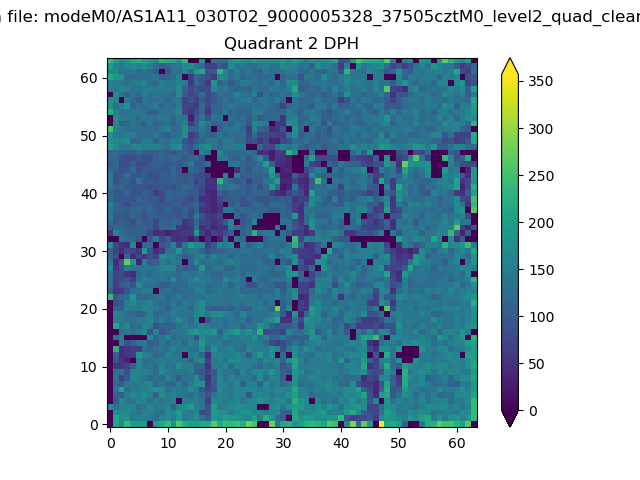
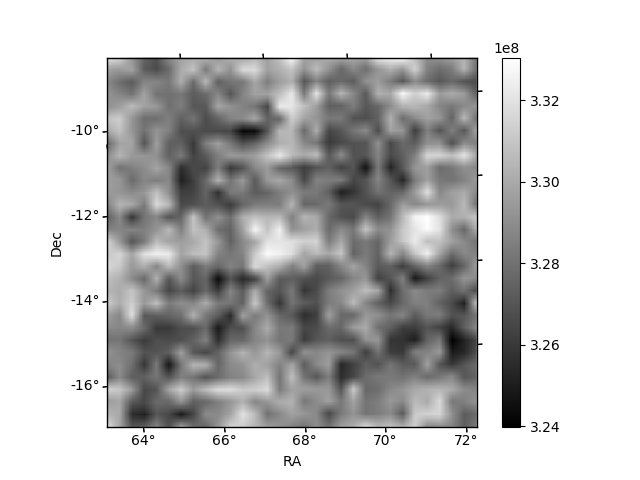
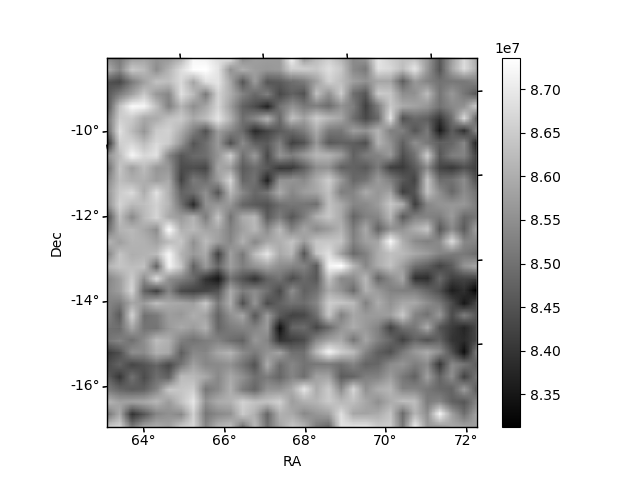
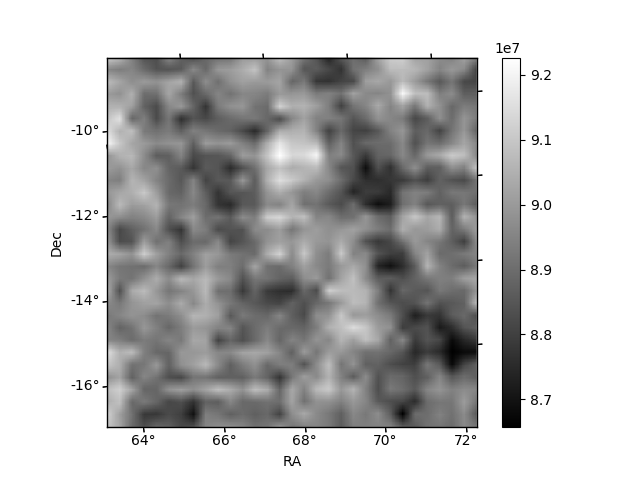
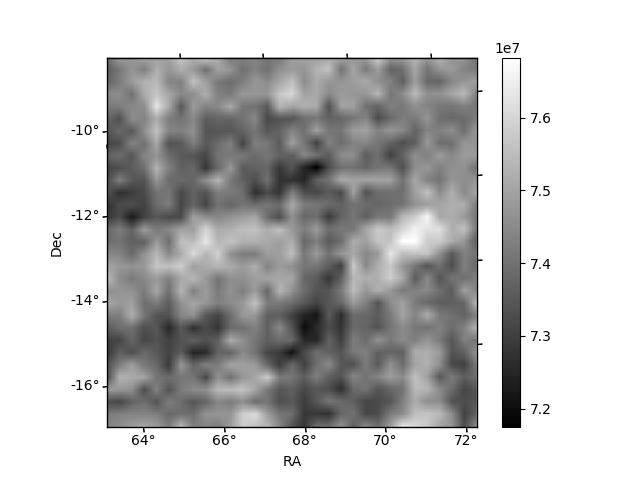
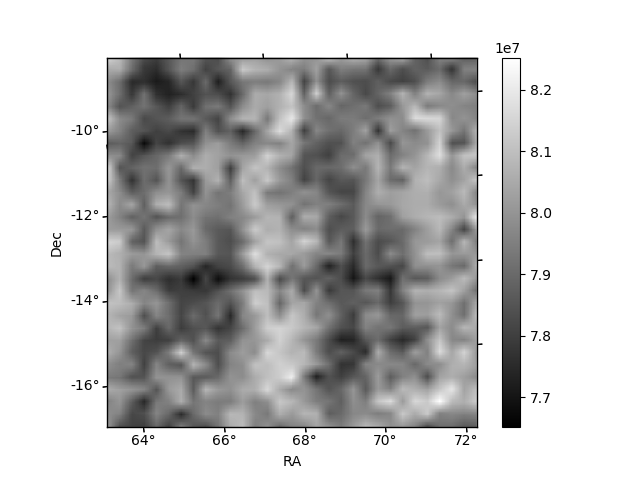
Histogram calculated using DETX and DETY for each event in the final _common_clean file
| Quadrant A | 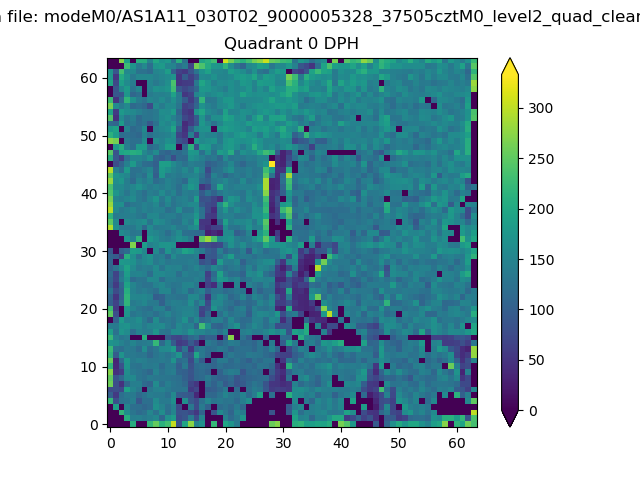 |
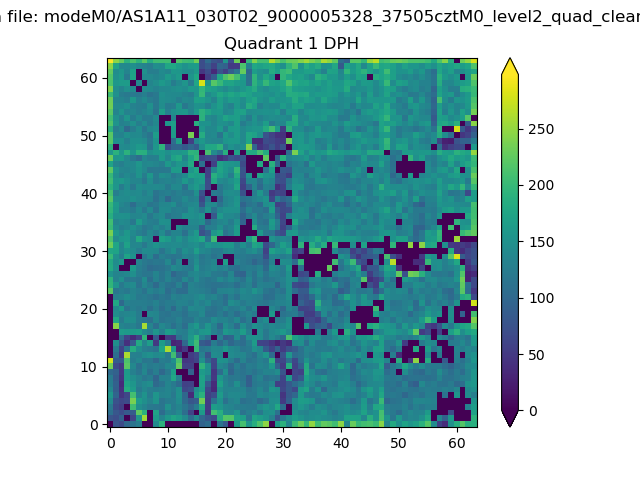 |
Quadrant B |
|---|---|---|---|
| Quadrant D | 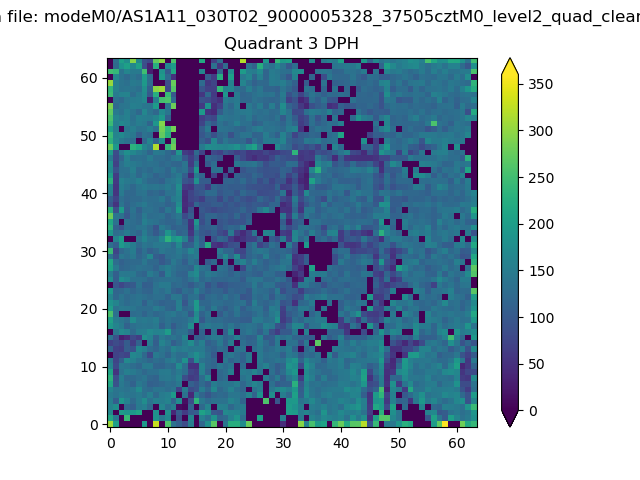 |
 |
Quadrant C |
| Plot type | Count rate plots | Images |
|---|---|---|
| Comparison with Poisson distribution Blue bars denote a histogram of data divided into 1 sec bins. Red curve is a Poisson curve with rate = median count rate of data. |
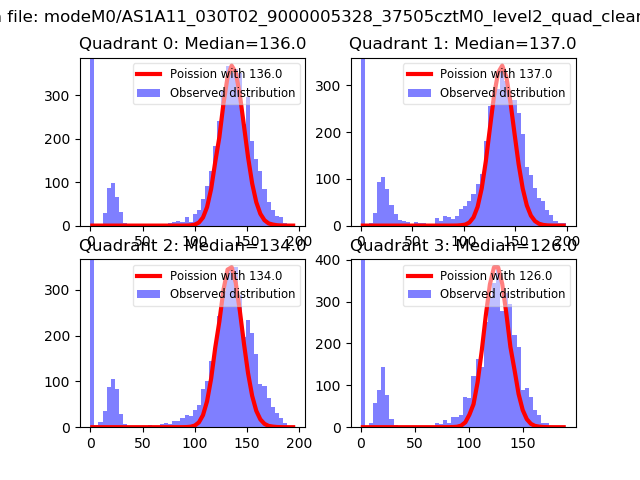 |
 |
| Quadrant-wise count rates Data is divided into 100 sec bins |
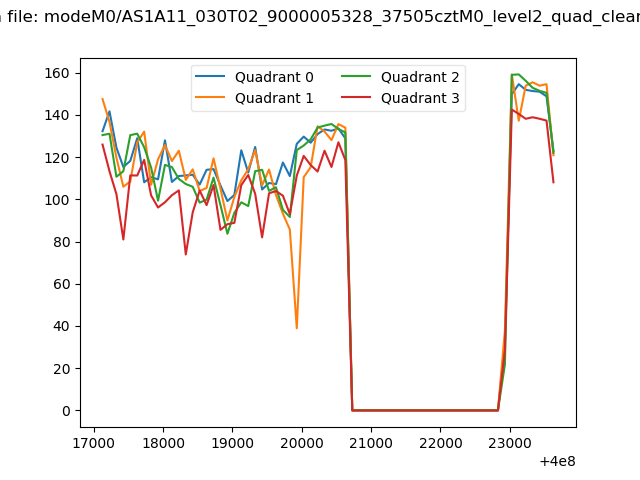 |
|
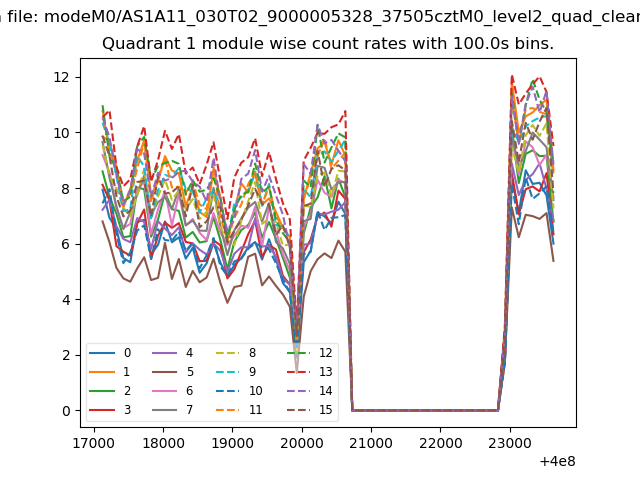
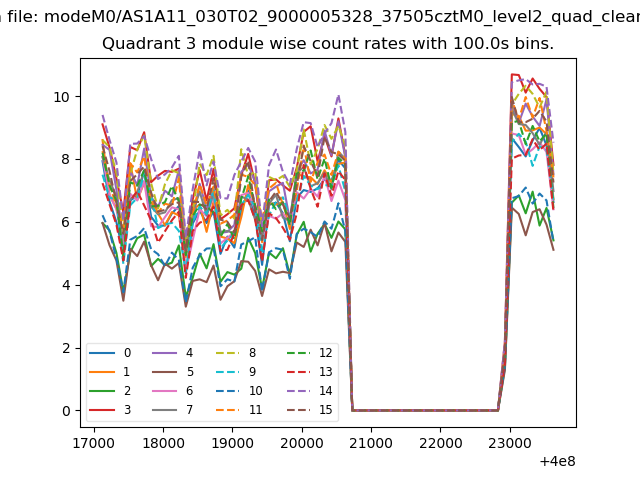
| Module-wise count rates for Quadrant A Data is divided into 100 sec bins |
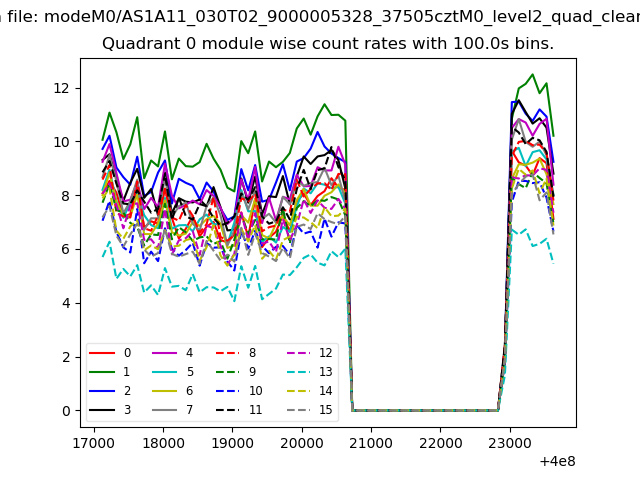 |
 |
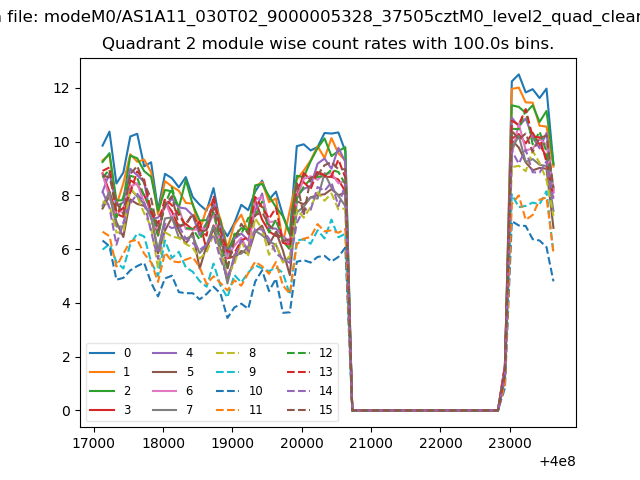
| Module-wise count rates for Quadrant B Data is divided into 100 sec bins |
 |
 |
| Module-wise count rates for Quadrant C Data is divided into 100 sec bins |
 |
 |
| Module-wise count rates for Quadrant D Data is divided into 100 sec bins |
 |
 |
| Parameter | Plot |
|---|---|
| CZT HV Monitor | 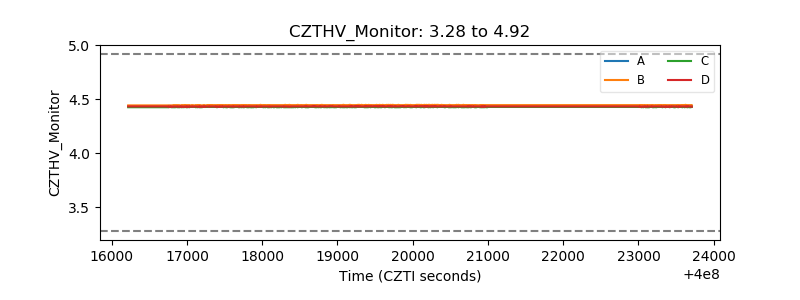 |
| D_VDD | 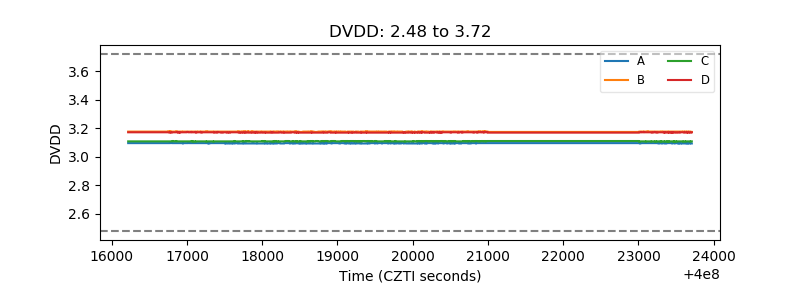 |
| Temperature 1 | 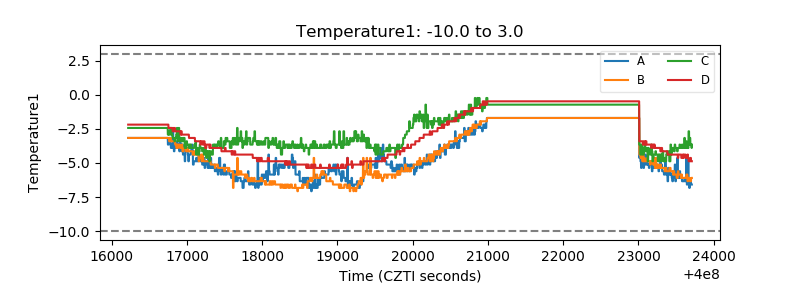 |
| Veto HV Monitor | 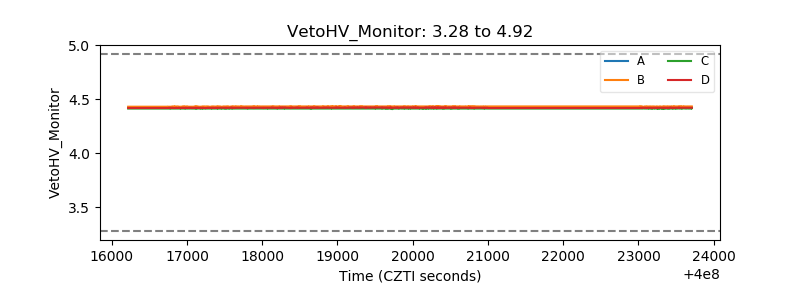 |
| Veto LLD | 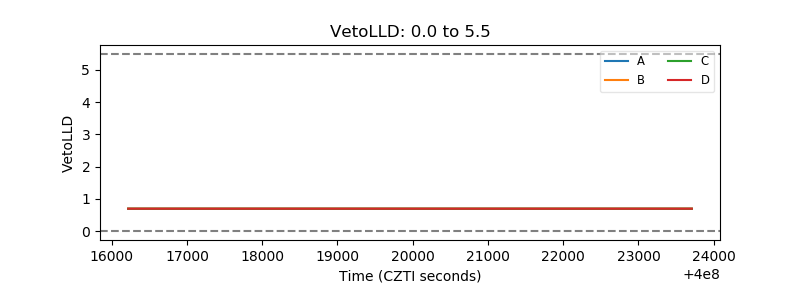 |
| Alpha Counter | 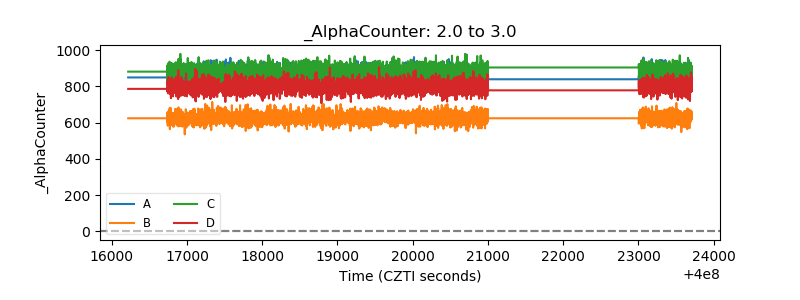 |
| _CPM_Rate | 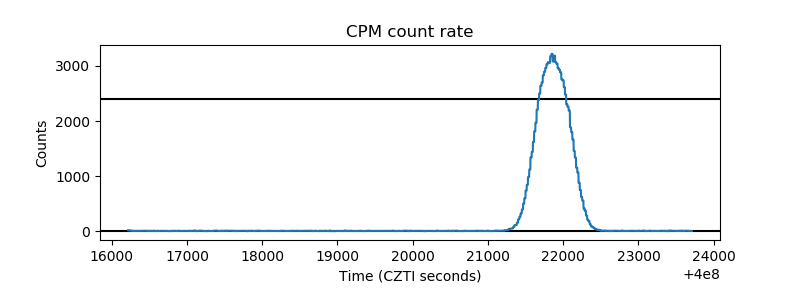 |
| CZT Counter | 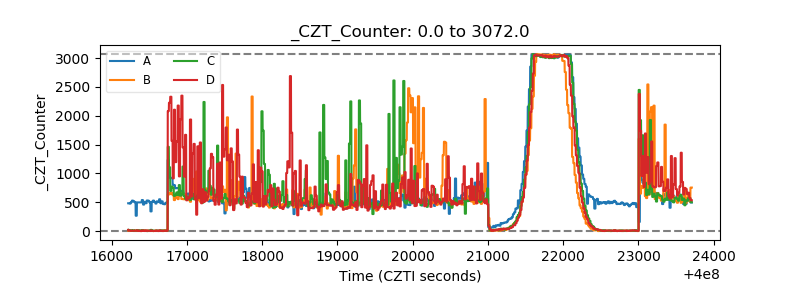 |
| +2.5 Volts monitor | 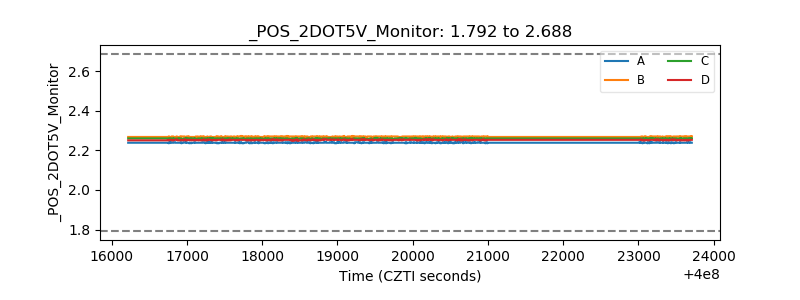 |
| +5 Volts monitor | 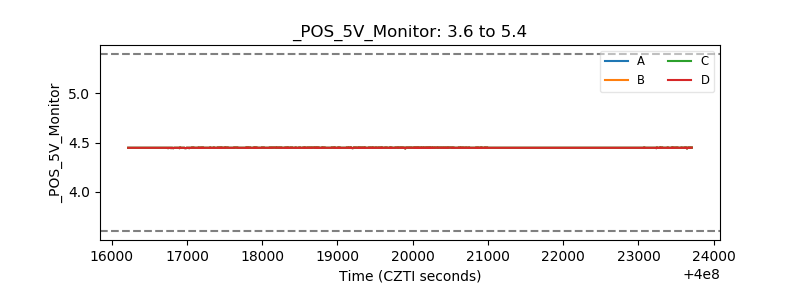 |
| _ROLL_ROT | 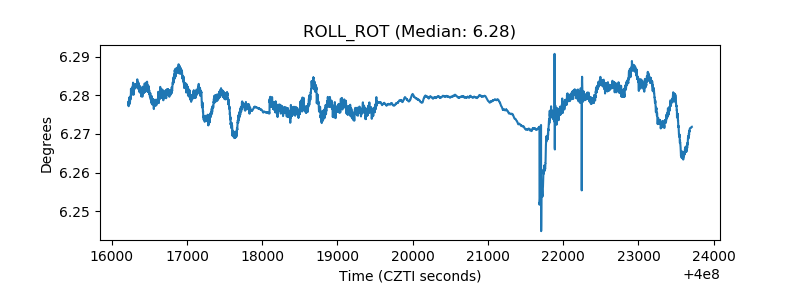 |
| _Roll_DEC | 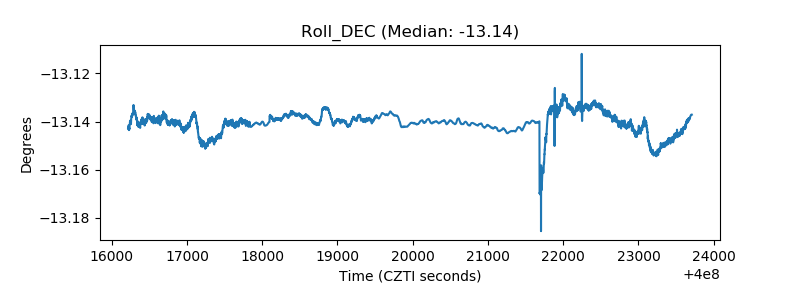 |
| _Roll_RA | 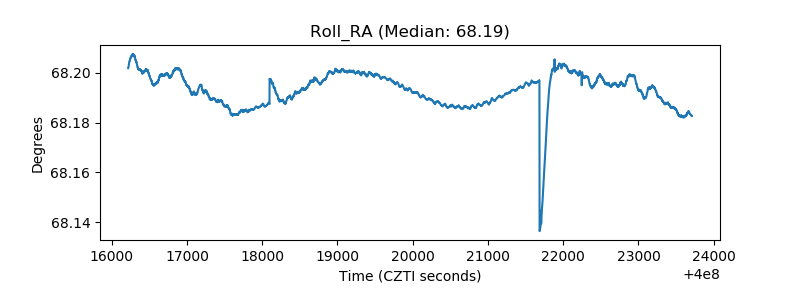 |
| Veto Counter | 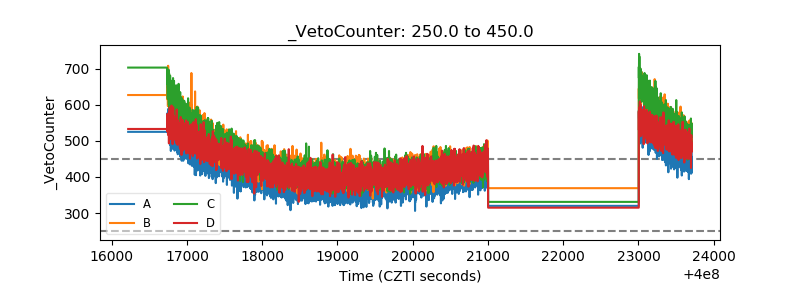 |