| Param | Original file | Final file |
|---|---|---|
| Filename | modeM0/AS1A11_030T02_9000005328_37506cztM0_level2.evt | modeM0/AS1A11_030T02_9000005328_37506cztM0_level2_quad_clean.evt |
| Size (bytes) | 486,072,000 | 90,852,480 |
| Size | 463.6 MB | 86.6 MB |
| Events in quadrant A | 2,898,188 | 618,392 |
| Events in quadrant B | 3,410,703 | 620,052 |
| Events in quadrant C | 3,176,764 | 616,820 |
| Events in quadrant D | 4,896,479 | 545,459 |
| Mode M9 | |||
|---|---|---|---|
| Quadrant | BADHDUFLAG | Total packets | Discarded packets |
| A | 0 | 28 | 0 |
| B | 0 | 28 | 0 |
| C | 0 | 28 | 0 |
| D | 0 | 29 | 0 |
| Mode M0 | |||
|---|---|---|---|
| Quadrant | BADHDUFLAG | Total packets | Discarded packets |
| A | 0 | 11747 | 3 |
| B | 0 | 13280 | 2 |
| C | 0 | 12399 | 2 |
| D | 0 | 18127 | 2 |
| Mode SS | |||
|---|---|---|---|
| Quadrant | BADHDUFLAG | Total packets | Discarded packets |
| A | 0 | 102 | 0 |
| B | 0 | 102 | 0 |
| C | 0 | 102 | 0 |
| D | 0 | 102 | 0 |
| Quadrant | Total seconds | Saturated seconds | Saturation percentage |
|---|---|---|---|
| A | 4998 | 14 | 0.280112% |
| B | 4998 | 256 | 5.122049% |
| C | 4998 | 115 | 2.300920% |
| D | 4998 | 411 | 8.223289% |
Noise dominated data is calculated using 1-second bins in cleaned event files. If a bin has >2000 counts, and if more than 50% of those come from <1% of pixels, then it is considered to be noise-dominated and hence unusable.
| Quadrant | # 1 sec bins | Bins with >0 counts | Bins with >2000 counts | High rate bins dominated by noise | Noise dominated (total time) | Noise dominated (detector-on time) | Marked lightcurve |
|---|---|---|---|---|---|---|---|
| A | 7089 | 4999 | 12 | 12 | 0.17% | 0.24% | 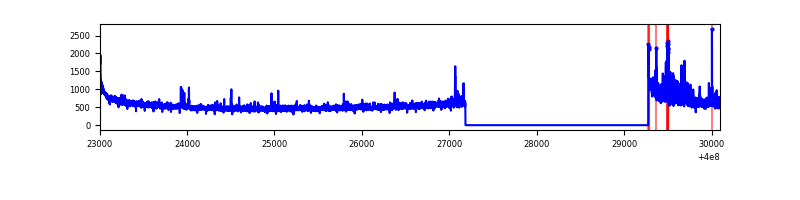 |
| B | 7089 | 4999 | 206 | 206 | 2.91% | 4.12% | 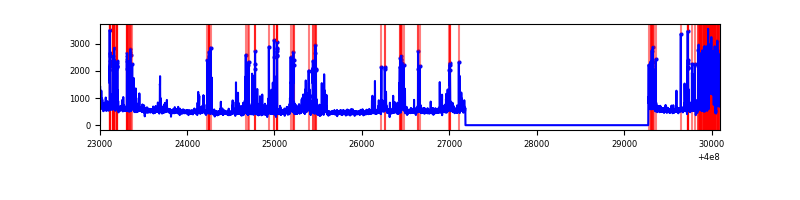 |
| C | 7089 | 4999 | 99 | 99 | 1.40% | 1.98% | 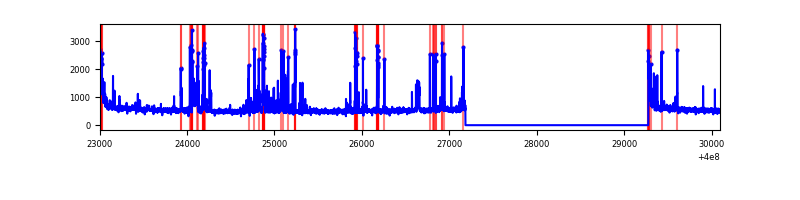 |
| D | 7089 | 4999 | 425 | 425 | 6.00% | 8.50% | 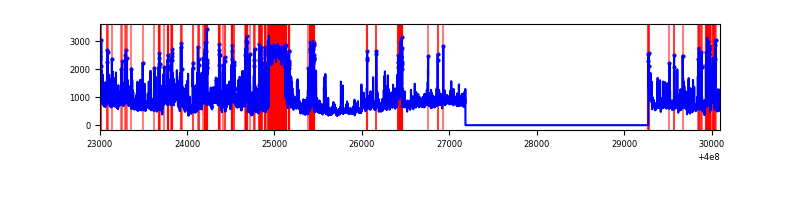 |
Top three noisy pixels from each quadrant. If the there are fewer than three noisy pixels in the level2.evt file, extra rows are filled as -1
| Pixel properties | Quadrant properties | ||||||
|---|---|---|---|---|---|---|---|
| Quadrant | DetID | PixID | Counts | Sigma | Mean | Median | Sigma |
| A | 10 | 83 | 273439 | 2198.91 | 611 | 601 | 124.1 |
| A | 15 | 222 | 196333 | 1577.48 | 611 | 601 | 124.1 |
| A | 6 | 10 | 28045 | 221.18 | 611 | 601 | 124.1 |
| B | 5 | 172 | 491213 | 4306.14 | 603 | 588 | 113.9 |
| B | 5 | 255 | 409656 | 3590.32 | 603 | 588 | 113.9 |
| B | 0 | 190 | 41122 | 355.76 | 603 | 588 | 113.9 |
| C | 14 | 254 | 497132 | 3506.37 | 602 | 607 | 141.6 |
| C | 15 | 214 | 213727 | 1505.02 | 602 | 607 | 141.6 |
| C | 0 | 10 | 103609 | 727.38 | 602 | 607 | 141.6 |
| D | 1 | 52 | 1254998 | 8880.98 | 576 | 562 | 141.2 |
| D | 2 | 249 | 788434 | 5577.86 | 576 | 562 | 141.2 |
| D | 13 | 249 | 364736 | 2578.23 | 576 | 562 | 141.2 |
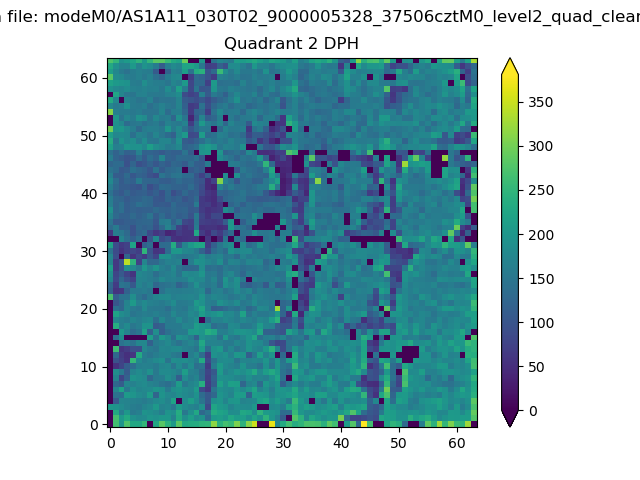
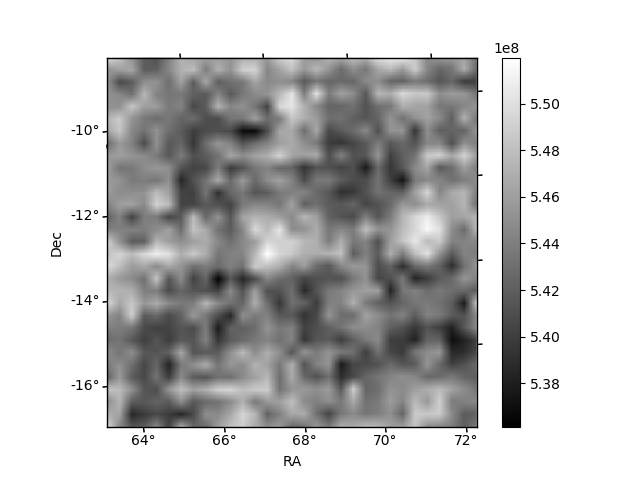
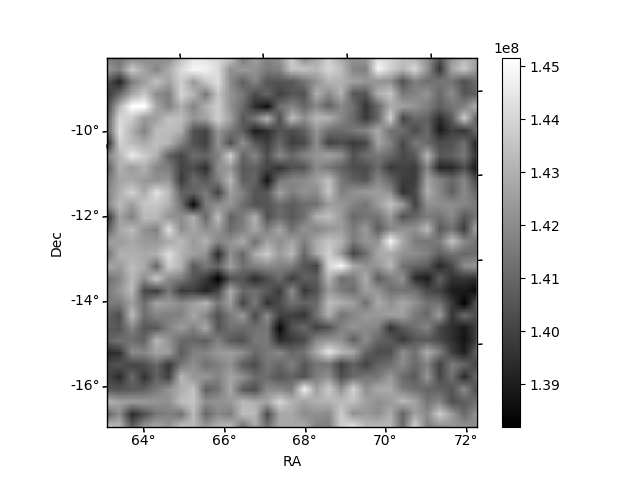
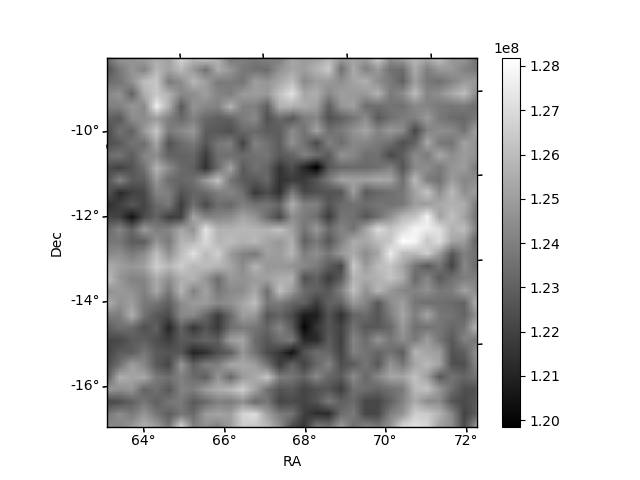
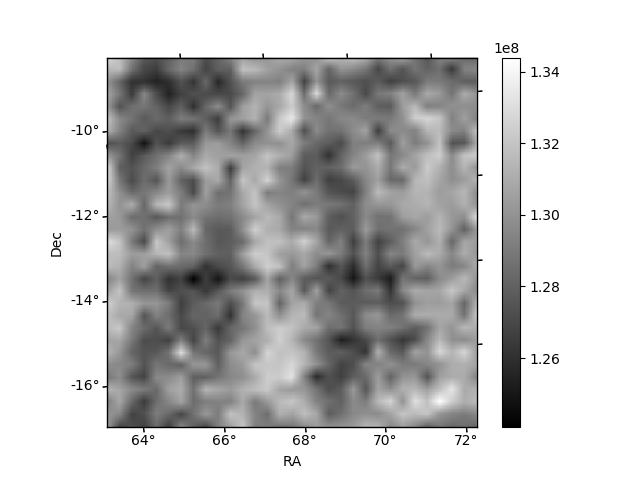
Histogram calculated using DETX and DETY for each event in the final _common_clean file
| Quadrant A | 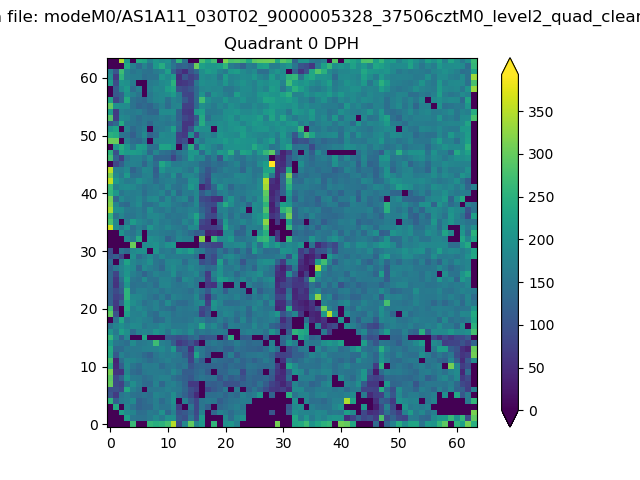 |
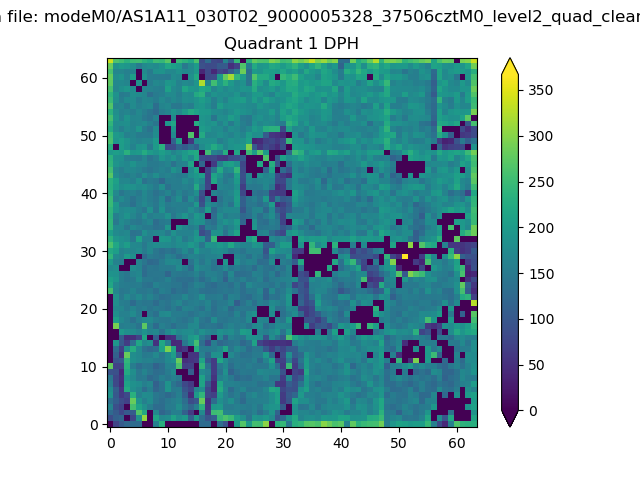 |
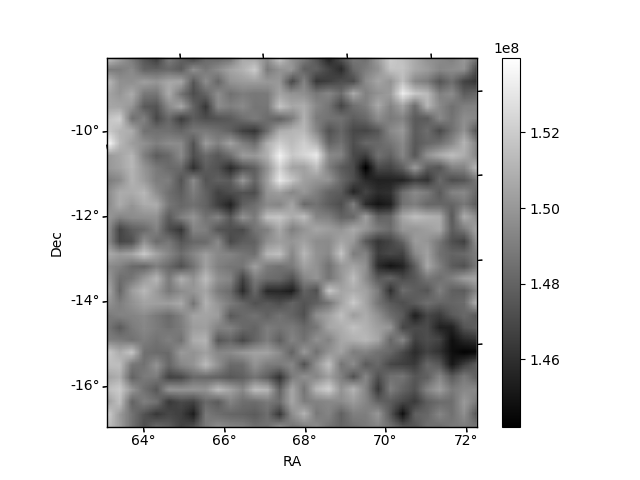
Quadrant B |
|---|---|---|---|
| Quadrant D | 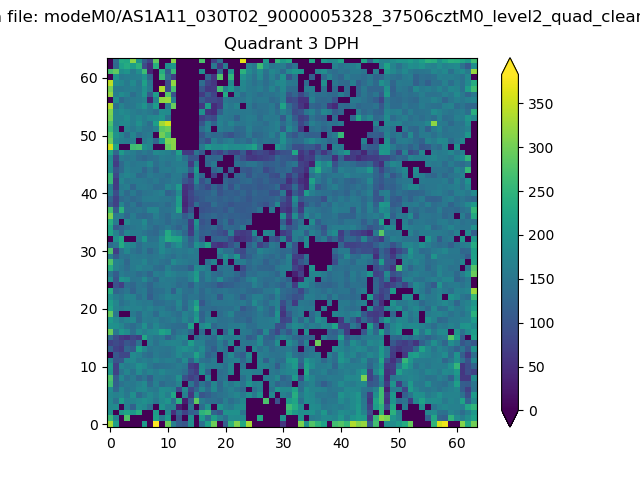 |
 |
Quadrant C |
| Plot type | Count rate plots | Images |
|---|---|---|
| Comparison with Poisson distribution Blue bars denote a histogram of data divided into 1 sec bins. Red curve is a Poisson curve with rate = median count rate of data. |
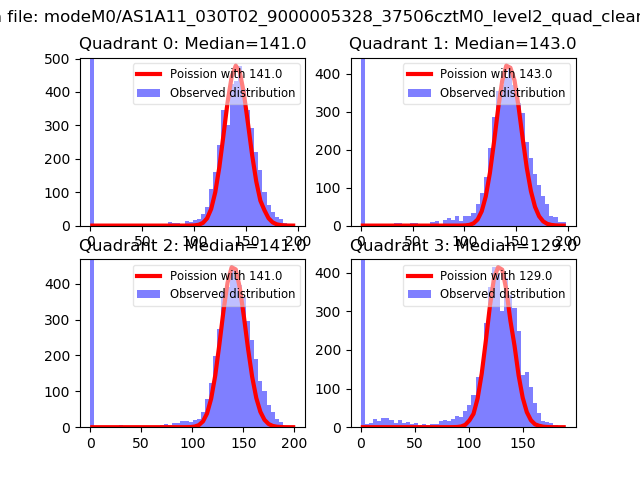 |
 |
| Quadrant-wise count rates Data is divided into 100 sec bins |
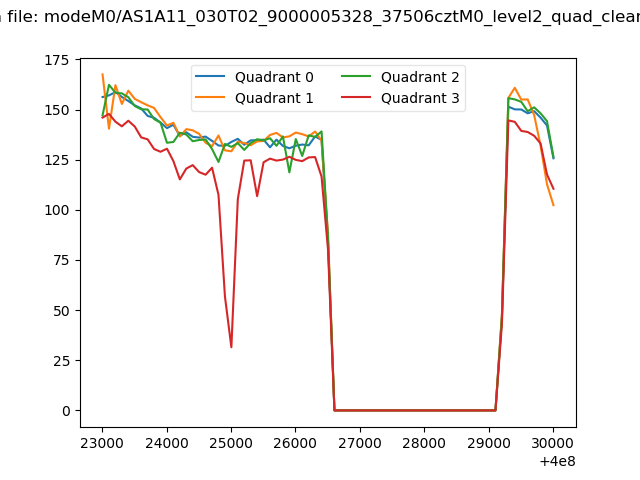 |
|
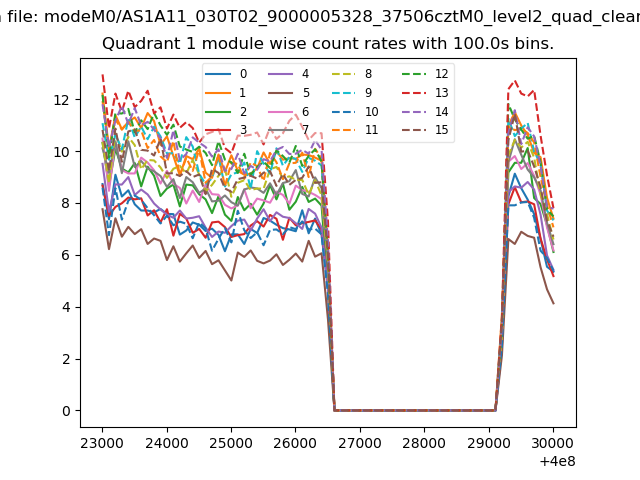
| Module-wise count rates for Quadrant A Data is divided into 100 sec bins |
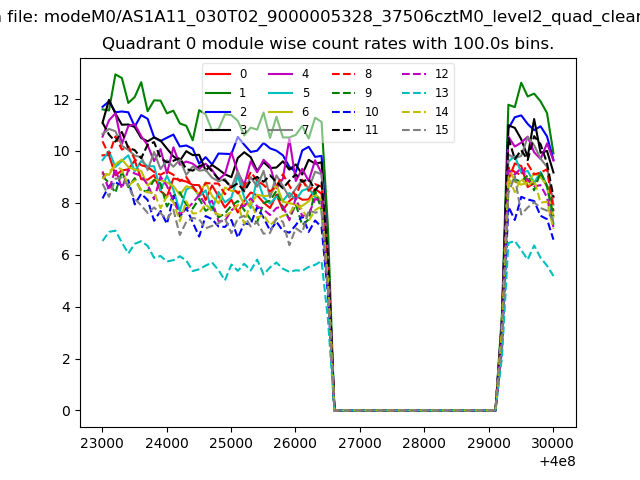 |
 |
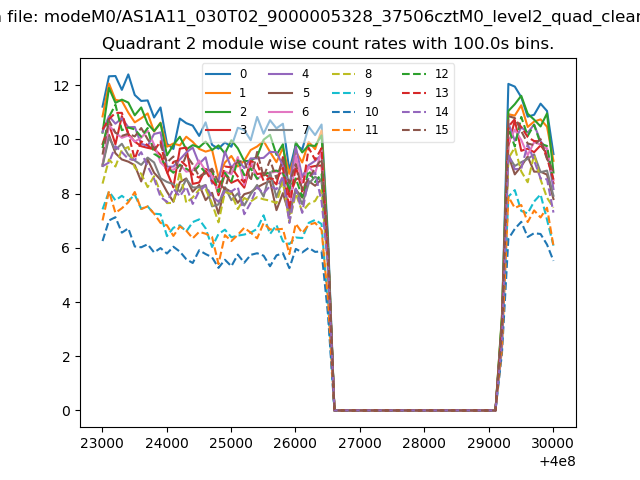
| Module-wise count rates for Quadrant B Data is divided into 100 sec bins |
 |
 |
| Module-wise count rates for Quadrant C Data is divided into 100 sec bins |
 |
 |
| Module-wise count rates for Quadrant D Data is divided into 100 sec bins |
 |
 |
| Parameter | Plot |
|---|---|
| CZT HV Monitor | 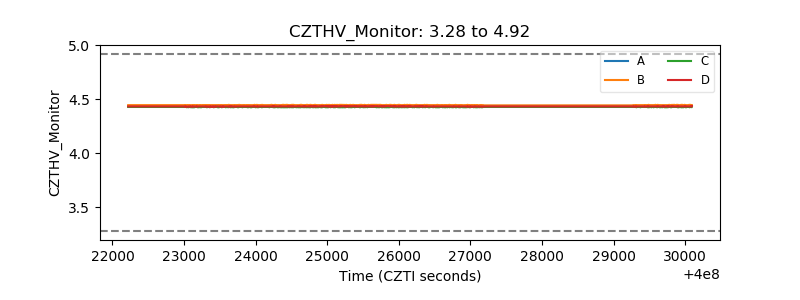 |
| D_VDD | 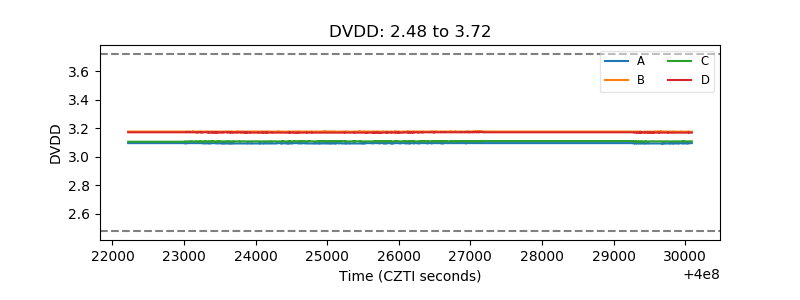 |
| Temperature 1 | 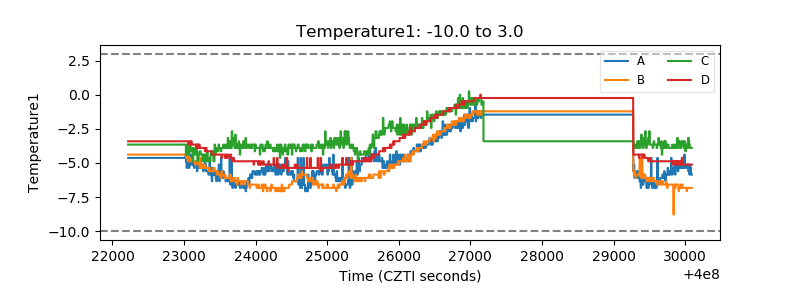 |
| Veto HV Monitor | 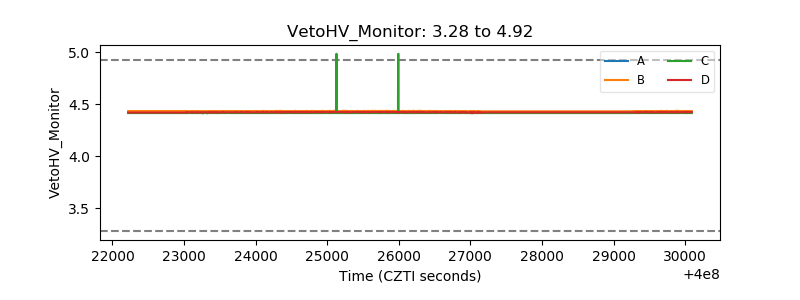 |
| Veto LLD | 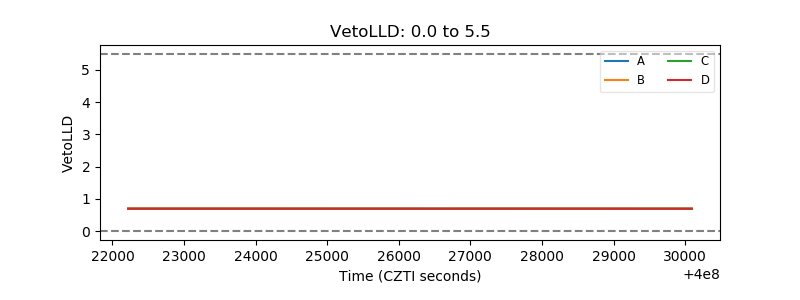 |
| Alpha Counter | 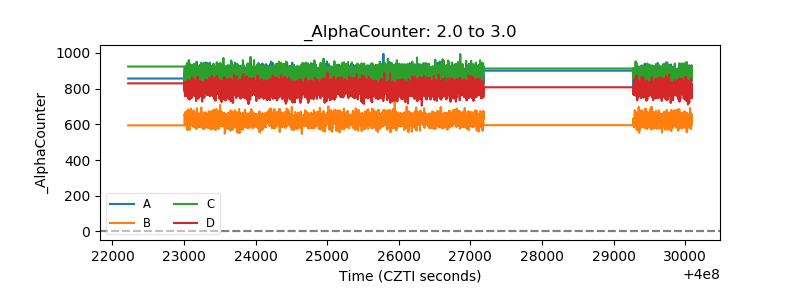 |
| _CPM_Rate | 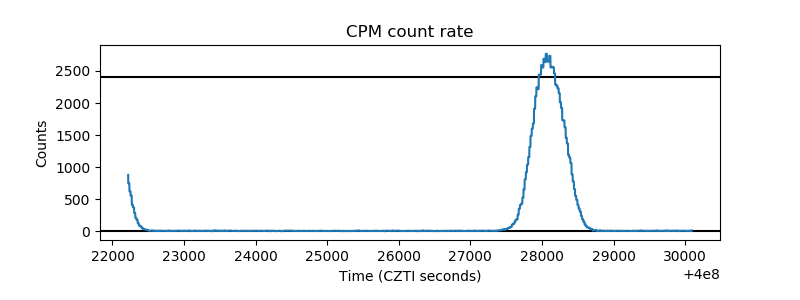 |
| CZT Counter | 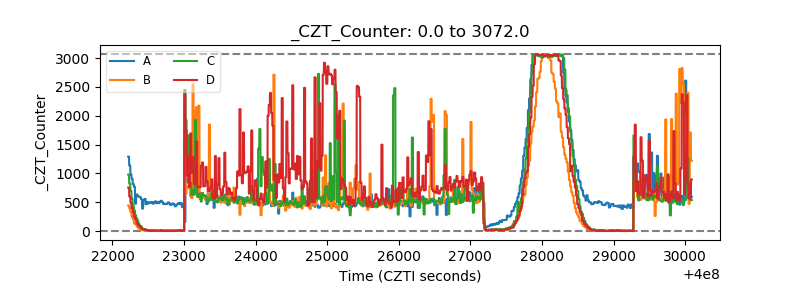 |
| +2.5 Volts monitor | 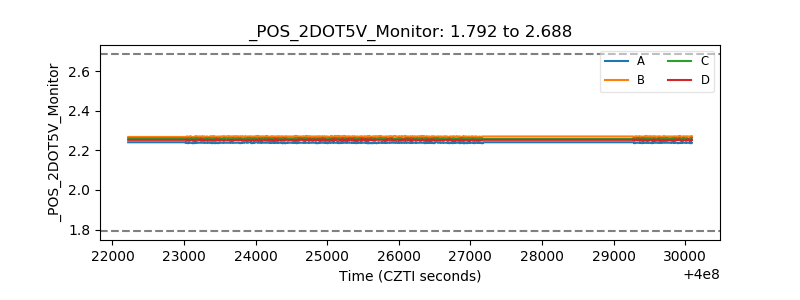 |
| +5 Volts monitor | 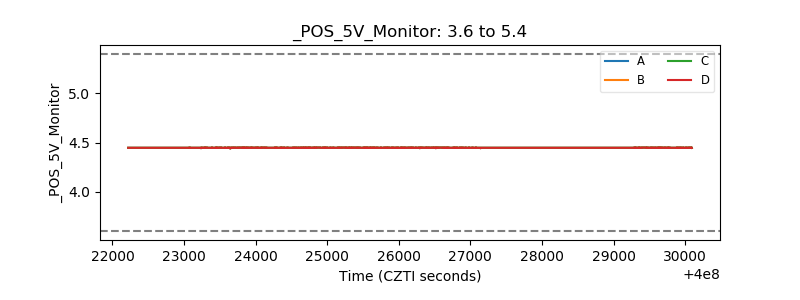 |
| _ROLL_ROT | 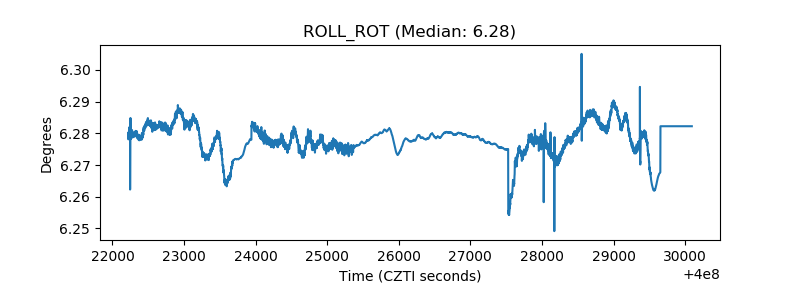 |
| _Roll_DEC | 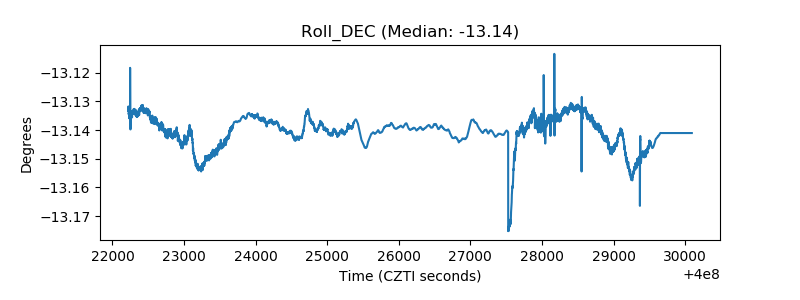 |
| _Roll_RA | 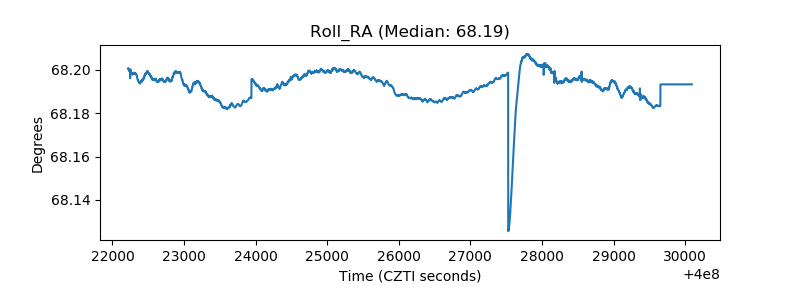 |
| Veto Counter | 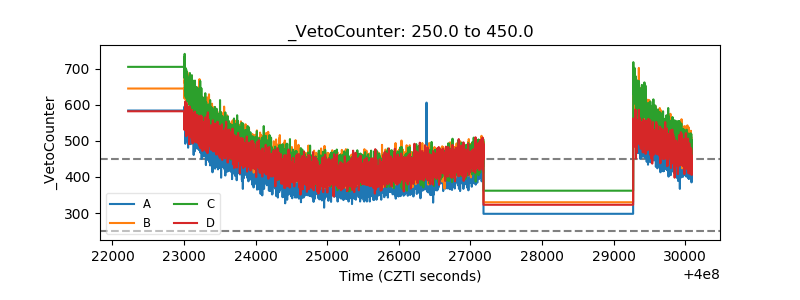 |