| Param | Original file | Final file |
|---|---|---|
| Filename | modeM0/AS1A11_030T02_9000005328_37507cztM0_level2.evt | modeM0/AS1A11_030T02_9000005328_37507cztM0_level2_quad_clean.evt |
| Size (bytes) | 1,208,102,400 | 221,866,560 |
| Size | 1.1 GB | 211.6 MB |
| Events in quadrant A | 7,146,369 | 1,504,285 |
| Events in quadrant B | 8,618,636 | 1,499,997 |
| Events in quadrant C | 8,243,401 | 1,488,486 |
| Events in quadrant D | 11,713,967 | 1,339,461 |
| Mode M9 | |||
|---|---|---|---|
| Quadrant | BADHDUFLAG | Total packets | Discarded packets |
| A | 0 | 63 | 0 |
| B | 0 | 63 | 0 |
| C | 0 | 63 | 0 |
| D | 0 | 63 | 0 |
| Mode M0 | |||
|---|---|---|---|
| Quadrant | BADHDUFLAG | Total packets | Discarded packets |
| A | 0 | 29150 | 4 |
| B | 0 | 33786 | 3 |
| C | 0 | 32086 | 3 |
| D | 0 | 43825 | 3 |
| Mode SS | |||
|---|---|---|---|
| Quadrant | BADHDUFLAG | Total packets | Discarded packets |
| A | 0 | 262 | 0 |
| B | 0 | 262 | 0 |
| C | 0 | 262 | 0 |
| D | 0 | 262 | 0 |
| Quadrant | Total seconds | Saturated seconds | Saturation percentage |
|---|---|---|---|
| A | 12847 | 25 | 0.194598% |
| B | 12847 | 639 | 4.973924% |
| C | 12847 | 377 | 2.934537% |
| D | 12847 | 990 | 7.706079% |
Noise dominated data is calculated using 1-second bins in cleaned event files. If a bin has >2000 counts, and if more than 50% of those come from <1% of pixels, then it is considered to be noise-dominated and hence unusable.
| Quadrant | # 1 sec bins | Bins with >0 counts | Bins with >2000 counts | High rate bins dominated by noise | Noise dominated (total time) | Noise dominated (detector-on time) | Marked lightcurve |
|---|---|---|---|---|---|---|---|
| A | 19093 | 12850 | 16 | 16 | 0.08% | 0.12% | 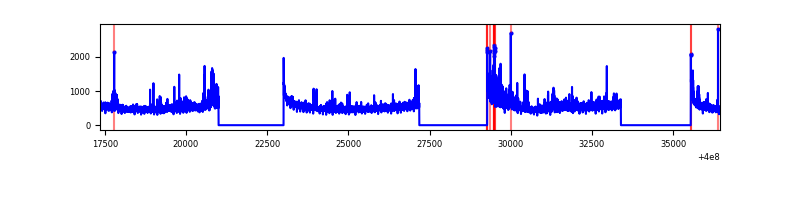 |
| B | 19093 | 12850 | 530 | 530 | 2.78% | 4.12% | 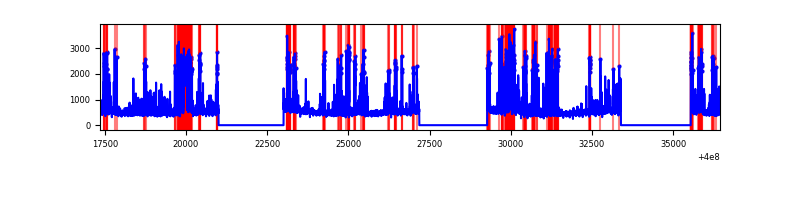 |
| C | 19093 | 12850 | 335 | 335 | 1.75% | 2.61% | 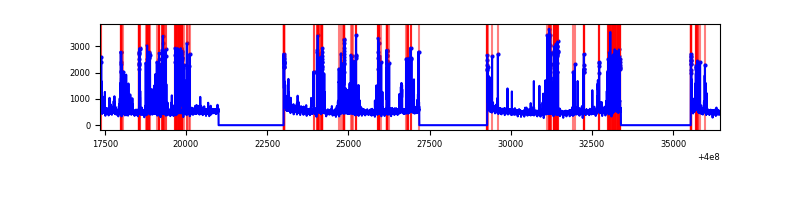 |
| D | 19093 | 12850 | 1004 | 1004 | 5.26% | 7.81% | 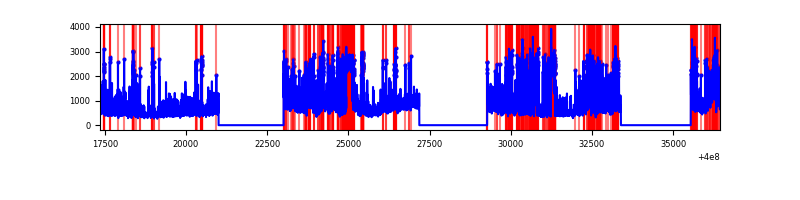 |
Top three noisy pixels from each quadrant. If the there are fewer than three noisy pixels in the level2.evt file, extra rows are filled as -1
| Pixel properties | Quadrant properties | ||||||
|---|---|---|---|---|---|---|---|
| Quadrant | DetID | PixID | Counts | Sigma | Mean | Median | Sigma |
| A | 10 | 83 | 562963 | 1830.94 | 1533 | 1507 | 306.6 |
| A | 15 | 222 | 507838 | 1651.17 | 1533 | 1507 | 306.6 |
| A | 13 | 6 | 55753 | 176.9 | 1533 | 1507 | 306.6 |
| B | 5 | 172 | 1612362 | 5718.93 | 1507 | 1470 | 281.7 |
| B | 5 | 255 | 728928 | 2582.6 | 1507 | 1470 | 281.7 |
| B | 0 | 213 | 77035 | 268.27 | 1507 | 1470 | 281.7 |
| C | 14 | 254 | 1678096 | 4834.32 | 1504 | 1519 | 346.8 |
| C | 15 | 214 | 534889 | 1537.94 | 1504 | 1519 | 346.8 |
| C | 0 | 10 | 137008 | 390.68 | 1504 | 1519 | 346.8 |
| D | 1 | 52 | 2422647 | 6874.24 | 1450 | 1415 | 352.2 |
| D | 13 | 249 | 1666603 | 4727.72 | 1450 | 1415 | 352.2 |
| D | 2 | 249 | 1321684 | 3748.44 | 1450 | 1415 | 352.2 |
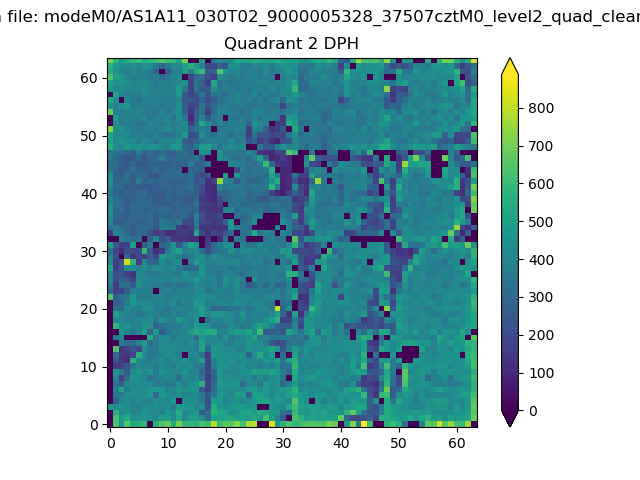
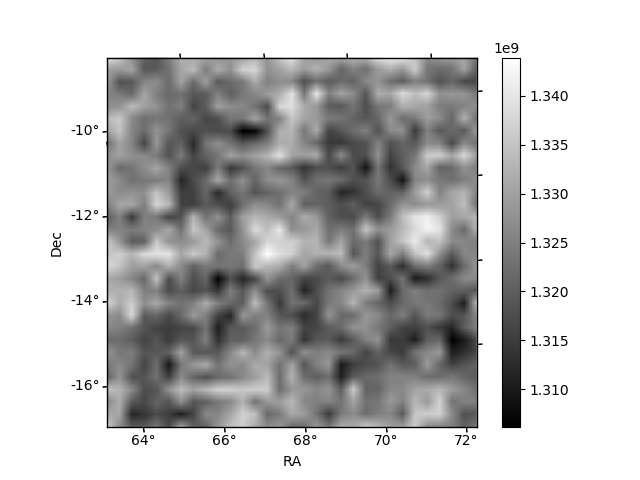
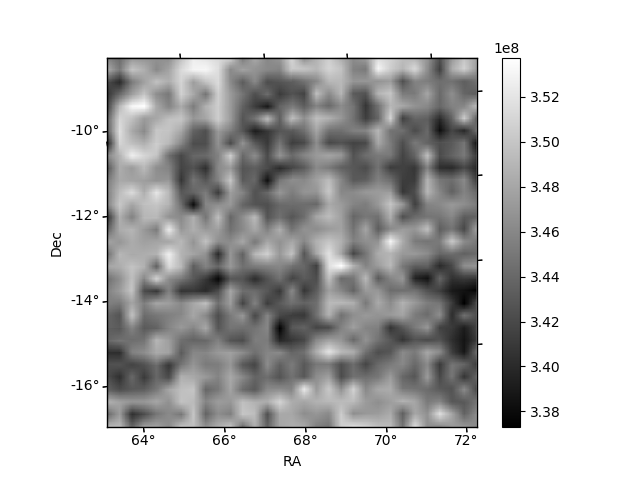
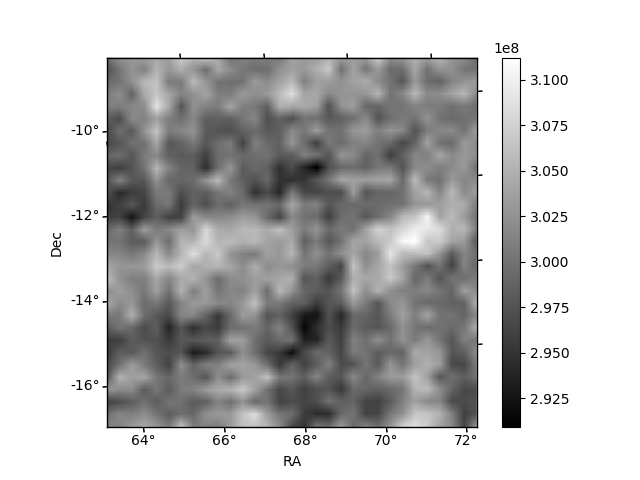
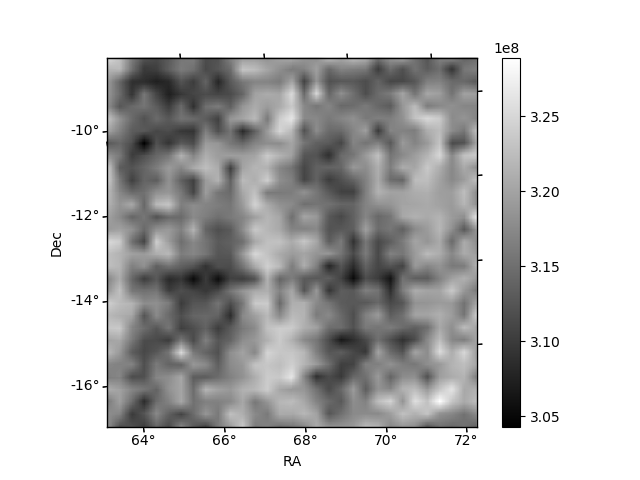
Histogram calculated using DETX and DETY for each event in the final _common_clean file
| Quadrant A | 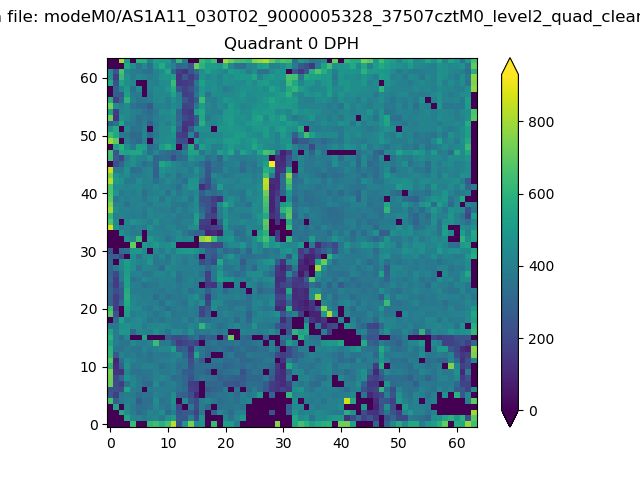 |
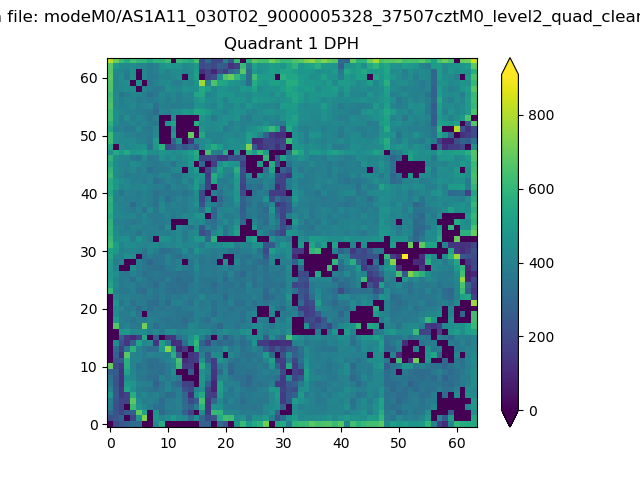 |
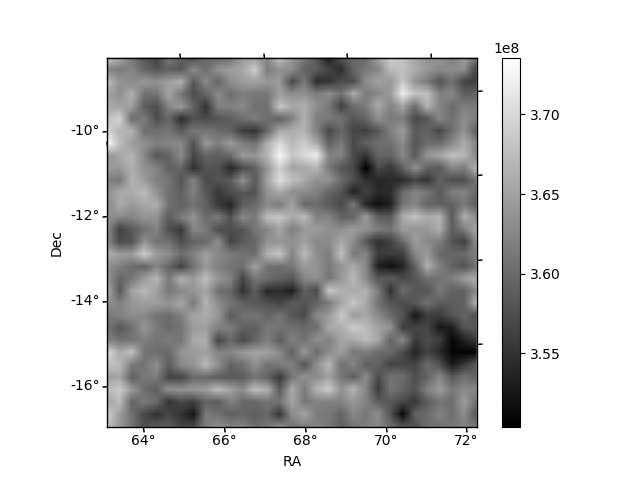
Quadrant B |
|---|---|---|---|
| Quadrant D | 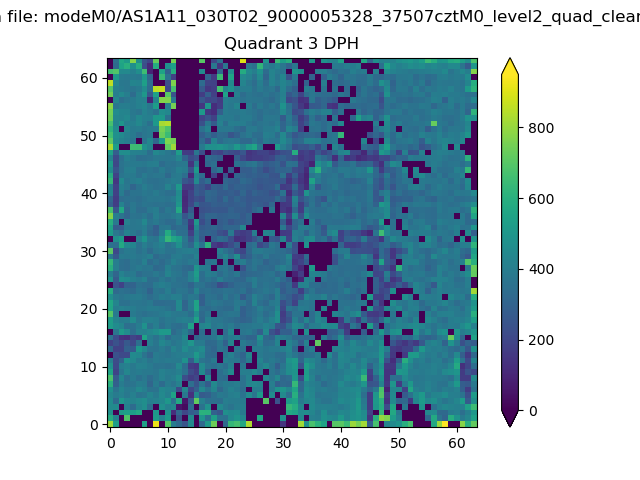 |
 |
Quadrant C |
| Plot type | Count rate plots | Images |
|---|---|---|
| Comparison with Poisson distribution Blue bars denote a histogram of data divided into 1 sec bins. Red curve is a Poisson curve with rate = median count rate of data. |
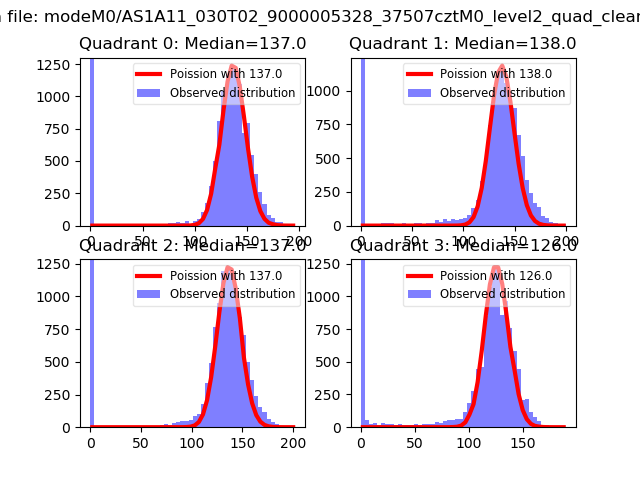 |
 |
| Quadrant-wise count rates Data is divided into 100 sec bins |
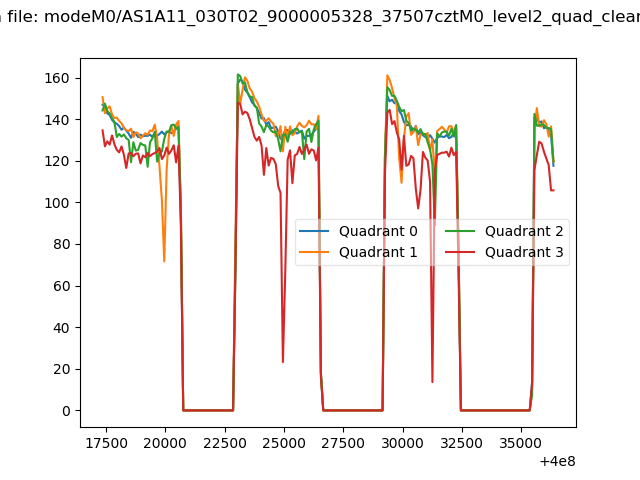 |
|
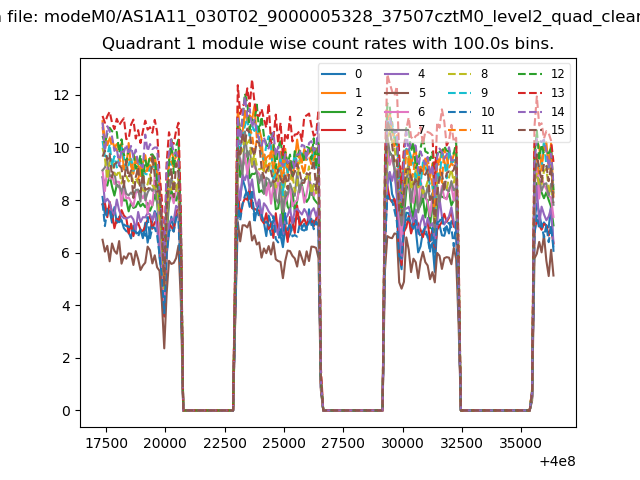
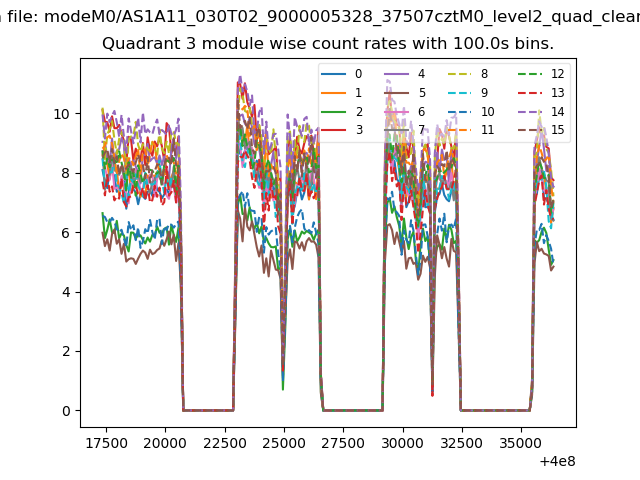
| Module-wise count rates for Quadrant A Data is divided into 100 sec bins |
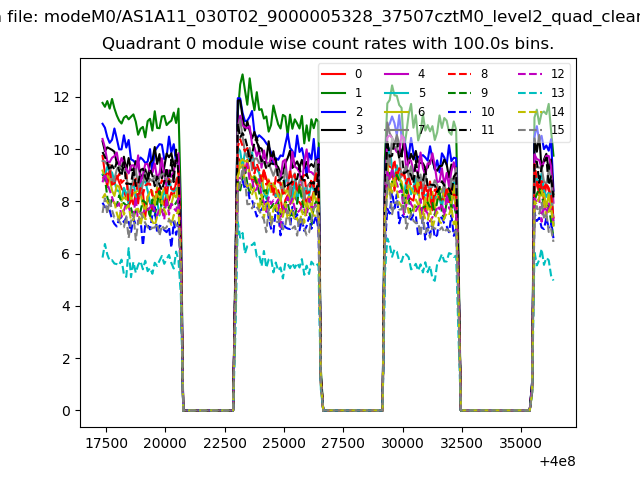 |
 |
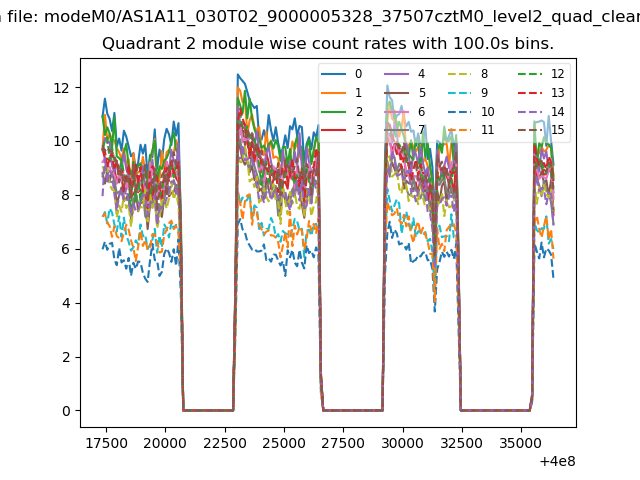
| Module-wise count rates for Quadrant B Data is divided into 100 sec bins |
 |
 |
| Module-wise count rates for Quadrant C Data is divided into 100 sec bins |
 |
 |
| Module-wise count rates for Quadrant D Data is divided into 100 sec bins |
 |
 |
| Parameter | Plot |
|---|---|
| CZT HV Monitor | 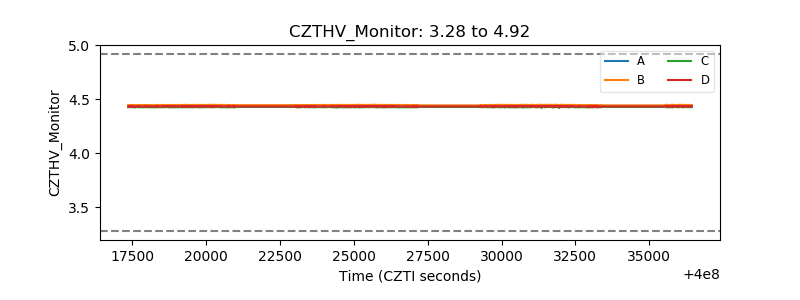 |
| D_VDD | 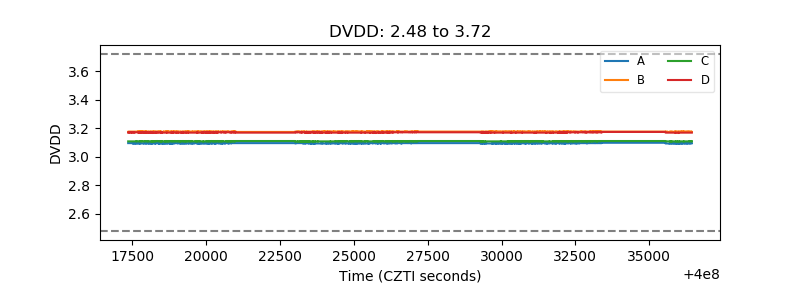 |
| Temperature 1 | 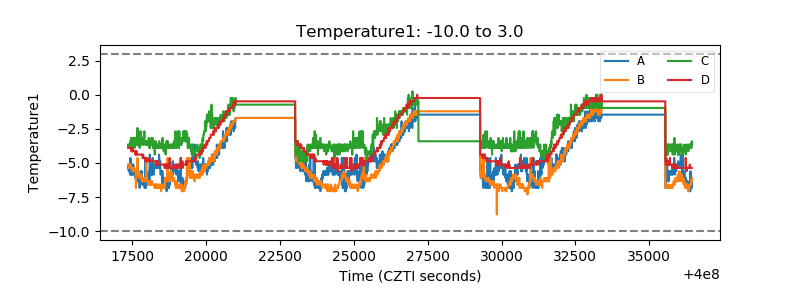 |
| Veto HV Monitor | 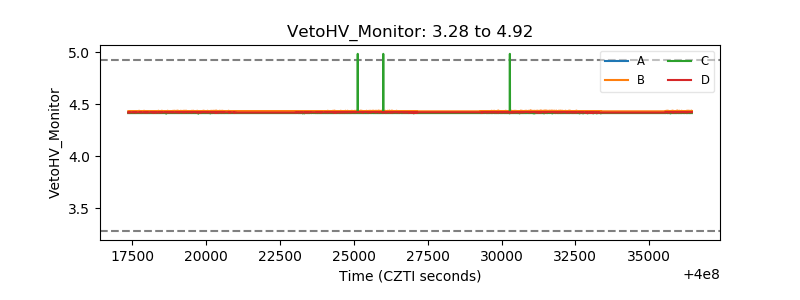 |
| Veto LLD | 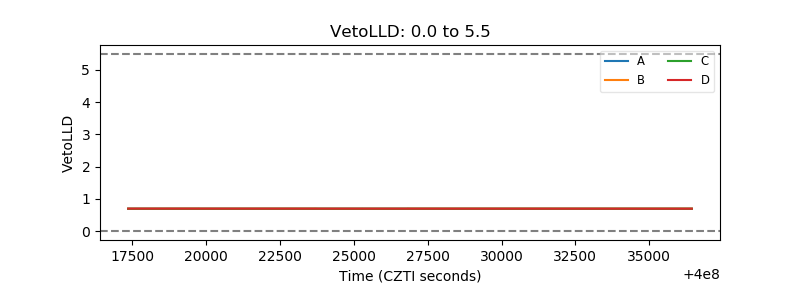 |
| Alpha Counter | 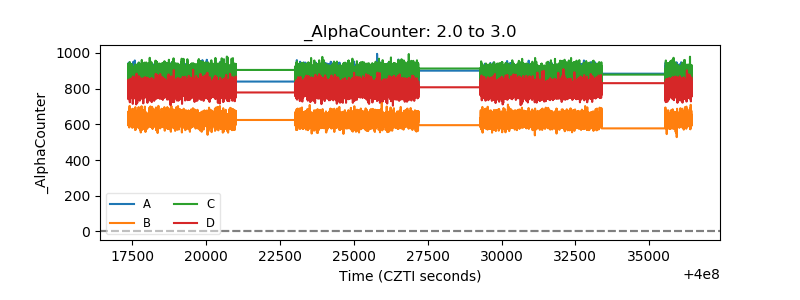 |
| _CPM_Rate | 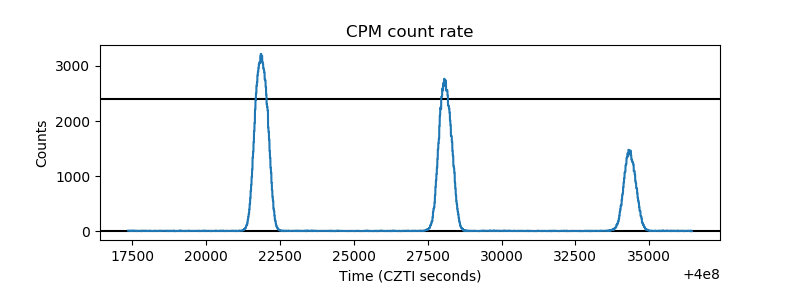 |
| CZT Counter | 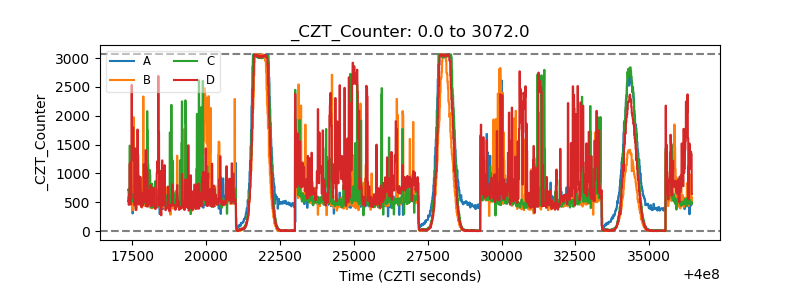 |
| +2.5 Volts monitor | 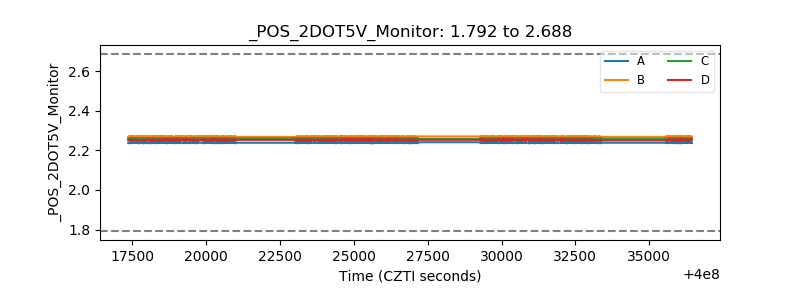 |
| +5 Volts monitor | 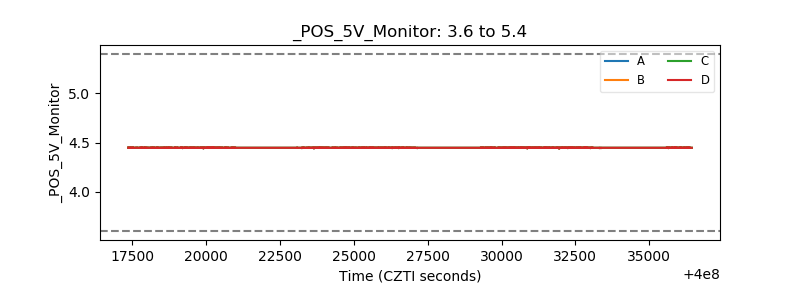 |
| _ROLL_ROT |  |
| _Roll_DEC | 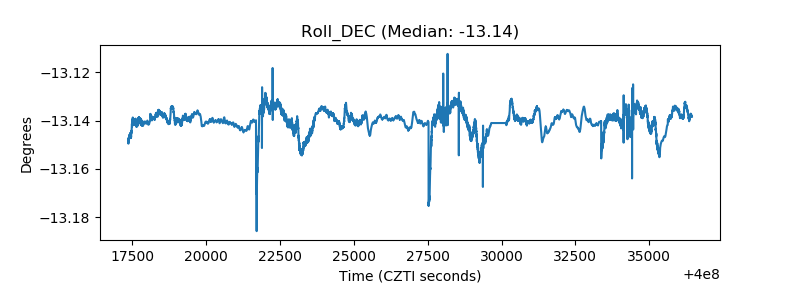 |
| _Roll_RA | 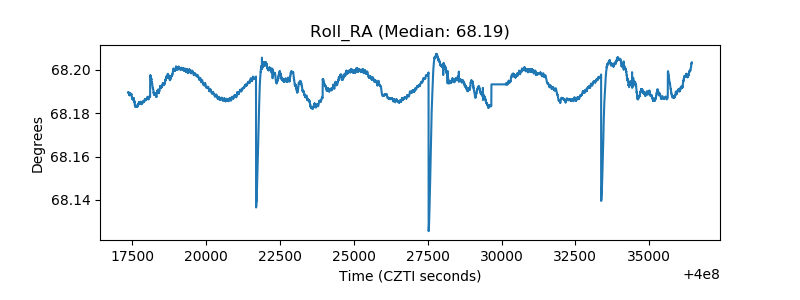 |
| Veto Counter |  |