| Param | Original file | Final file |
|---|---|---|
| Filename | modeM0/AS1A11_030T02_9000005328_37508cztM0_level2.evt | modeM0/AS1A11_030T02_9000005328_37508cztM0_level2_quad_clean.evt |
| Size (bytes) | 502,251,840 | 70,577,280 |
| Size | 479.0 MB | 67.3 MB |
| Events in quadrant A | 2,622,504 | 459,070 |
| Events in quadrant B | 3,626,752 | 457,065 |
| Events in quadrant C | 3,024,253 | 457,907 |
| Events in quadrant D | 5,597,851 | 411,377 |
| Mode M9 | |||
|---|---|---|---|
| Quadrant | BADHDUFLAG | Total packets | Discarded packets |
| A | 0 | 35 | 0 |
| B | 0 | 35 | 0 |
| C | 0 | 35 | 0 |
| D | 0 | 36 | 0 |
| Mode M0 | |||
|---|---|---|---|
| Quadrant | BADHDUFLAG | Total packets | Discarded packets |
| A | 0 | 10916 | 3 |
| B | 0 | 14021 | 2 |
| C | 0 | 11952 | 2 |
| D | 0 | 20128 | 2 |
| Mode SS | |||
|---|---|---|---|
| Quadrant | BADHDUFLAG | Total packets | Discarded packets |
| A | 0 | 104 | 0 |
| B | 0 | 104 | 0 |
| C | 0 | 104 | 0 |
| D | 0 | 104 | 0 |
| Quadrant | Total seconds | Saturated seconds | Saturation percentage |
|---|---|---|---|
| A | 5007 | 9 | 0.179748% |
| B | 5007 | 298 | 5.951668% |
| C | 5007 | 95 | 1.897344% |
| D | 5007 | 517 | 10.325544% |
Noise dominated data is calculated using 1-second bins in cleaned event files. If a bin has >2000 counts, and if more than 50% of those come from <1% of pixels, then it is considered to be noise-dominated and hence unusable.
| Quadrant | # 1 sec bins | Bins with >0 counts | Bins with >2000 counts | High rate bins dominated by noise | Noise dominated (total time) | Noise dominated (detector-on time) | Marked lightcurve |
|---|---|---|---|---|---|---|---|
| A | 7099 | 5008 | 5 | 5 | 0.07% | 0.10% | 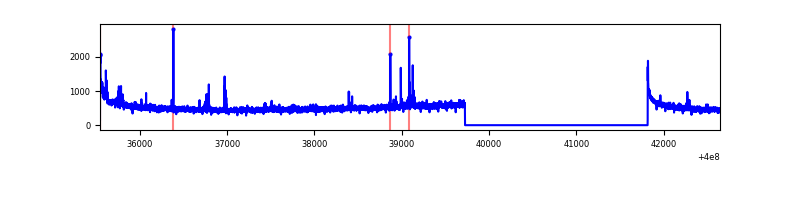 |
| B | 7099 | 5008 | 250 | 250 | 3.52% | 4.99% | 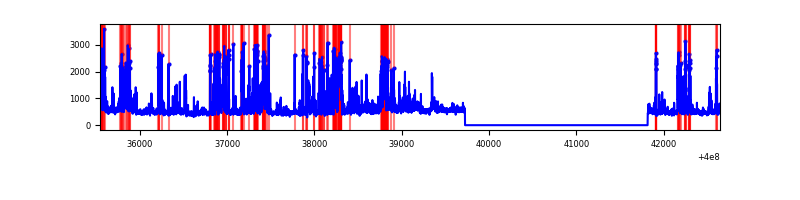 |
| C | 7099 | 5008 | 102 | 102 | 1.44% | 2.04% | 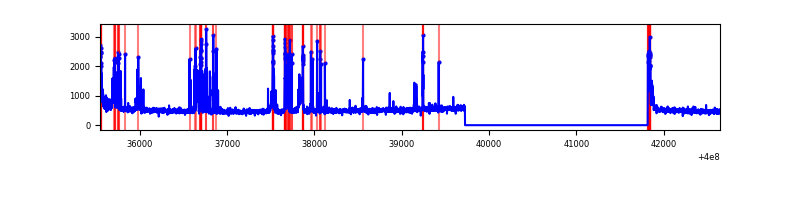 |
| D | 7099 | 5008 | 579 | 579 | 8.16% | 11.56% | 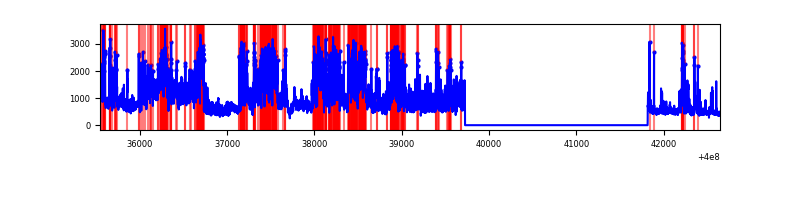 |
Top three noisy pixels from each quadrant. If the there are fewer than three noisy pixels in the level2.evt file, extra rows are filled as -1
| Pixel properties | Quadrant properties | ||||||
|---|---|---|---|---|---|---|---|
| Quadrant | DetID | PixID | Counts | Sigma | Mean | Median | Sigma |
| A | 10 | 83 | 273074 | 2328.34 | 579 | 568 | 117.0 |
| A | 15 | 222 | 50132 | 423.48 | 579 | 568 | 117.0 |
| A | 13 | 248 | 41924 | 353.35 | 579 | 568 | 117.0 |
| B | 5 | 172 | 847222 | 7765.19 | 567 | 553 | 109.0 |
| B | 5 | 255 | 247671 | 2266.43 | 567 | 553 | 109.0 |
| B | 0 | 213 | 141984 | 1297.13 | 567 | 553 | 109.0 |
| C | 14 | 254 | 510442 | 3794.9 | 571 | 574 | 134.4 |
| C | 15 | 214 | 214581 | 1592.83 | 571 | 574 | 134.4 |
| C | 0 | 10 | 67385 | 497.27 | 571 | 574 | 134.4 |
| D | 2 | 250 | 1511477 | 11093.17 | 550 | 535 | 136.2 |
| D | 1 | 52 | 946563 | 6945.63 | 550 | 535 | 136.2 |
| D | 13 | 249 | 413376 | 3031.03 | 550 | 535 | 136.2 |
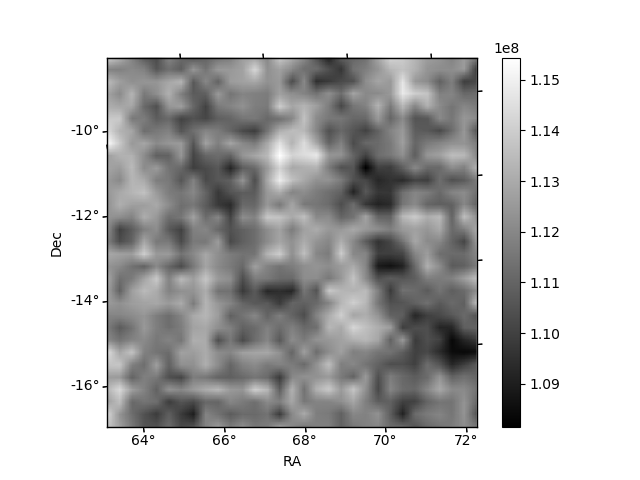
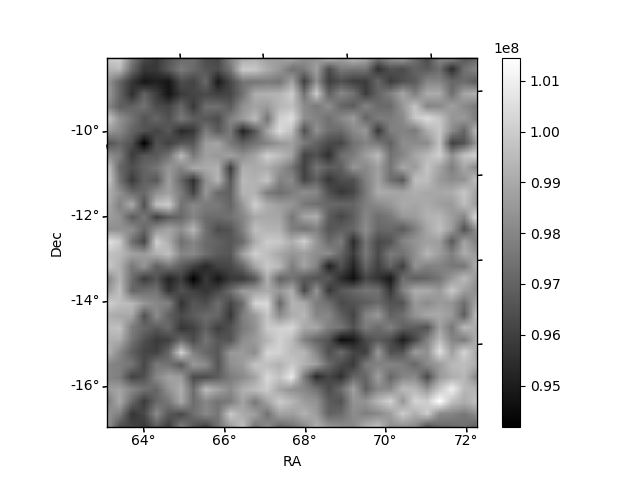
Histogram calculated using DETX and DETY for each event in the final _common_clean file
| Quadrant A | 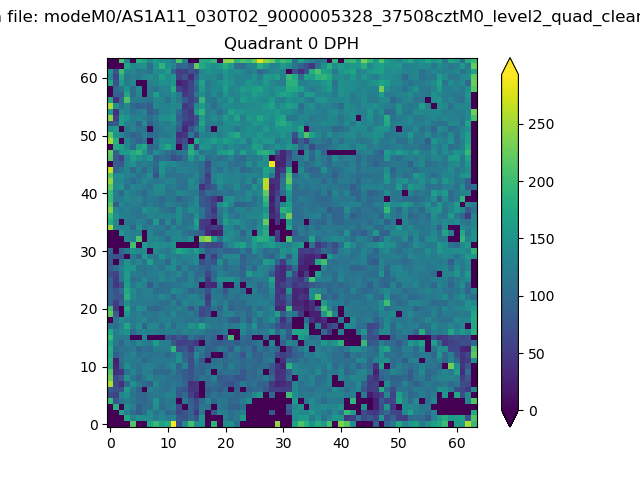 |
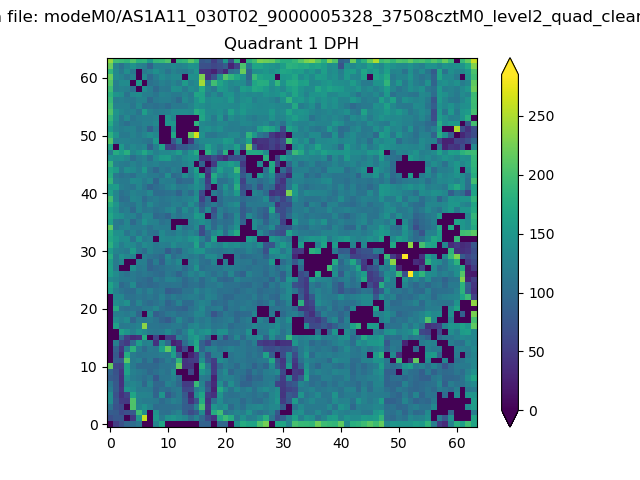 |
Quadrant B |
|---|---|---|---|
| Quadrant D | 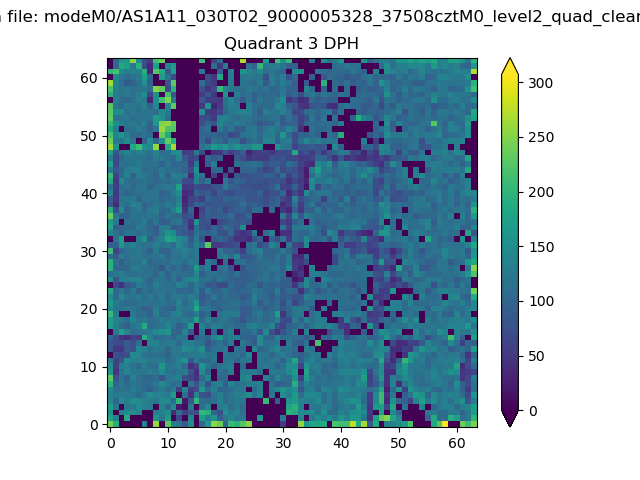 |
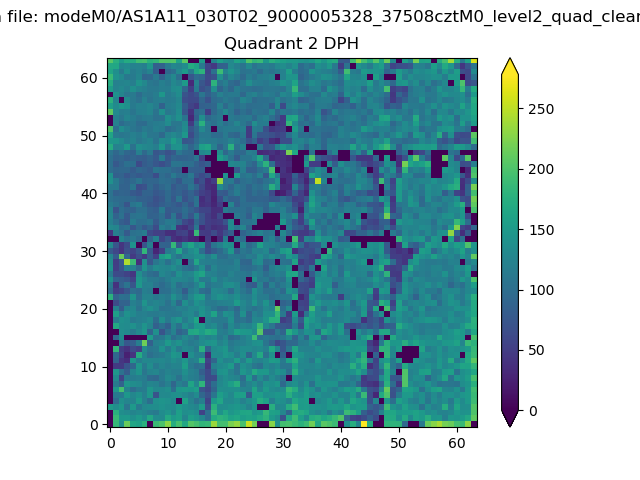 |
Quadrant C |
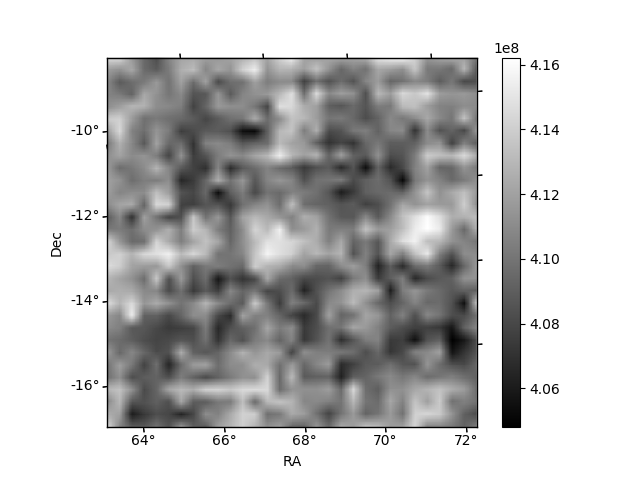
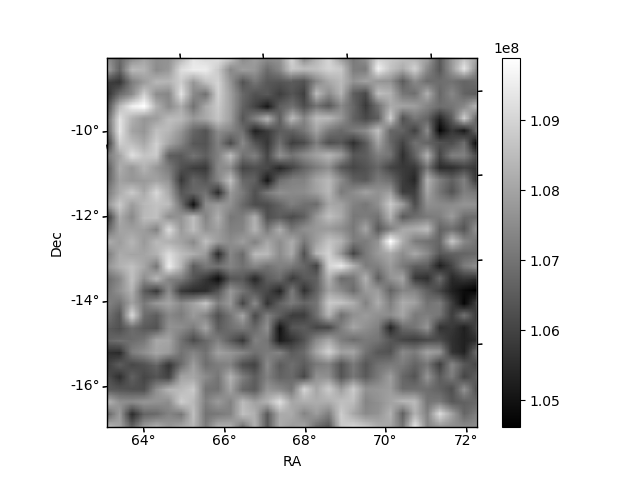
| Plot type | Count rate plots | Images |
|---|---|---|
| Comparison with Poisson distribution Blue bars denote a histogram of data divided into 1 sec bins. Red curve is a Poisson curve with rate = median count rate of data. |
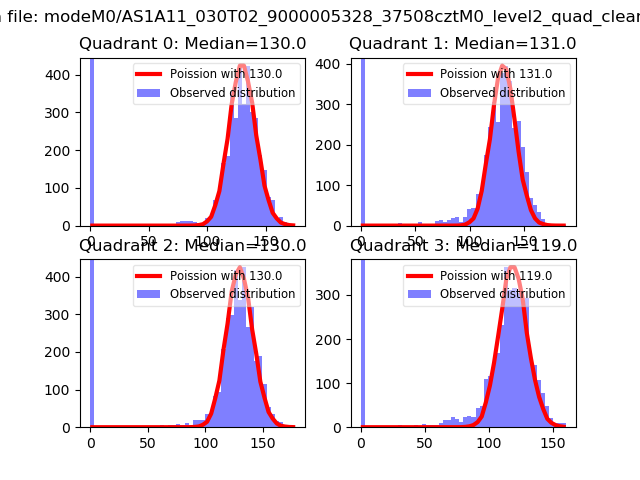 |
 |
| Quadrant-wise count rates Data is divided into 100 sec bins |
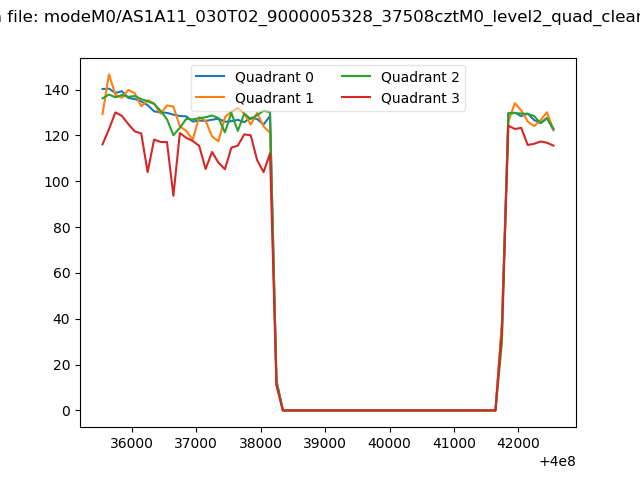 |
|
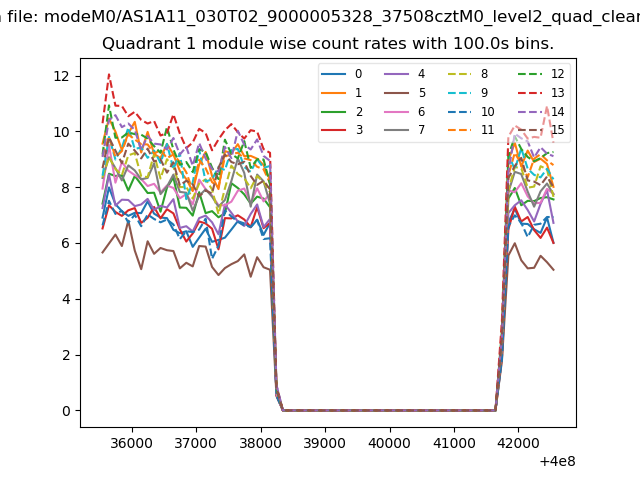
| Module-wise count rates for Quadrant A Data is divided into 100 sec bins |
 |
 |
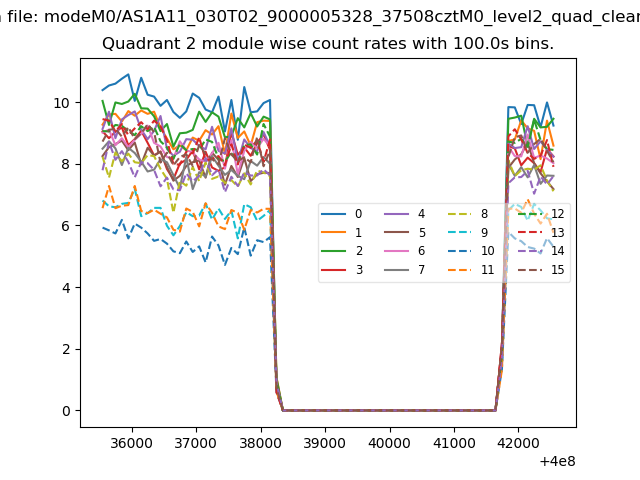
| Module-wise count rates for Quadrant B Data is divided into 100 sec bins |
 |
 |
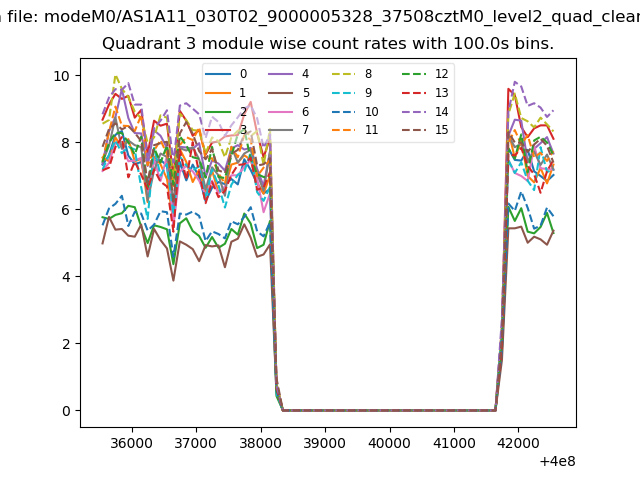
| Module-wise count rates for Quadrant C Data is divided into 100 sec bins |
 |
 |
| Module-wise count rates for Quadrant D Data is divided into 100 sec bins |
 |
 |
| Parameter | Plot |
|---|---|
| CZT HV Monitor | 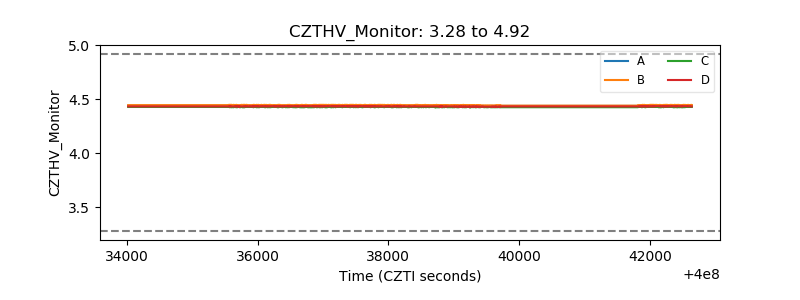 |
| D_VDD | 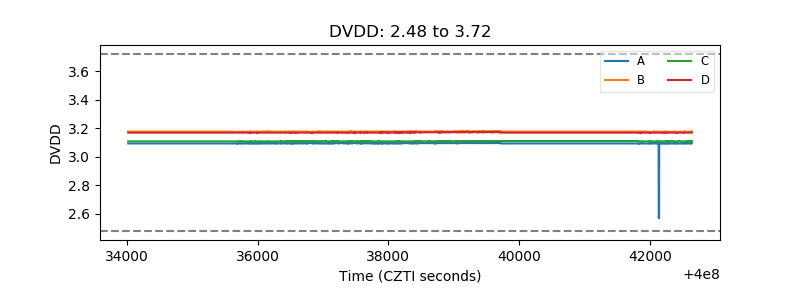 |
| Temperature 1 | 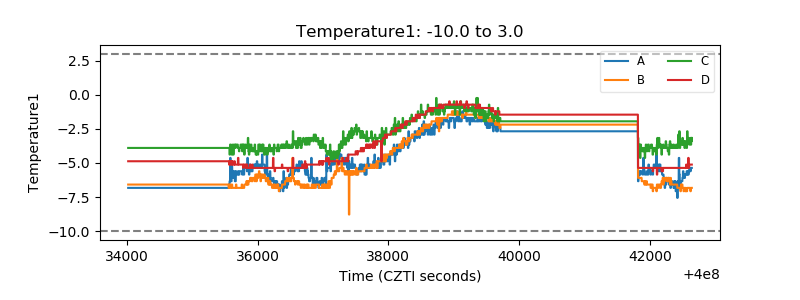 |
| Veto HV Monitor | 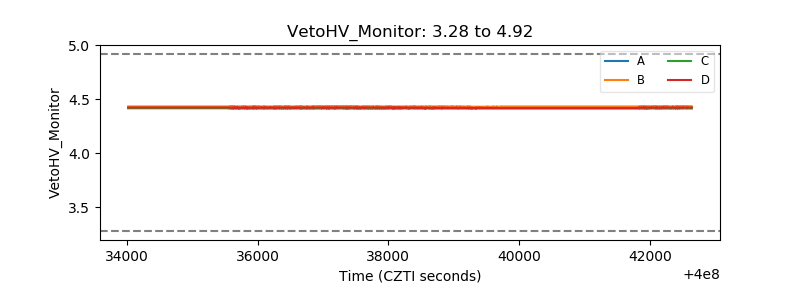 |
| Veto LLD | 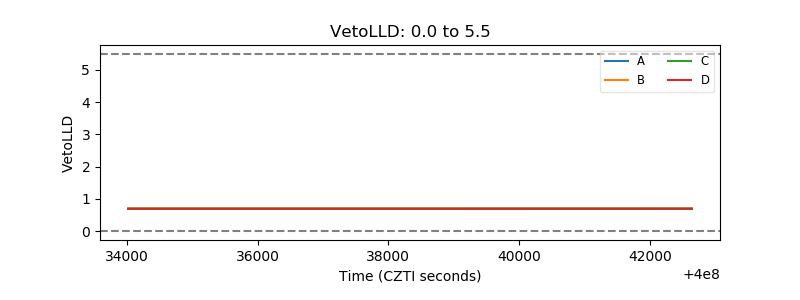 |
| Alpha Counter | 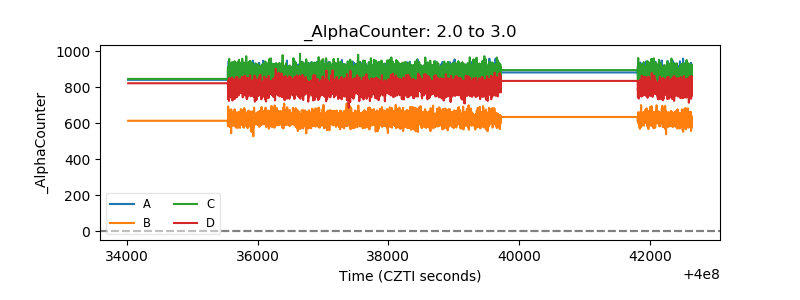 |
| _CPM_Rate | 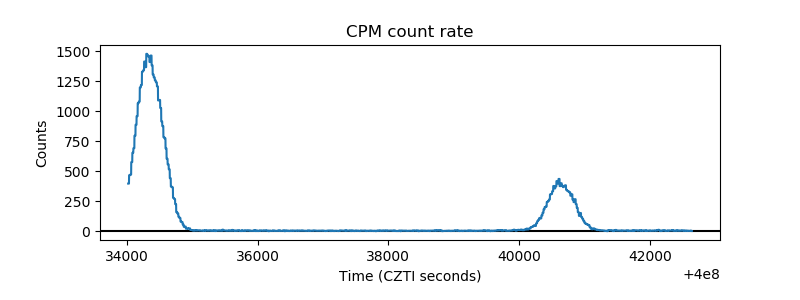 |
| CZT Counter | 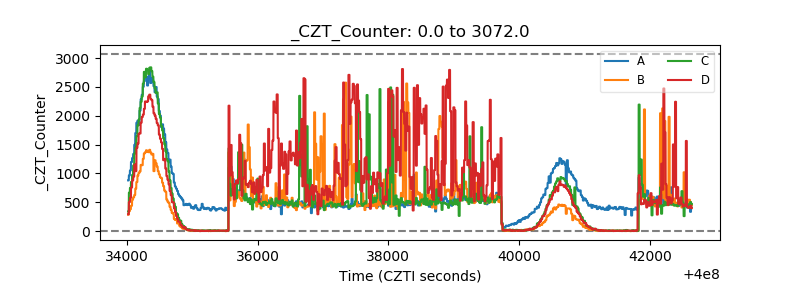 |
| +2.5 Volts monitor | 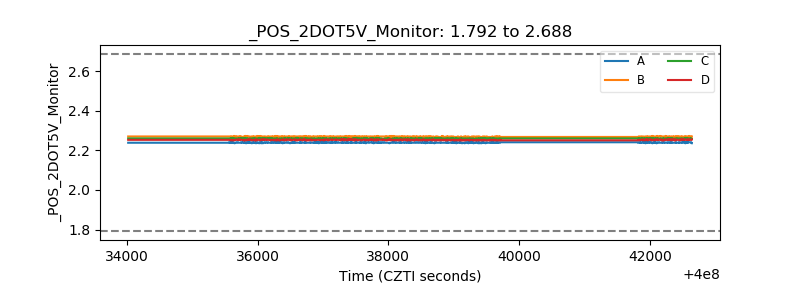 |
| +5 Volts monitor | 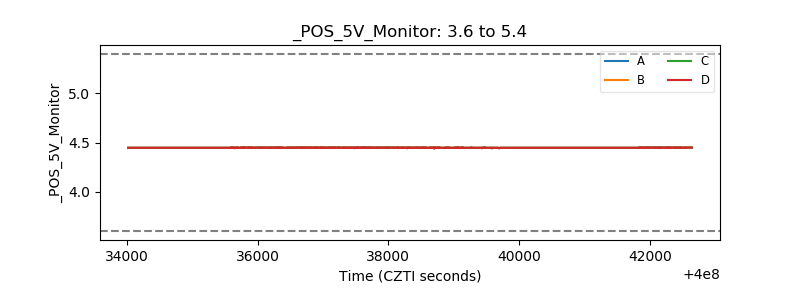 |
| _ROLL_ROT | 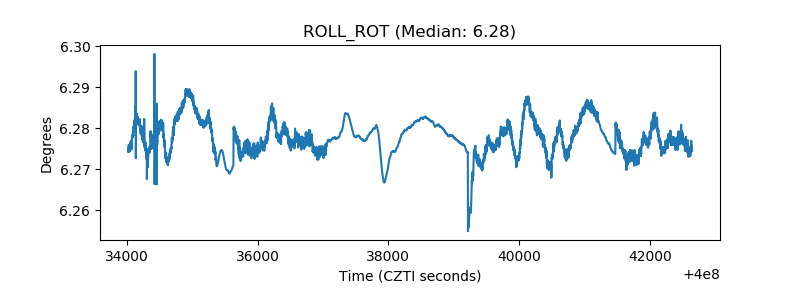 |
| _Roll_DEC | 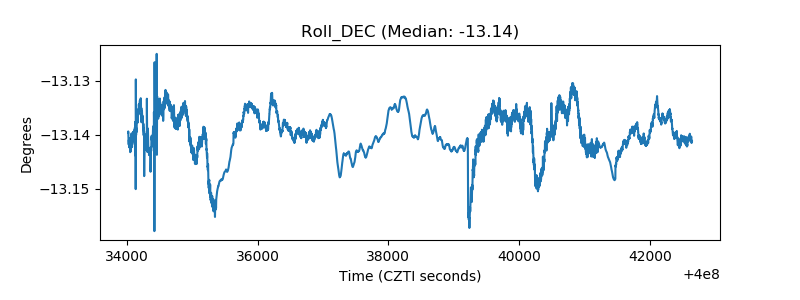 |
| _Roll_RA | 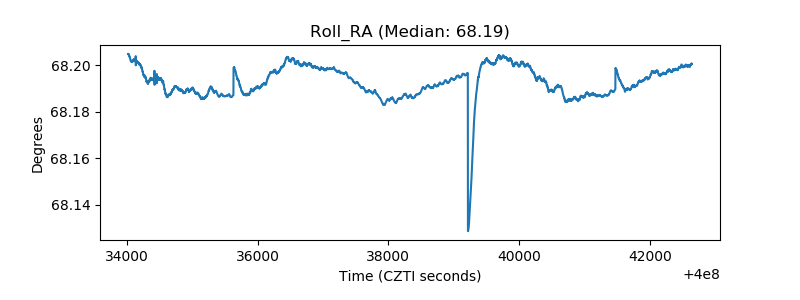 |
| Veto Counter | 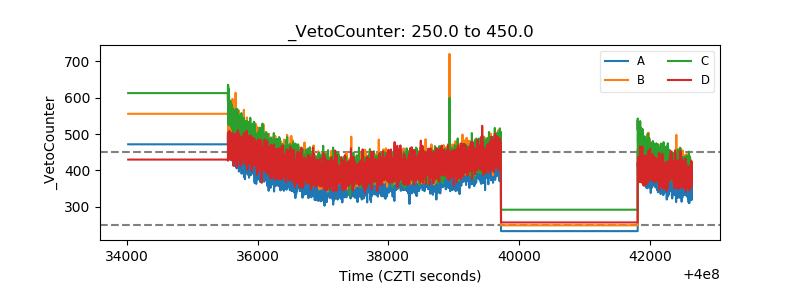 |