| Param | Original file | Final file |
|---|---|---|
| Filename | modeM0/AS1A11_030T02_9000005328_37509cztM0_level2.evt | modeM0/AS1A11_030T02_9000005328_37509cztM0_level2_quad_clean.evt |
| Size (bytes) | 461,629,440 | 62,631,360 |
| Size | 440.2 MB | 59.7 MB |
| Events in quadrant A | 2,795,531 | 386,586 |
| Events in quadrant B | 3,178,178 | 388,231 |
| Events in quadrant C | 3,445,217 | 380,374 |
| Events in quadrant D | 4,193,695 | 361,553 |
| Mode M9 | |||
|---|---|---|---|
| Quadrant | BADHDUFLAG | Total packets | Discarded packets |
| A | 0 | 39 | 0 |
| B | 0 | 39 | 0 |
| C | 0 | 39 | 0 |
| D | 0 | 39 | 0 |
| Mode M0 | |||
|---|---|---|---|
| Quadrant | BADHDUFLAG | Total packets | Discarded packets |
| A | 0 | 11754 | 3 |
| B | 0 | 12893 | 2 |
| C | 0 | 13482 | 2 |
| D | 0 | 16204 | 2 |
| Mode SS | |||
|---|---|---|---|
| Quadrant | BADHDUFLAG | Total packets | Discarded packets |
| A | 0 | 114 | 0 |
| B | 0 | 114 | 0 |
| C | 0 | 114 | 0 |
| D | 0 | 114 | 0 |
| Quadrant | Total seconds | Saturated seconds | Saturation percentage |
|---|---|---|---|
| A | 5417 | 12 | 0.221525% |
| B | 5417 | 113 | 2.086025% |
| C | 5417 | 170 | 3.138268% |
| D | 5417 | 152 | 2.805981% |
Noise dominated data is calculated using 1-second bins in cleaned event files. If a bin has >2000 counts, and if more than 50% of those come from <1% of pixels, then it is considered to be noise-dominated and hence unusable.
| Quadrant | # 1 sec bins | Bins with >0 counts | Bins with >2000 counts | High rate bins dominated by noise | Noise dominated (total time) | Noise dominated (detector-on time) | Marked lightcurve |
|---|---|---|---|---|---|---|---|
| A | 9391 | 5419 | 3 | 3 | 0.03% | 0.06% | 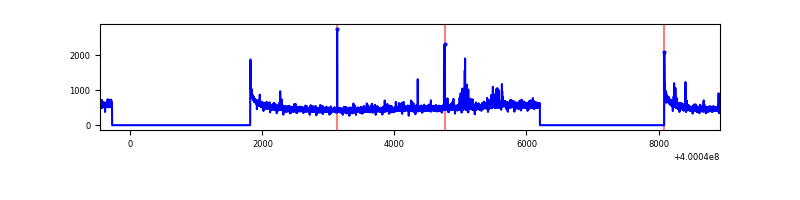 |
| B | 9391 | 5419 | 87 | 87 | 0.93% | 1.61% | 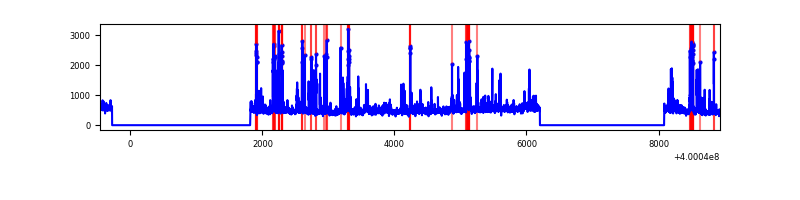 |
| C | 9391 | 5419 | 175 | 175 | 1.86% | 3.23% | 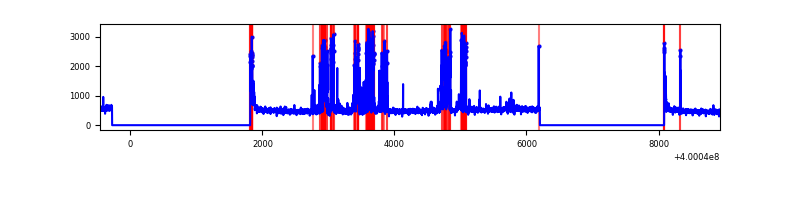 |
| D | 9391 | 5419 | 121 | 121 | 1.29% | 2.23% | 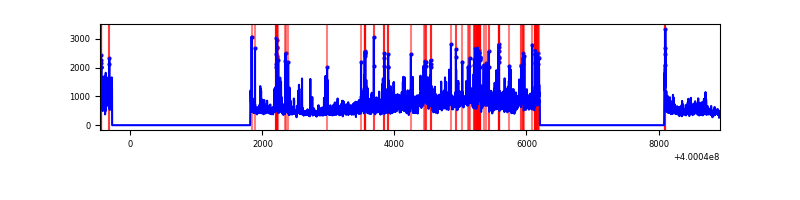 |
Top three noisy pixels from each quadrant. If the there are fewer than three noisy pixels in the level2.evt file, extra rows are filled as -1
| Pixel properties | Quadrant properties | ||||||
|---|---|---|---|---|---|---|---|
| Quadrant | DetID | PixID | Counts | Sigma | Mean | Median | Sigma |
| A | 10 | 83 | 292426 | 2317.89 | 621 | 608 | 125.9 |
| A | 15 | 222 | 40635 | 317.93 | 621 | 608 | 125.9 |
| A | 13 | 248 | 32693 | 254.85 | 621 | 608 | 125.9 |
| B | 5 | 172 | 499877 | 4190.32 | 614 | 598 | 119.2 |
| B | 15 | 35 | 79334 | 660.81 | 614 | 598 | 119.2 |
| B | 0 | 190 | 79306 | 660.58 | 614 | 598 | 119.2 |
| C | 14 | 254 | 772509 | 5411.3 | 604 | 608 | 142.6 |
| C | 15 | 214 | 233199 | 1630.54 | 604 | 608 | 142.6 |
| C | 0 | 10 | 68315 | 474.65 | 604 | 608 | 142.6 |
| D | 1 | 52 | 1083453 | 7315.83 | 602 | 586 | 148.0 |
| D | 13 | 249 | 228466 | 1539.55 | 602 | 586 | 148.0 |
| D | 10 | 199 | 185281 | 1247.8 | 602 | 586 | 148.0 |
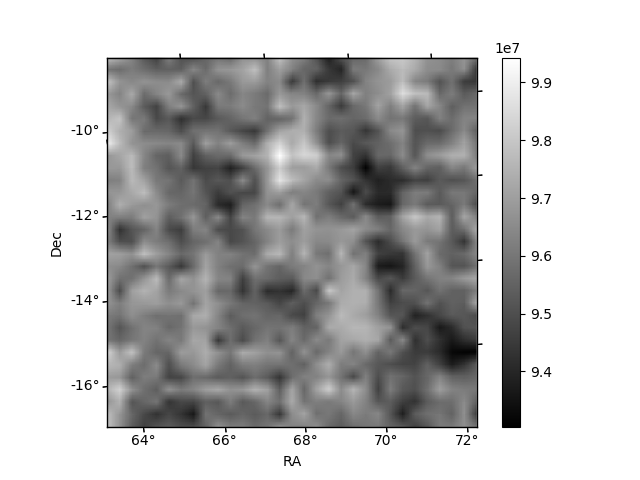
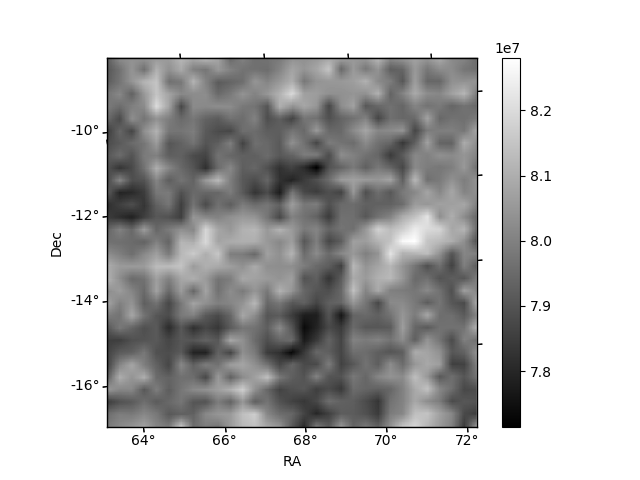
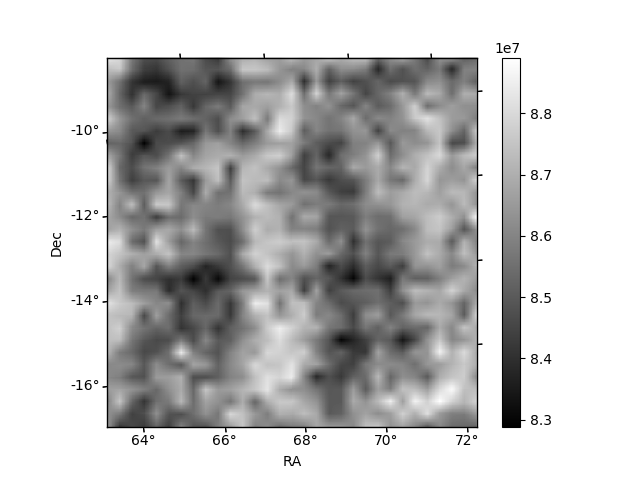
Histogram calculated using DETX and DETY for each event in the final _common_clean file
| Quadrant A | 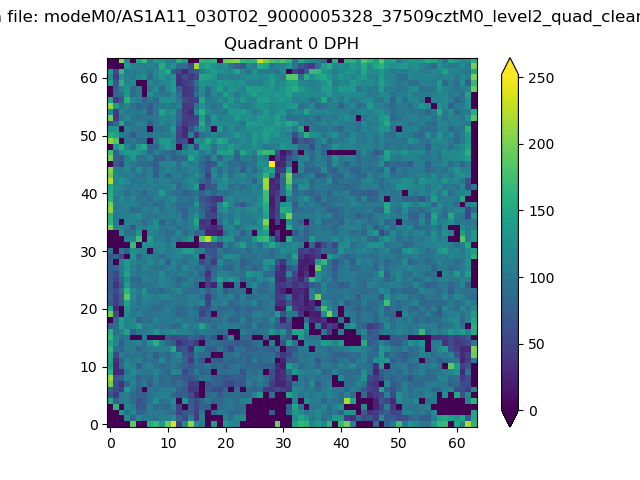 |
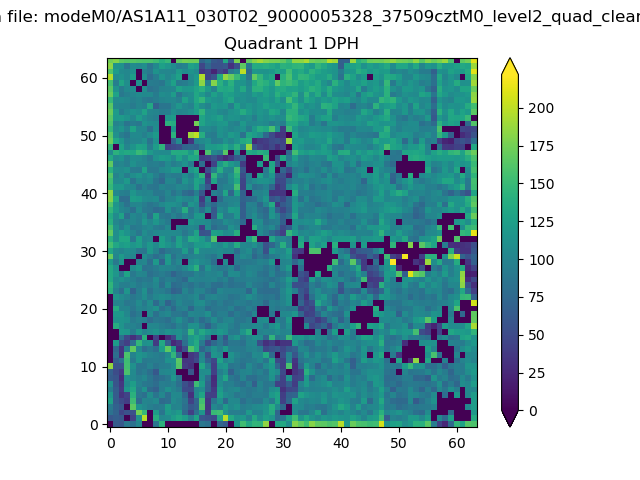 |
Quadrant B |
|---|---|---|---|
| Quadrant D | 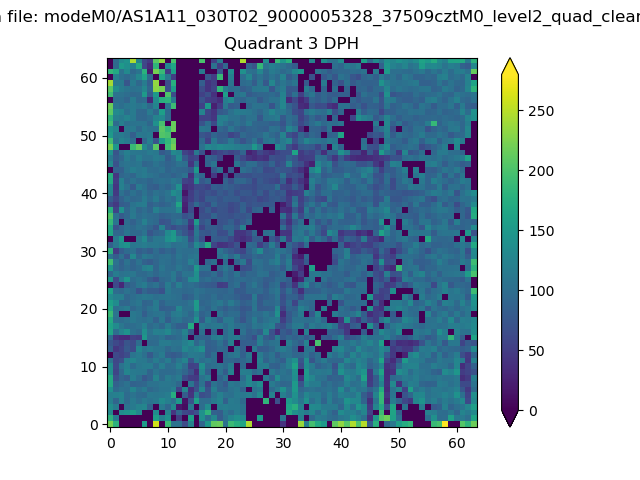 |
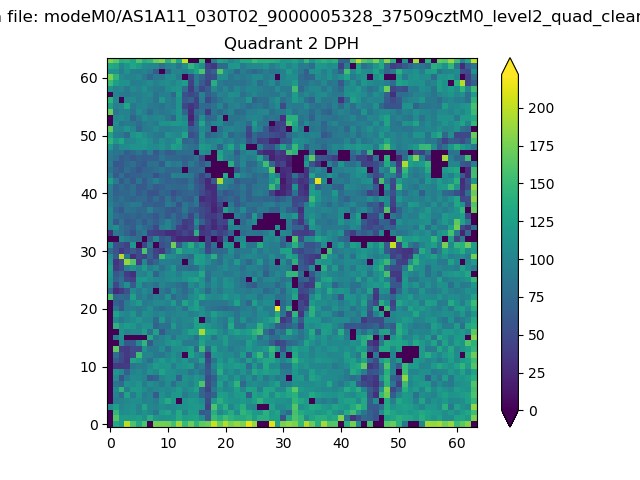 |
Quadrant C |
| Plot type | Count rate plots | Images |
|---|---|---|
| Comparison with Poisson distribution Blue bars denote a histogram of data divided into 1 sec bins. Red curve is a Poisson curve with rate = median count rate of data. |
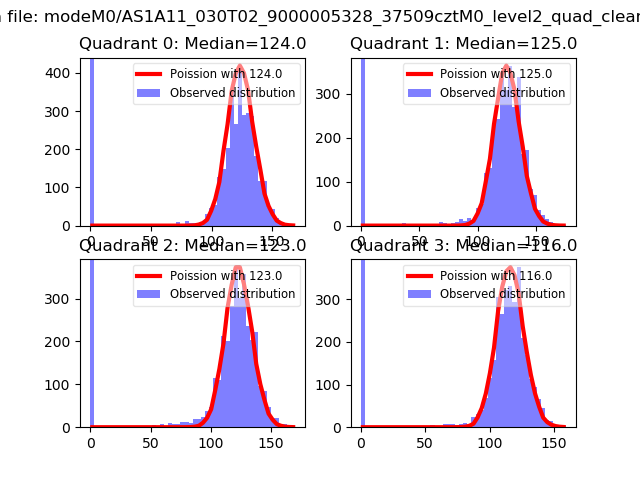 |
 |
| Quadrant-wise count rates Data is divided into 100 sec bins |
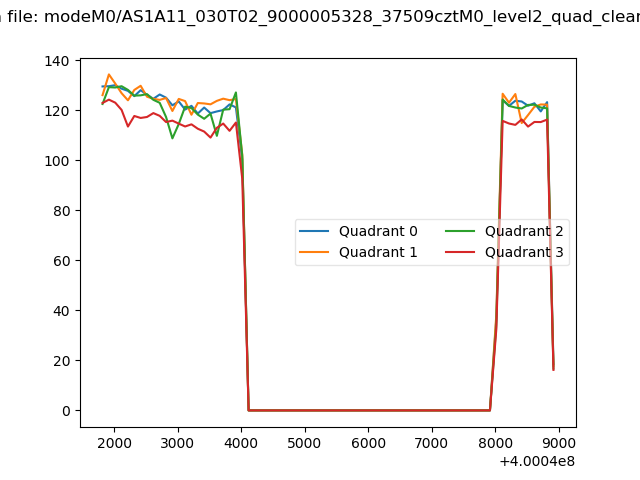 |
|
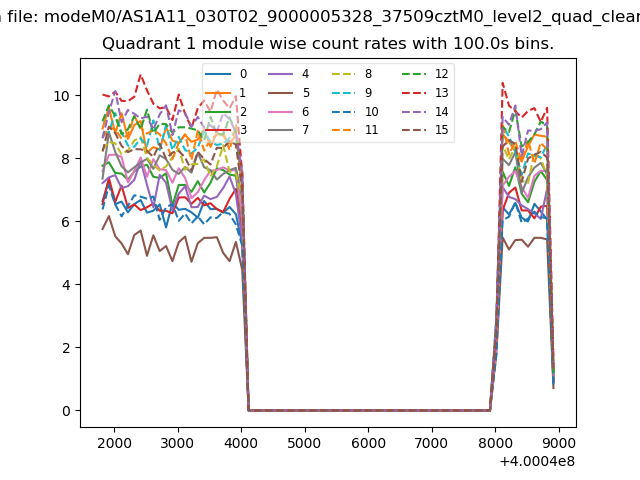
| Module-wise count rates for Quadrant A Data is divided into 100 sec bins |
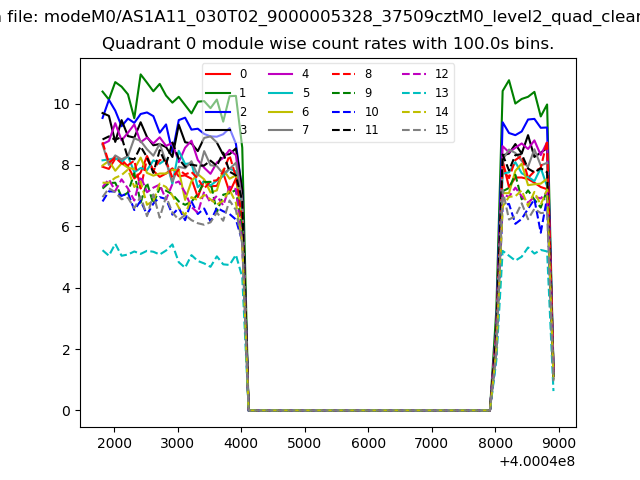 |
 |
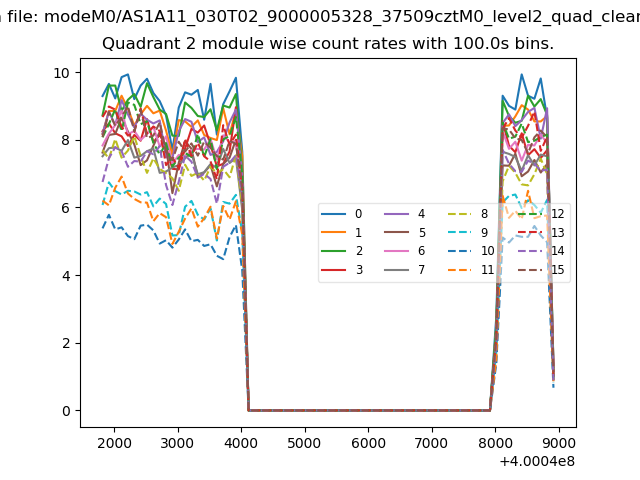
| Module-wise count rates for Quadrant B Data is divided into 100 sec bins |
 |
 |
| Module-wise count rates for Quadrant C Data is divided into 100 sec bins |
 |
 |
| Module-wise count rates for Quadrant D Data is divided into 100 sec bins |
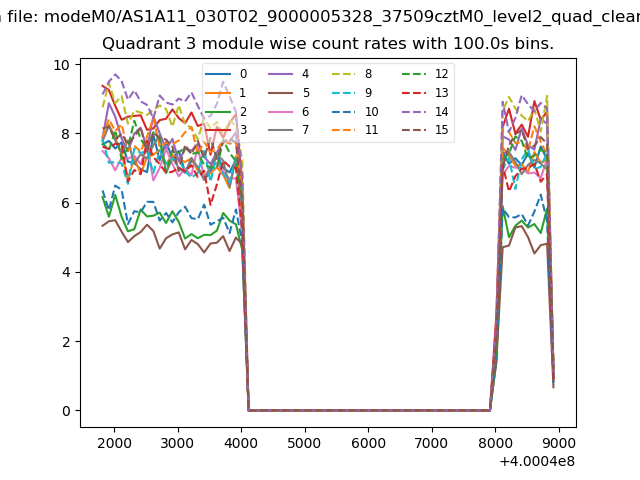 |
 |
| Parameter | Plot |
|---|---|
| CZT HV Monitor | 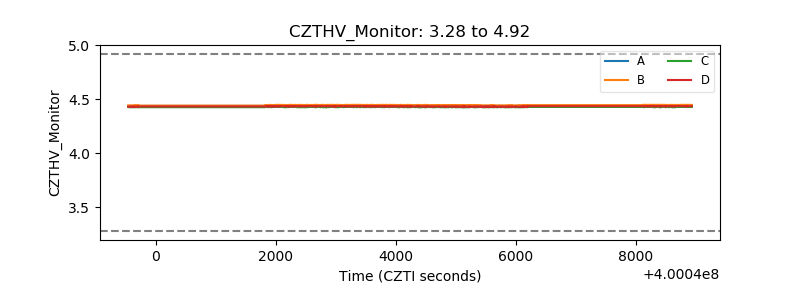 |
| D_VDD | 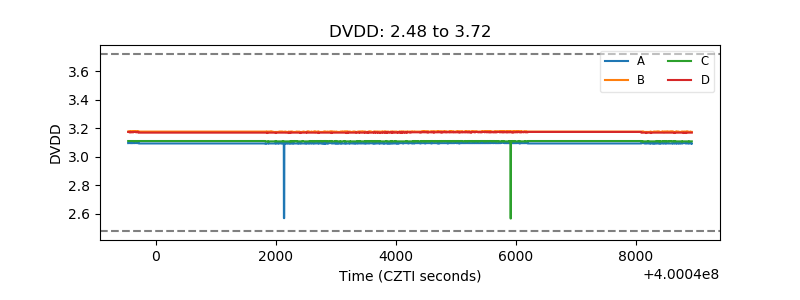 |
| Temperature 1 | 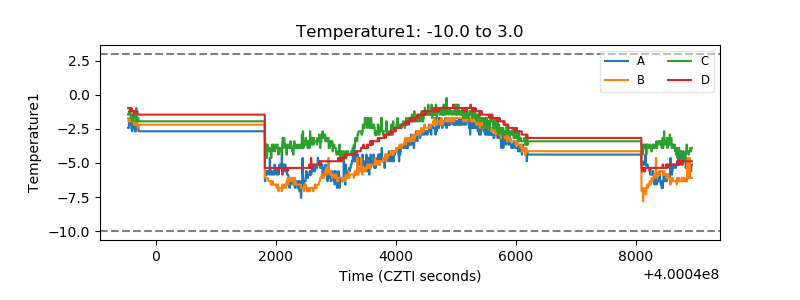 |
| Veto HV Monitor | 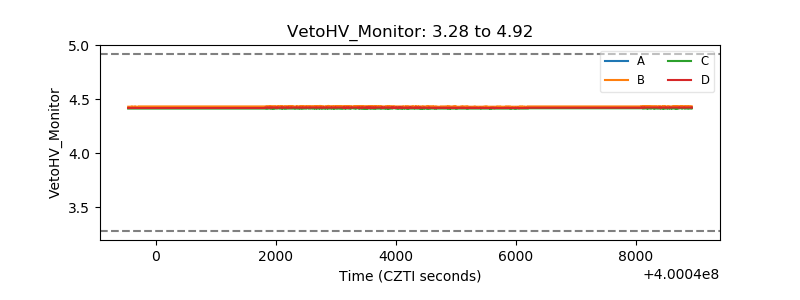 |
| Veto LLD | 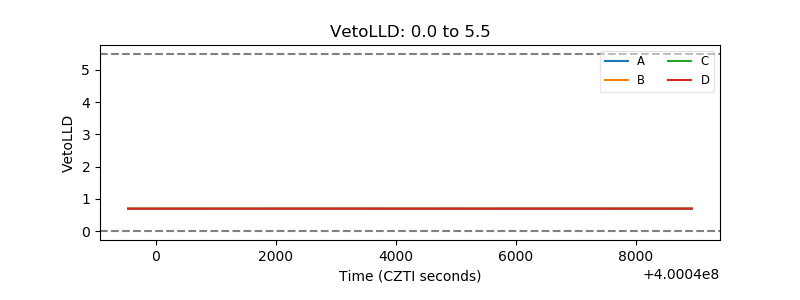 |
| Alpha Counter | 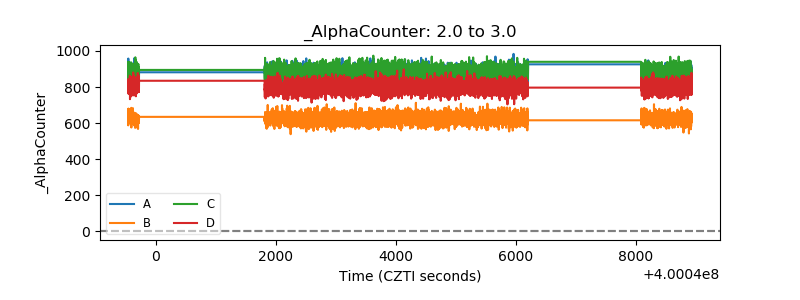 |
| _CPM_Rate | 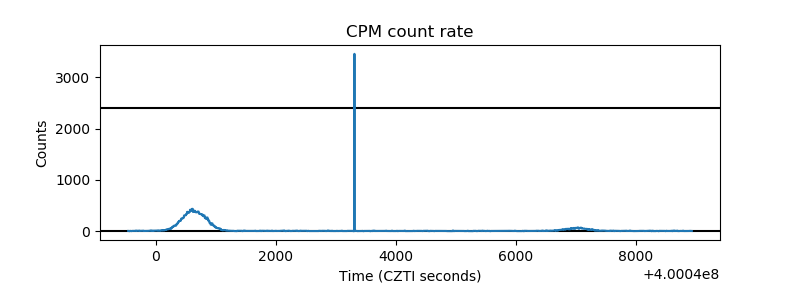 |
| CZT Counter | 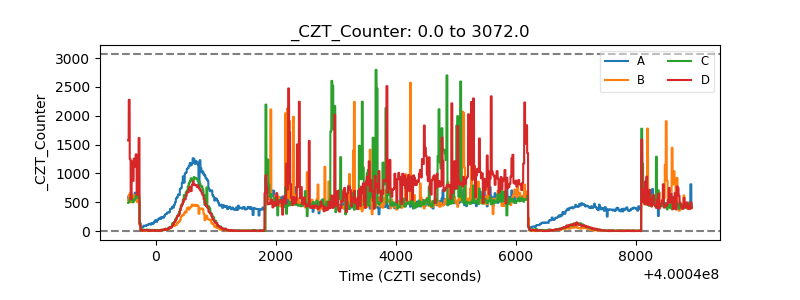 |
| +2.5 Volts monitor | 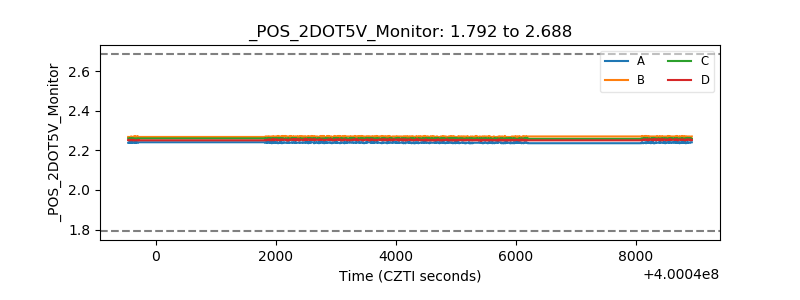 |
| +5 Volts monitor | 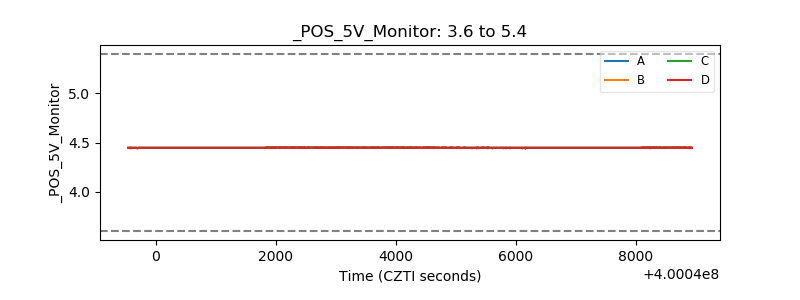 |
| _ROLL_ROT | 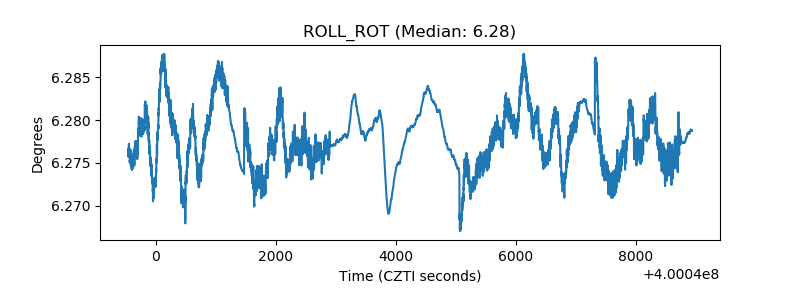 |
| _Roll_DEC | 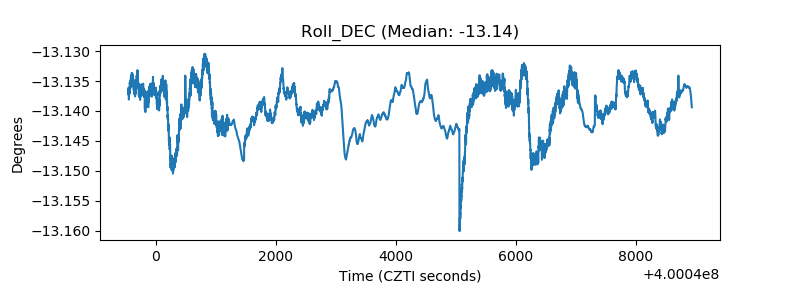 |
| _Roll_RA | 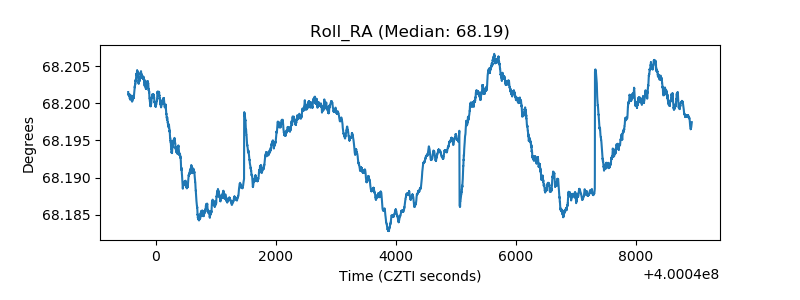 |
| Veto Counter | 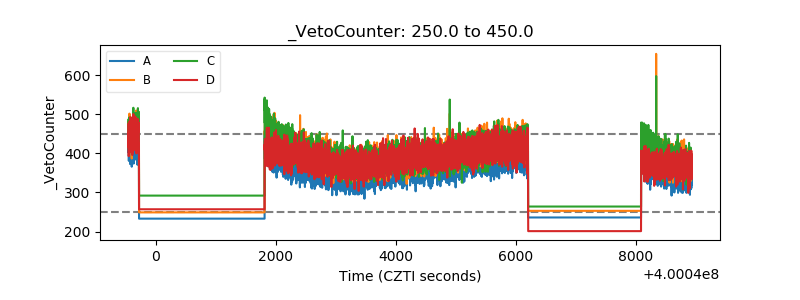 |