| Param | Original file | Final file |
|---|---|---|
| Filename | modeM0/AS1A11_030T02_9000005328_37515cztM0_level2.evt | modeM0/AS1A11_030T02_9000005328_37515cztM0_level2_quad_clean.evt |
| Size (bytes) | 1,847,266,560 | 240,048,000 |
| Size | 1.7 GB | 228.9 MB |
| Events in quadrant A | 11,558,723 | 1,469,551 |
| Events in quadrant B | 14,089,976 | 1,448,837 |
| Events in quadrant C | 12,424,909 | 1,448,442 |
| Events in quadrant D | 16,346,782 | 1,347,042 |
| Mode M9 | |||
|---|---|---|---|
| Quadrant | BADHDUFLAG | Total packets | Discarded packets |
| A | 0 | 68 | 0 |
| B | 0 | 68 | 0 |
| C | 0 | 68 | 0 |
| D | 0 | 69 | 0 |
| Mode M0 | |||
|---|---|---|---|
| Quadrant | BADHDUFLAG | Total packets | Discarded packets |
| A | 0 | 47918 | 150 |
| B | 0 | 56517 | 251 |
| C | 0 | 50640 | 174 |
| D | 0 | 64083 | 329 |
| Mode SS | |||
|---|---|---|---|
| Quadrant | BADHDUFLAG | Total packets | Discarded packets |
| A | 0 | 460 | 0 |
| B | 0 | 458 | 0 |
| C | 0 | 460 | 0 |
| D | 0 | 460 | 0 |
| Quadrant | Total seconds | Saturated seconds | Saturation percentage |
|---|---|---|---|
| A | 22610 | 64 | 0.283061% |
| B | 22601 | 938 | 4.150259% |
| C | 22628 | 396 | 1.750044% |
| D | 22600 | 1580 | 6.991150% |
Noise dominated data is calculated using 1-second bins in cleaned event files. If a bin has >2000 counts, and if more than 50% of those come from <1% of pixels, then it is considered to be noise-dominated and hence unusable.
| Quadrant | # 1 sec bins | Bins with >0 counts | Bins with >2000 counts | High rate bins dominated by noise | Noise dominated (total time) | Noise dominated (detector-on time) | Marked lightcurve |
|---|---|---|---|---|---|---|---|
| A | 34559 | 22680 | 36 | 36 | 0.10% | 0.16% | 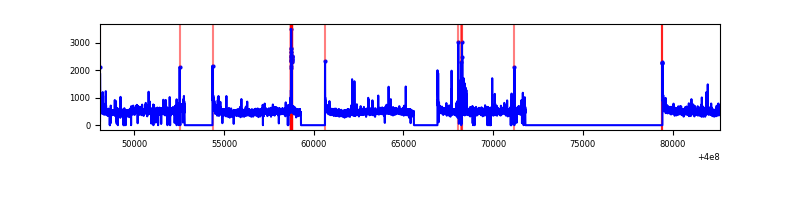 |
| B | 34558 | 22676 | 725 | 725 | 2.10% | 3.20% | 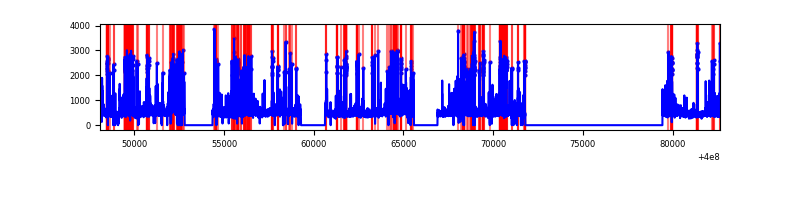 |
| C | 34559 | 22682 | 324 | 324 | 0.94% | 1.43% | 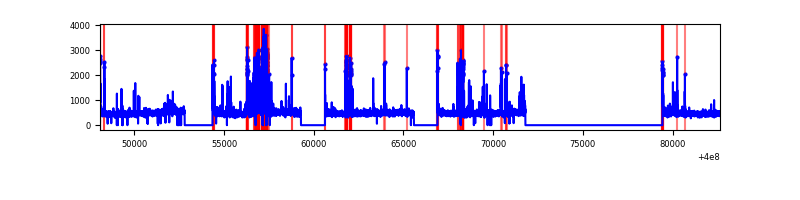 |
| D | 34559 | 22675 | 1499 | 1499 | 4.34% | 6.61% | 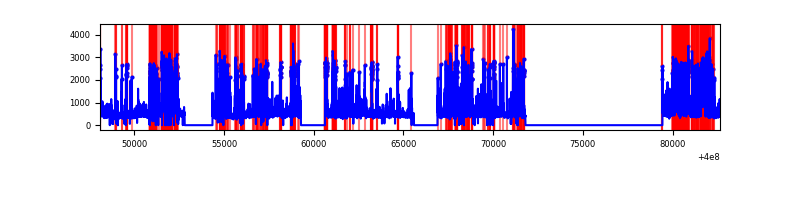 |
Top three noisy pixels from each quadrant. If the there are fewer than three noisy pixels in the level2.evt file, extra rows are filled as -1
| Pixel properties | Quadrant properties | ||||||
|---|---|---|---|---|---|---|---|
| Quadrant | DetID | PixID | Counts | Sigma | Mean | Median | Sigma |
| A | 10 | 83 | 1032915 | 1985.92 | 2580 | 2529 | 518.8 |
| A | 15 | 222 | 194664 | 370.31 | 2580 | 2529 | 518.8 |
| A | 13 | 248 | 91704 | 171.87 | 2580 | 2529 | 518.8 |
| B | 5 | 172 | 2467483 | 5088.81 | 2526 | 2455 | 484.4 |
| B | 15 | 35 | 777655 | 1600.33 | 2526 | 2455 | 484.4 |
| B | 0 | 213 | 348152 | 713.66 | 2526 | 2455 | 484.4 |
| C | 14 | 254 | 1427273 | 2437.17 | 2505 | 2531 | 584.6 |
| C | 15 | 214 | 949674 | 1620.19 | 2505 | 2531 | 584.6 |
| C | 0 | 10 | 144606 | 243.03 | 2505 | 2531 | 584.6 |
| D | 13 | 249 | 2385083 | 4015.67 | 2442 | 2377 | 593.4 |
| D | 13 | 171 | 1878142 | 3161.3 | 2442 | 2377 | 593.4 |
| D | 2 | 249 | 742750 | 1247.78 | 2442 | 2377 | 593.4 |
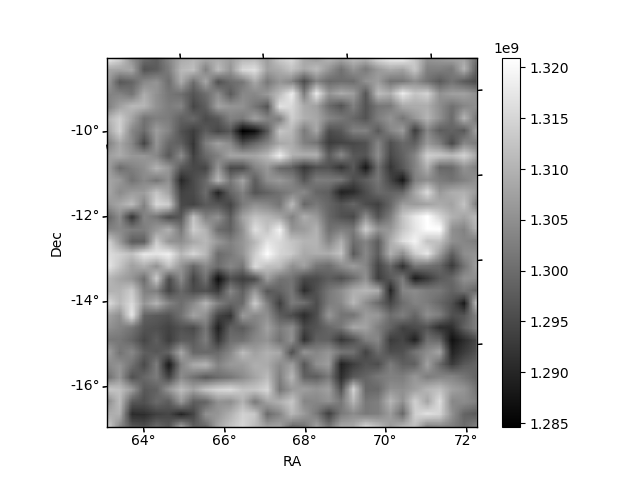
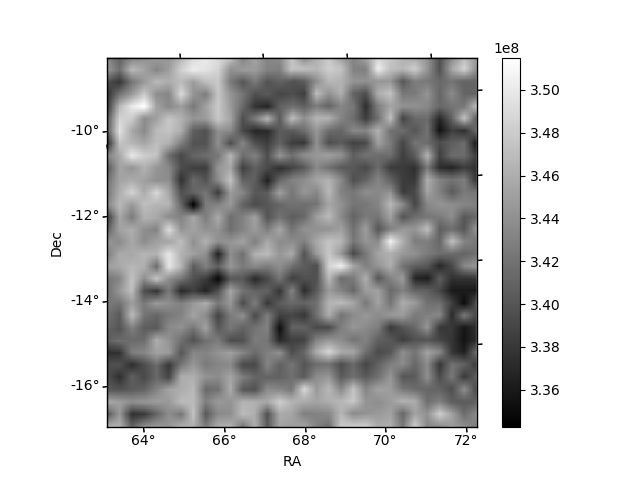
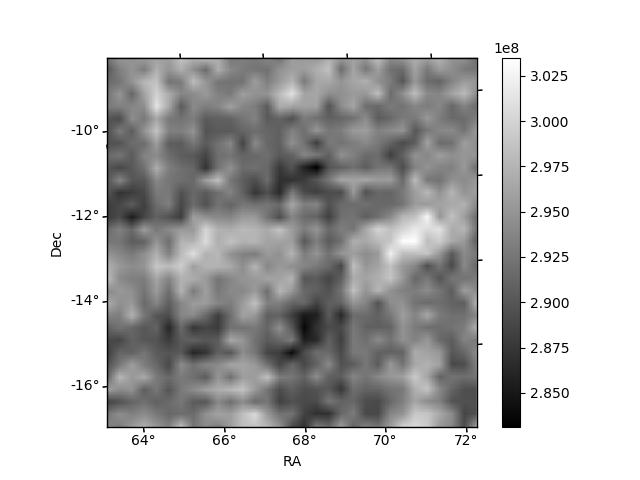
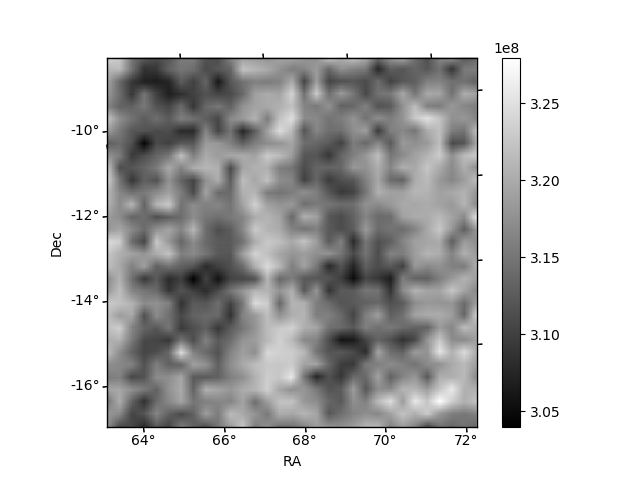
Histogram calculated using DETX and DETY for each event in the final _common_clean file
| Quadrant A | 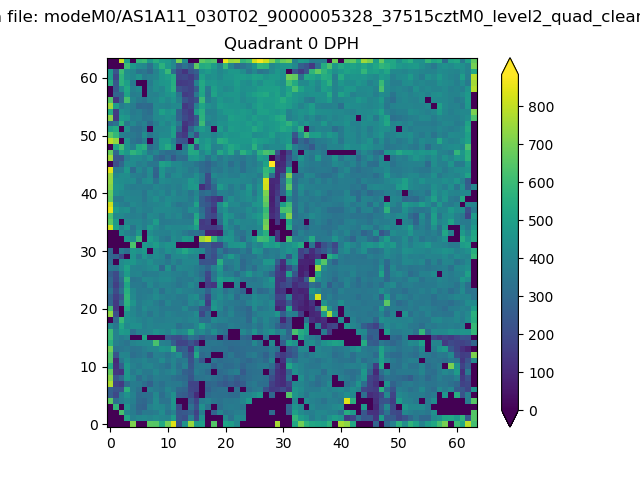 |
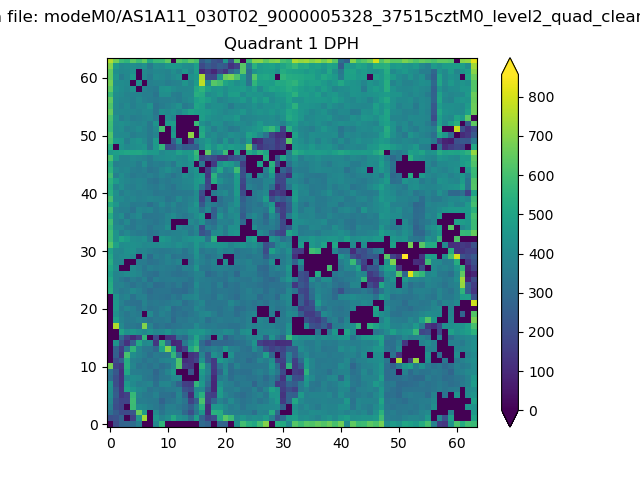 |
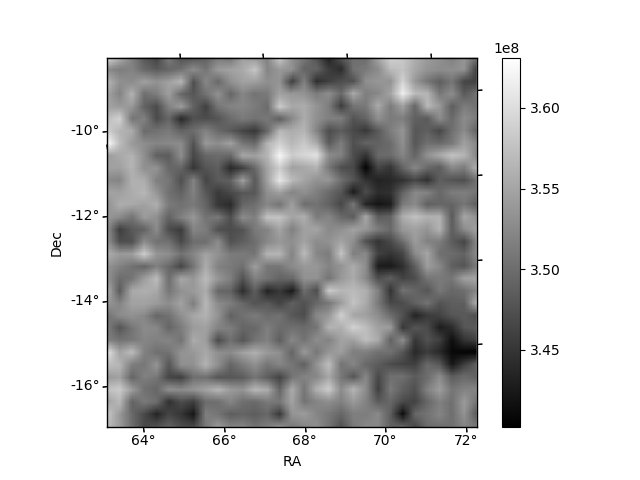
Quadrant B |
|---|---|---|---|
| Quadrant D | 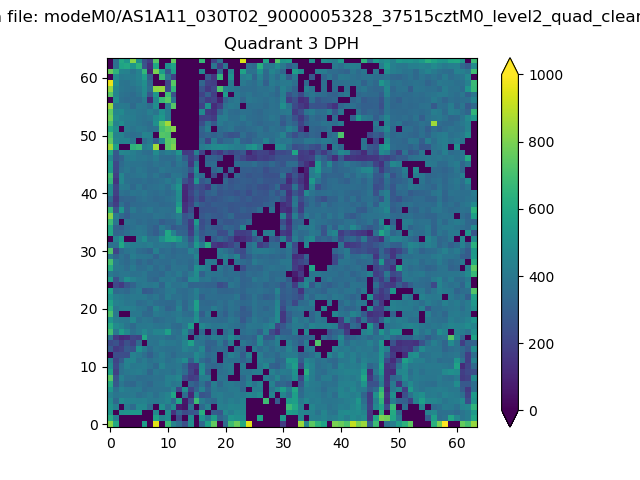 |
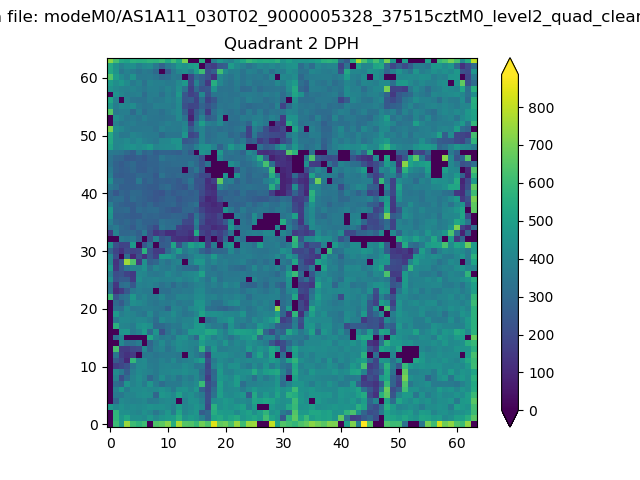 |
Quadrant C |
| Plot type | Count rate plots | Images |
|---|---|---|
| Comparison with Poisson distribution Blue bars denote a histogram of data divided into 1 sec bins. Red curve is a Poisson curve with rate = median count rate of data. |
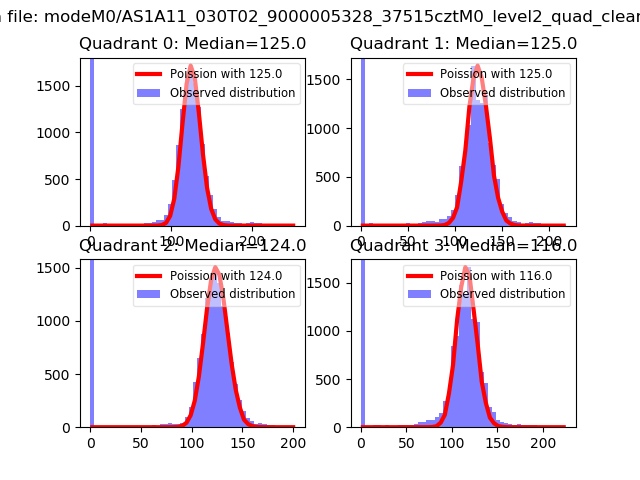 |
 |
| Quadrant-wise count rates Data is divided into 100 sec bins |
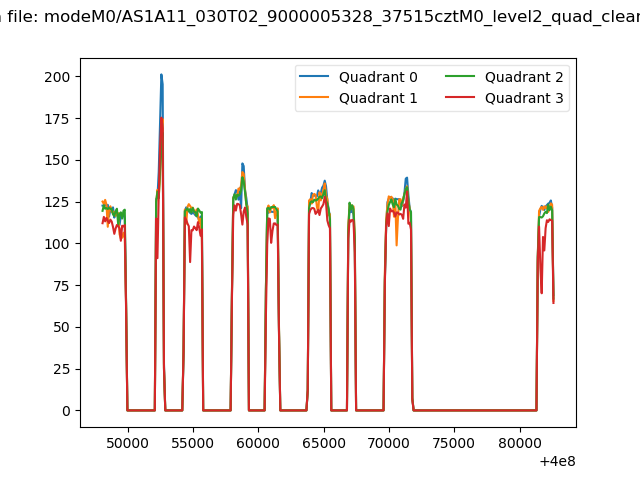 |
|
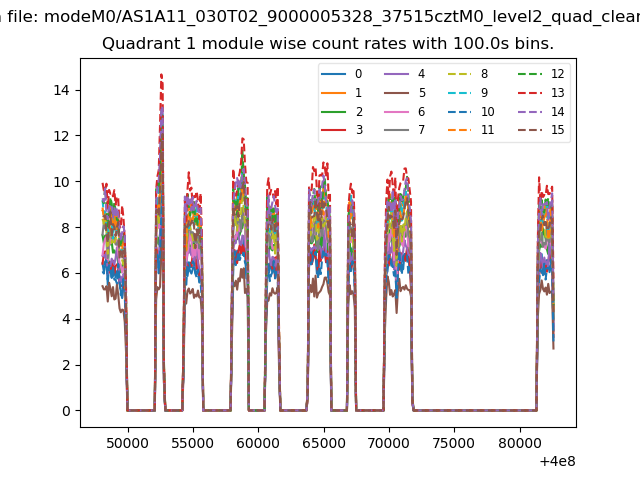
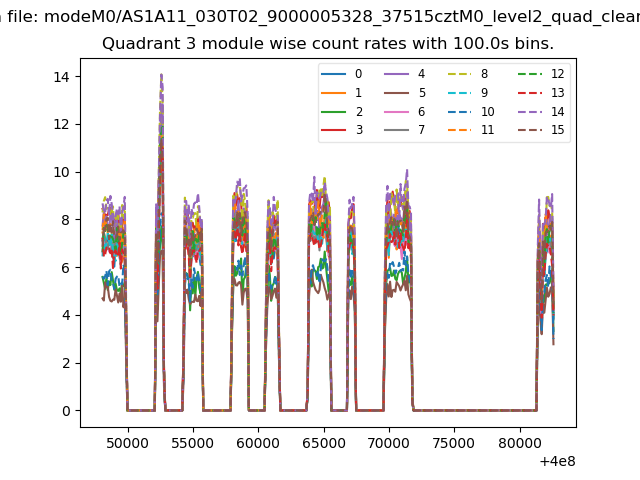
| Module-wise count rates for Quadrant A Data is divided into 100 sec bins |
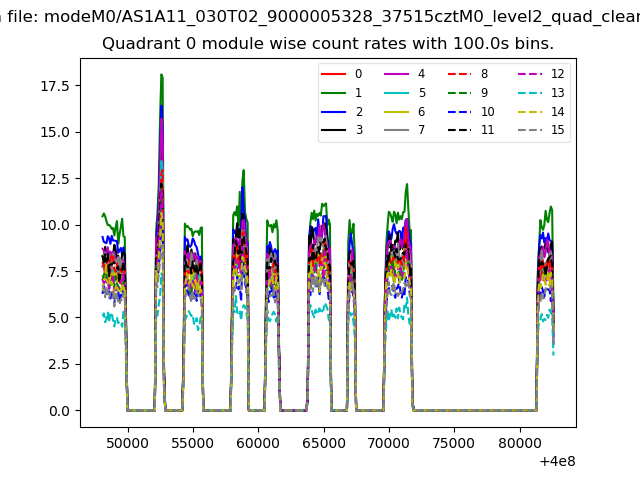 |
 |
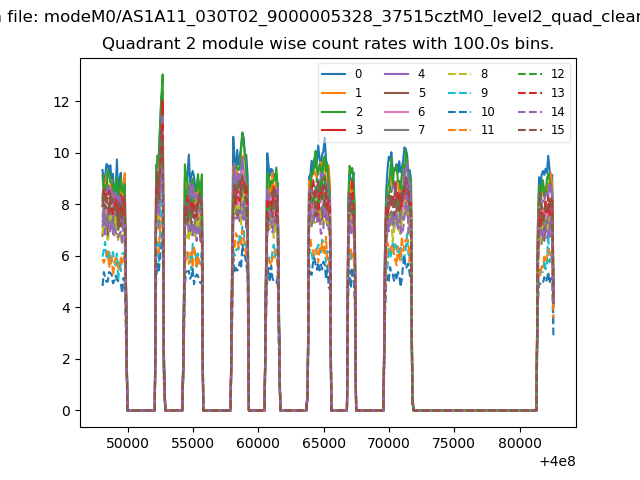
| Module-wise count rates for Quadrant B Data is divided into 100 sec bins |
 |
 |
| Module-wise count rates for Quadrant C Data is divided into 100 sec bins |
 |
 |
| Module-wise count rates for Quadrant D Data is divided into 100 sec bins |
 |
 |
| Parameter | Plot |
|---|---|
| CZT HV Monitor | 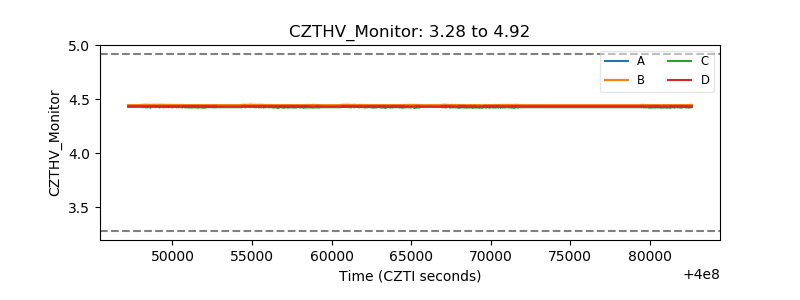 |
| D_VDD | 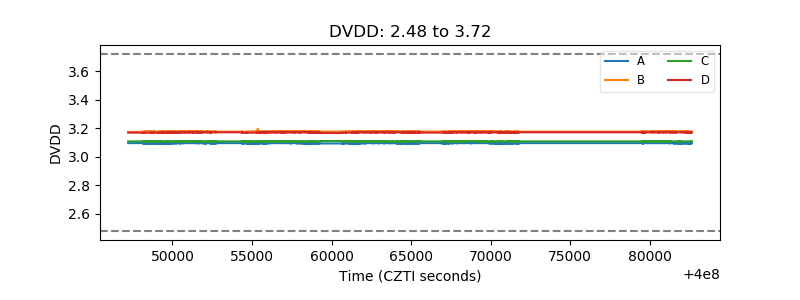 |
| Temperature 1 | 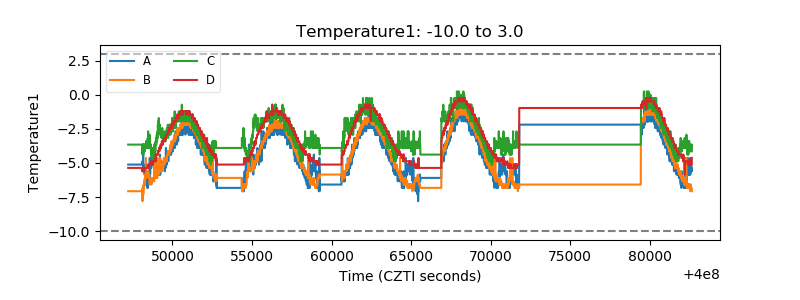 |
| Veto HV Monitor | 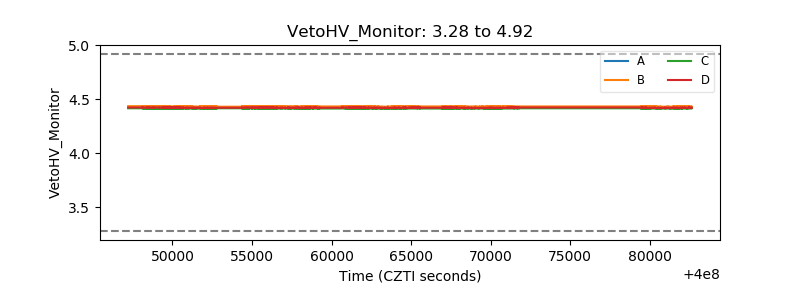 |
| Veto LLD | 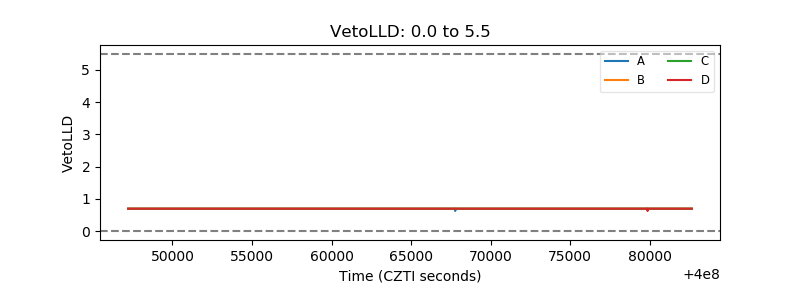 |
| Alpha Counter | 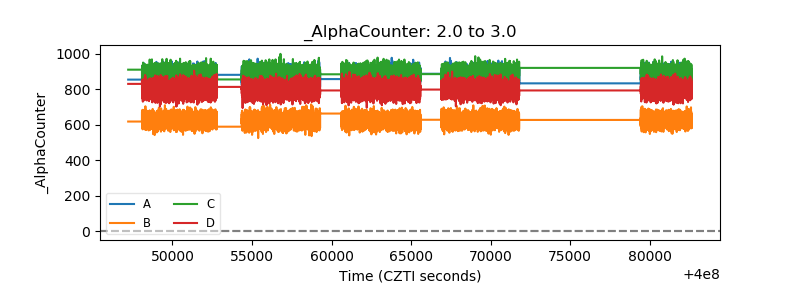 |
| _CPM_Rate | 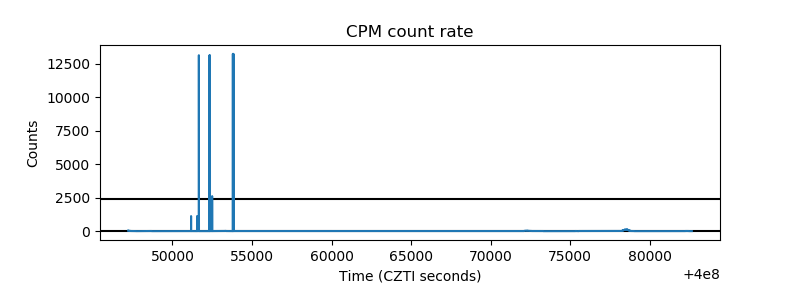 |
| CZT Counter | 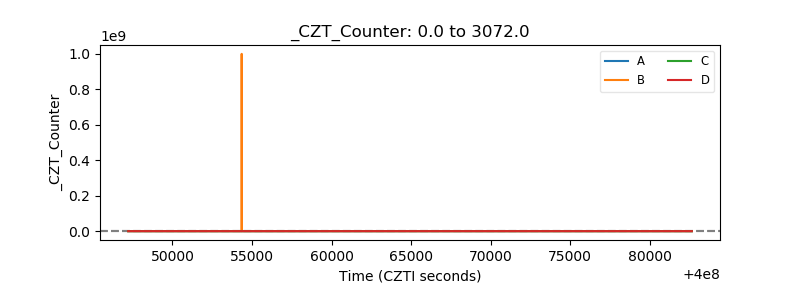 |
| +2.5 Volts monitor | 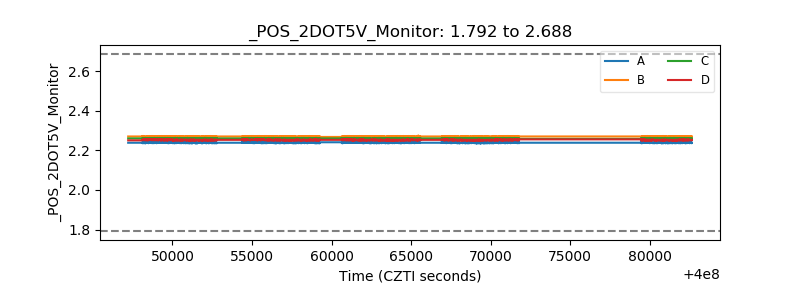 |
| +5 Volts monitor | 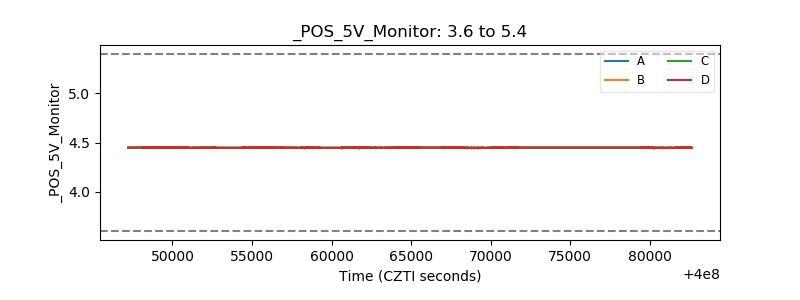 |
| _ROLL_ROT | 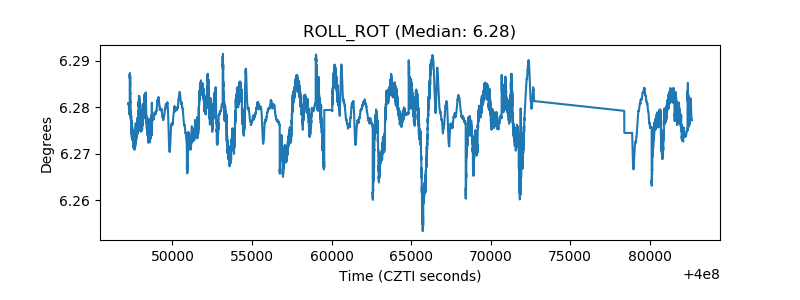 |
| _Roll_DEC | 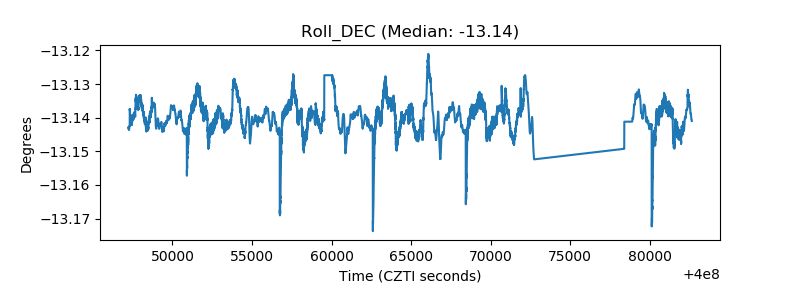 |
| _Roll_RA | 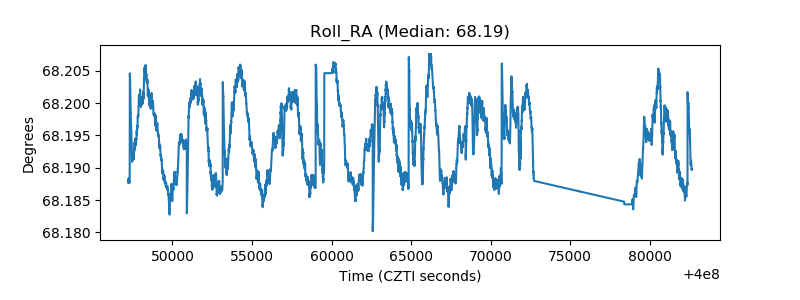 |
| Veto Counter | 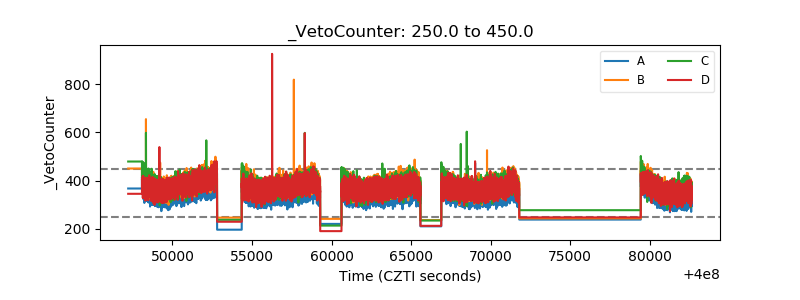 |