| Param | Original file | Final file |
|---|---|---|
| Filename | modeM0/AS1A09_061T01_9000005330cztM0_level2.fits | modeM0/AS1A09_061T01_9000005330cztM0_level2_quad_clean.evt |
| Size (bytes) | 674,435,520 | 721,339,200 |
| Size | 643.2 MB | 687.9 MB |
| Events in quadrant A | 4,255,056 | 4,502,363 |
| Events in quadrant B | 4,047,354 | 4,489,398 |
| Events in quadrant C | 4,230,085 | 4,343,564 |
| Events in quadrant D | 2,819,277 | 3,443,785 |
| Mode SS | |||
|---|---|---|---|
| Quadrant | BADHDUFLAG | Total packets | Discarded packets |
| A | 0 | 1522 | 0 |
| B | 0 | 1521 | 0 |
| C | 0 | 1521 | 0 |
| D | 0 | 1522 | 0 |
| Mode M9 | |||
|---|---|---|---|
| Quadrant | BADHDUFLAG | Total packets | Discarded packets |
| A | 0 | 304 | 0 |
| B | 0 | 303 | 0 |
| C | 0 | 304 | 0 |
| D | 0 | 305 | 0 |
| Mode M0 | |||
|---|---|---|---|
| Quadrant | BADHDUFLAG | Total packets | Discarded packets |
| A | 0 | 169721 | 0 |
| B | 0 | 176441 | 0 |
| C | 0 | 167425 | 0 |
| D | 0 | 262056 | 0 |
| Quadrant | Total seconds | Saturated seconds | Saturation percentage |
|---|---|---|---|
| A | 73860 | 543 | 0.735175% |
| B | 73935 | 2203 | 2.979644% |
| C | 73869 | 1027 | 1.390299% |
| D | 73760 | 11893 | 16.123915% |
Noise dominated data is calculated using 1-second bins in cleaned event files. If a bin has >2000 counts, and if more than 50% of those come from <1% of pixels, then it is considered to be noise-dominated and hence unusable.
| Quadrant | # 1 sec bins | Bins with >0 counts | Bins with >2000 counts | High rate bins dominated by noise | Noise dominated (total time) | Noise dominated (detector-on time) | Marked lightcurve |
|---|---|---|---|---|---|---|---|
| A | 116483 | 74331 | 0 | 0 | 0.00% | 0.00% |  |
| B | 116483 | 74319 | 0 | 0 | 0.00% | 0.00% |  |
| C | 116483 | 74286 | 0 | 0 | 0.00% | 0.00% | 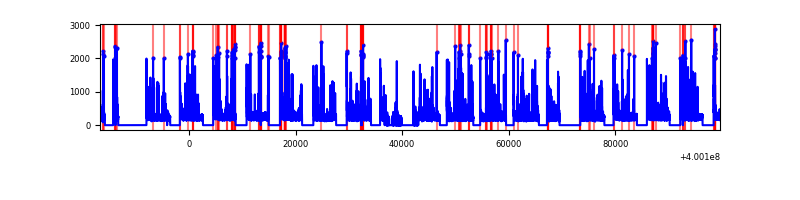 |
| D | 116483 | 71734 | 0 | 0 | 0.00% | 0.00% |  |
Top three noisy pixels from each quadrant. If the there are fewer than three noisy pixels in the level2.evt file, extra rows are filled as -1
| Pixel properties | Quadrant properties | ||||||
|---|---|---|---|---|---|---|---|
| Quadrant | DetID | PixID | Counts | Sigma | Mean | Median | Sigma |
| A | 9 | 19 | 3495 | 8.88 | 1113 | 1045 | 275.8 |
| A | 0 | 29 | 3434 | 8.66 | 1113 | 1045 | 275.8 |
| A | 7 | 110 | 3308 | 8.21 | 1113 | 1045 | 275.8 |
| B | 2 | 9 | 3460 | 11.47 | 1077 | 1028 | 212.0 |
| B | 3 | 80 | 3259 | 10.53 | 1077 | 1028 | 212.0 |
| B | 3 | 17 | 2867 | 8.68 | 1077 | 1028 | 212.0 |
| C | 1 | 81 | 3663 | 9.13 | 1120 | 1053 | 285.9 |
| C | 1 | 80 | 3438 | 8.34 | 1120 | 1053 | 285.9 |
| C | 3 | 202 | 3351 | 8.04 | 1120 | 1053 | 285.9 |
| D | 10 | 189 | 2195 | 7.21 | 807 | 745 | 201.0 |
| D | 7 | 3 | 2002 | 6.25 | 807 | 745 | 201.0 |
| D | 4 | 160 | 1987 | 6.18 | 807 | 745 | 201.0 |
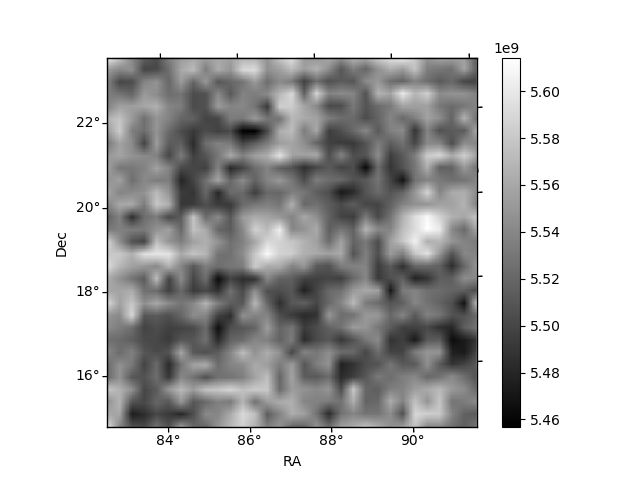
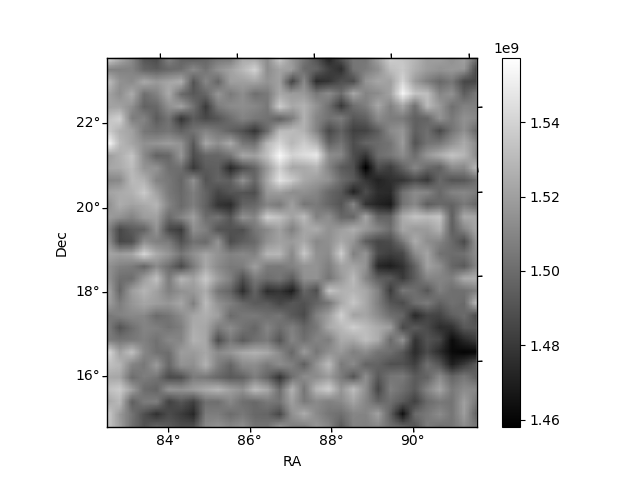
Histogram calculated using DETX and DETY for each event in the final _common_clean file
| Quadrant A |  |
 |
Quadrant B |
|---|---|---|---|
| Quadrant D |  |
 |
Quadrant C |
| Plot type | Count rate plots | Images |
|---|---|---|
| Comparison with Poisson distribution Blue bars denote a histogram of data divided into 1 sec bins. Red curve is a Poisson curve with rate = median count rate of data. |
 |
 |
| Quadrant-wise count rates Data is divided into 100 sec bins |
 |
|
| Module-wise count rates for Quadrant A Data is divided into 100 sec bins |
 |
 |
| Module-wise count rates for Quadrant B Data is divided into 100 sec bins |
 |
 |
| Module-wise count rates for Quadrant C Data is divided into 100 sec bins |
 |
 |
| Module-wise count rates for Quadrant D Data is divided into 100 sec bins |
 |
 |
| Parameter | Plot |
|---|---|
| CZT HV Monitor |  |
| D_VDD |  |
| Temperature 1 |  |
| Veto HV Monitor |  |
| Veto LLD |  |
| Alpha Counter |  |
| _CPM_Rate |  |
| CZT Counter |  |
| +2.5 Volts monitor | 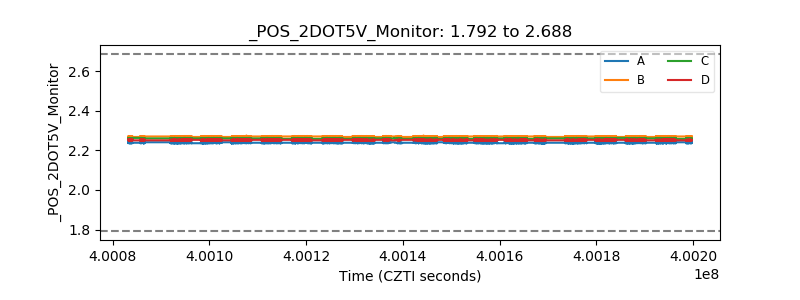 |
| +5 Volts monitor |  |
| _ROLL_ROT | 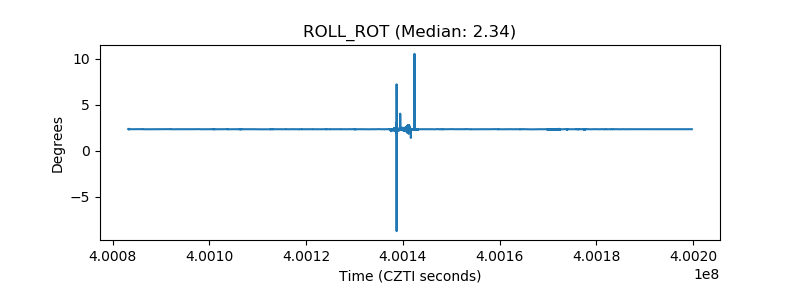 |
| _Roll_DEC | 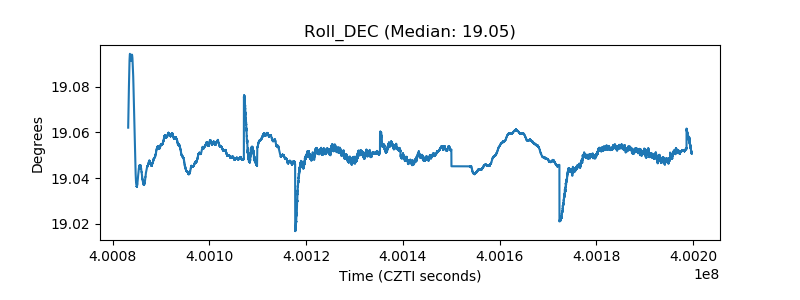 |
| _Roll_RA |  |
| Veto Counter |  |