| Param | Original file | Final file |
|---|---|---|
| Filename | modeM0/AS1A09_061T01_9000005330_37515cztM0_level2.evt | modeM0/AS1A09_061T01_9000005330_37515cztM0_level2_quad_clean.evt |
| Size (bytes) | 172,054,080 | 19,670,400 |
| Size | 164.1 MB | 18.8 MB |
| Events in quadrant A | 1,157,615 | 117,941 |
| Events in quadrant B | 1,088,441 | 118,172 |
| Events in quadrant C | 1,127,859 | 113,284 |
| Events in quadrant D | 1,708,026 | 109,613 |
| Mode SS | |||
|---|---|---|---|
| Quadrant | BADHDUFLAG | Total packets | Discarded packets |
| A | 0 | 40 | 0 |
| B | 0 | 40 | 0 |
| C | 0 | 40 | 0 |
| D | 0 | 40 | 0 |
| Mode M9 | |||
|---|---|---|---|
| Quadrant | BADHDUFLAG | Total packets | Discarded packets |
| A | 0 | 15 | 0 |
| B | 0 | 15 | 0 |
| C | 0 | 15 | 0 |
| D | 0 | 15 | 0 |
| Mode M0 | |||
|---|---|---|---|
| Quadrant | BADHDUFLAG | Total packets | Discarded packets |
| A | 0 | 4616 | 2 |
| B | 0 | 4418 | 1 |
| C | 0 | 4423 | 1 |
| D | 0 | 6336 | 1 |
| Quadrant | Total seconds | Saturated seconds | Saturation percentage |
|---|---|---|---|
| A | 1858 | 29 | 1.560818% |
| B | 1858 | 27 | 1.453175% |
| C | 1858 | 57 | 3.067815% |
| D | 1858 | 213 | 11.463940% |
Noise dominated data is calculated using 1-second bins in cleaned event files. If a bin has >2000 counts, and if more than 50% of those come from <1% of pixels, then it is considered to be noise-dominated and hence unusable.
| Quadrant | # 1 sec bins | Bins with >0 counts | Bins with >2000 counts | High rate bins dominated by noise | Noise dominated (total time) | Noise dominated (detector-on time) | Marked lightcurve |
|---|---|---|---|---|---|---|---|
| A | 3411 | 1859 | 16 | 16 | 0.47% | 0.86% | 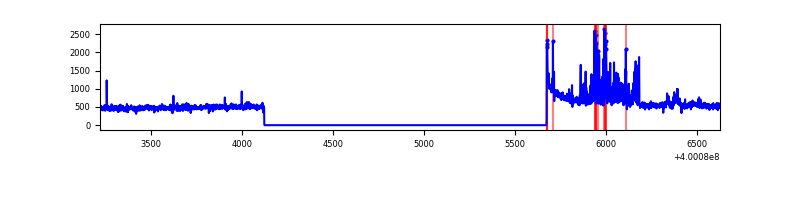 |
| B | 3411 | 1859 | 12 | 12 | 0.35% | 0.65% | 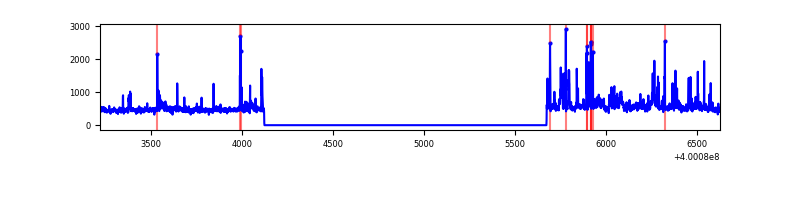 |
| C | 3411 | 1859 | 48 | 48 | 1.41% | 2.58% | 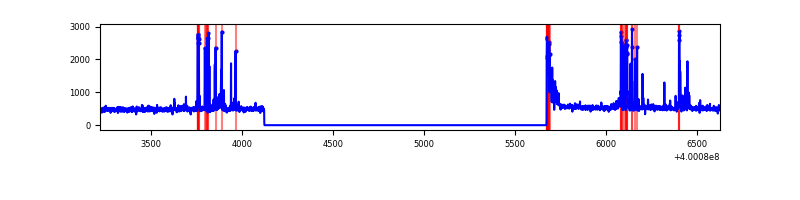 |
| D | 3410 | 1858 | 179 | 179 | 5.25% | 9.63% | 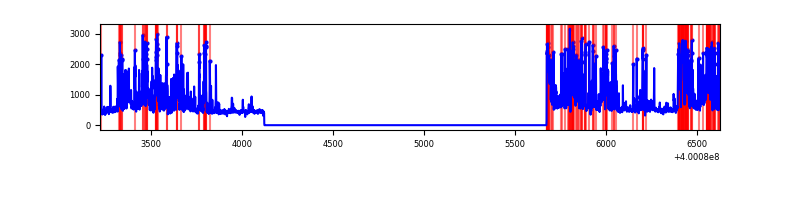 |
Top three noisy pixels from each quadrant. If the there are fewer than three noisy pixels in the level2.evt file, extra rows are filled as -1
| Pixel properties | Quadrant properties | ||||||
|---|---|---|---|---|---|---|---|
| Quadrant | DetID | PixID | Counts | Sigma | Mean | Median | Sigma |
| A | 15 | 222 | 134808 | 2846.59 | 223 | 218 | 47.3 |
| A | 10 | 83 | 128093 | 2704.57 | 223 | 218 | 47.3 |
| A | 12 | 189 | 21282 | 445.51 | 223 | 218 | 47.3 |
| B | 5 | 172 | 73411 | 1628.1 | 221 | 215 | 45.0 |
| B | 15 | 35 | 56751 | 1257.53 | 221 | 215 | 45.0 |
| B | 0 | 213 | 49119 | 1087.77 | 221 | 215 | 45.0 |
| C | 14 | 254 | 150148 | 2891.32 | 213 | 214 | 51.9 |
| C | 15 | 214 | 81372 | 1565.05 | 213 | 214 | 51.9 |
| C | 0 | 10 | 51078 | 980.86 | 213 | 214 | 51.9 |
| D | 2 | 249 | 356707 | 6696.48 | 207 | 201 | 53.2 |
| D | 13 | 249 | 333691 | 6264.15 | 207 | 201 | 53.2 |
| D | 12 | 227 | 95932 | 1798.18 | 207 | 201 | 53.2 |
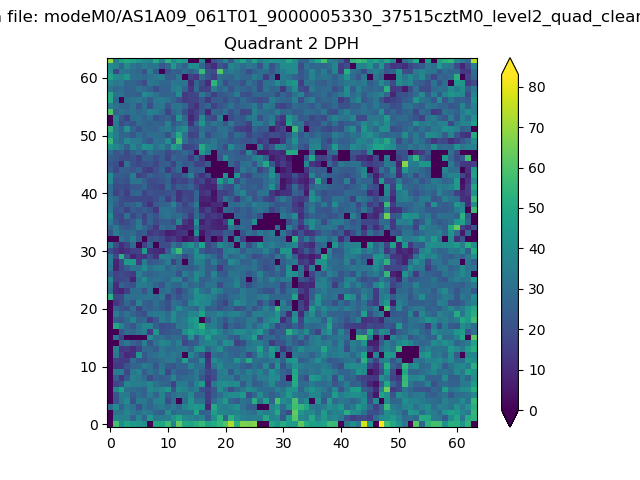
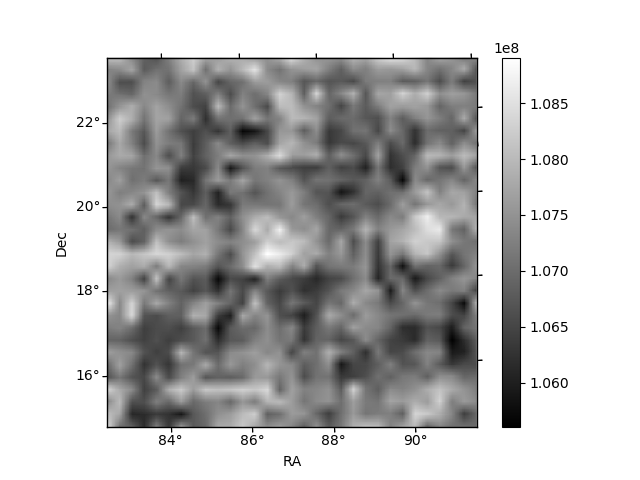
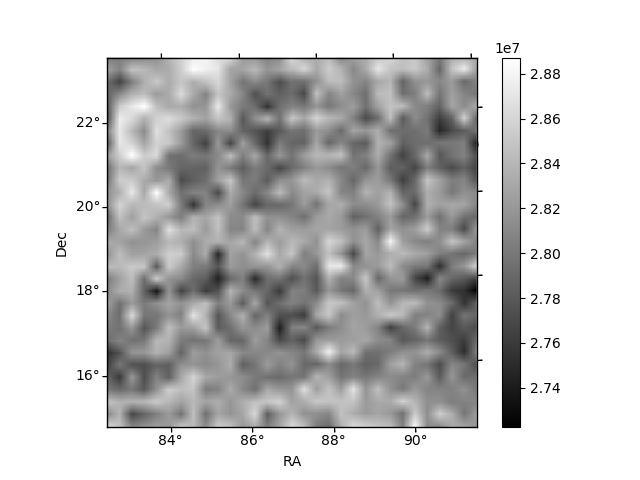
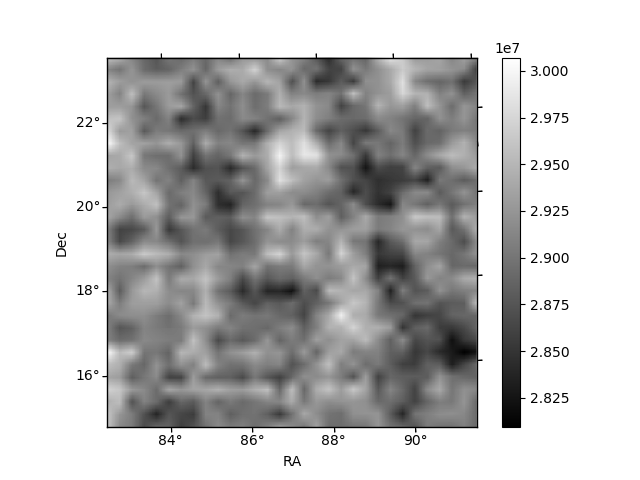
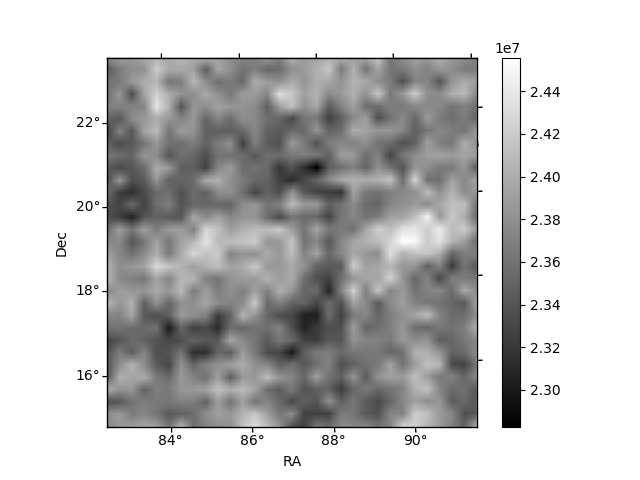
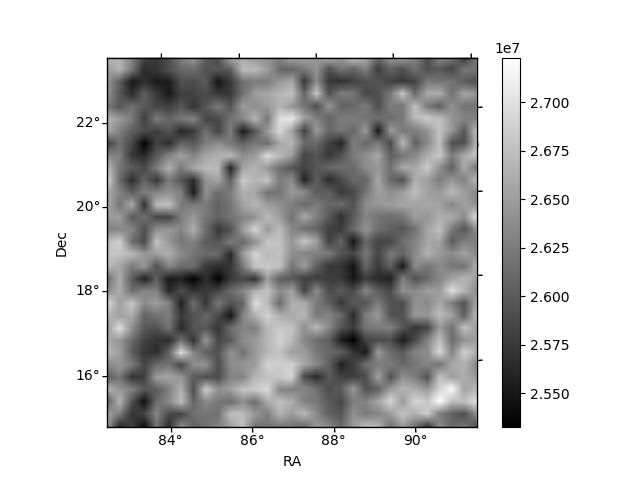
Histogram calculated using DETX and DETY for each event in the final _common_clean file
| Quadrant A | 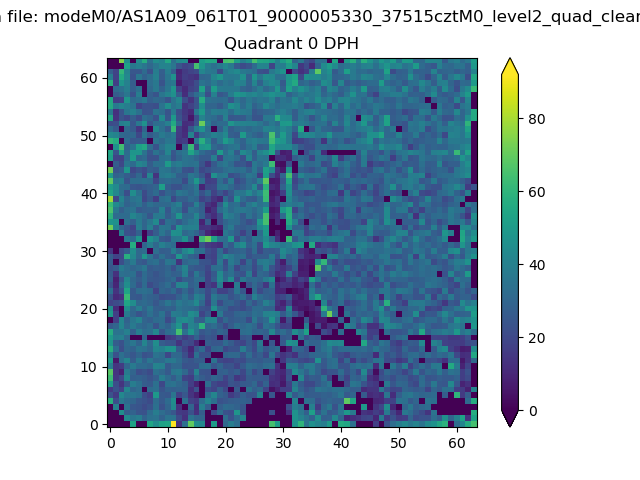 |
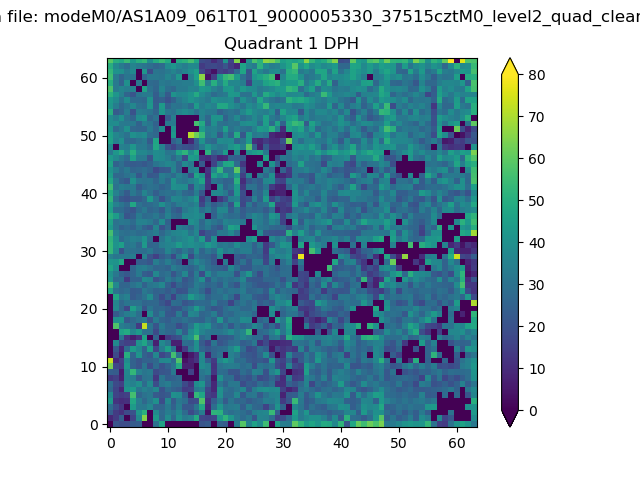 |
Quadrant B |
|---|---|---|---|
| Quadrant D | 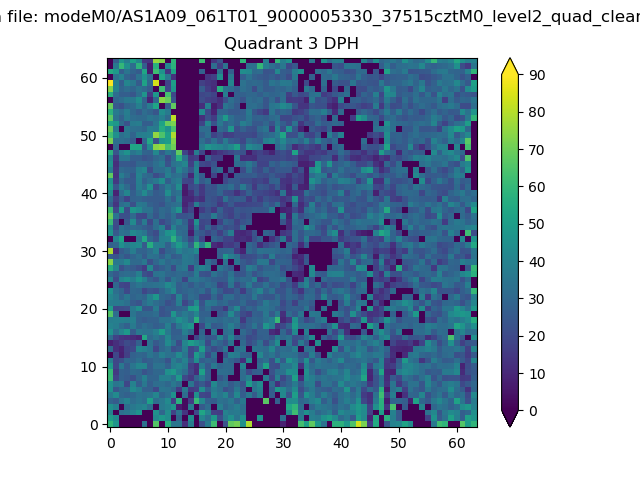 |
 |
Quadrant C |
| Plot type | Count rate plots | Images |
|---|---|---|
| Comparison with Poisson distribution Blue bars denote a histogram of data divided into 1 sec bins. Red curve is a Poisson curve with rate = median count rate of data. |
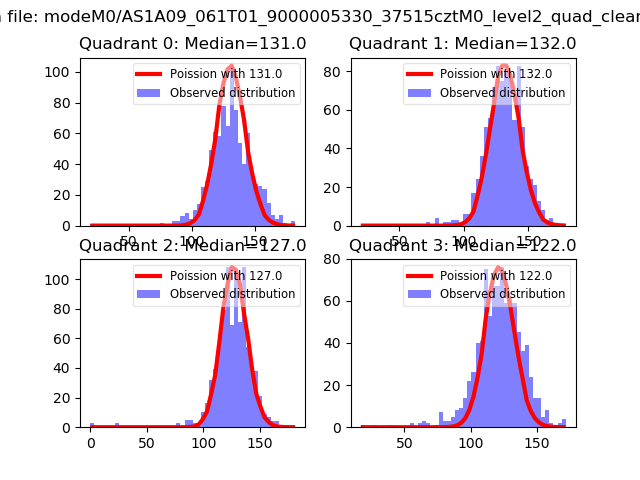 |
 |
| Quadrant-wise count rates Data is divided into 100 sec bins |
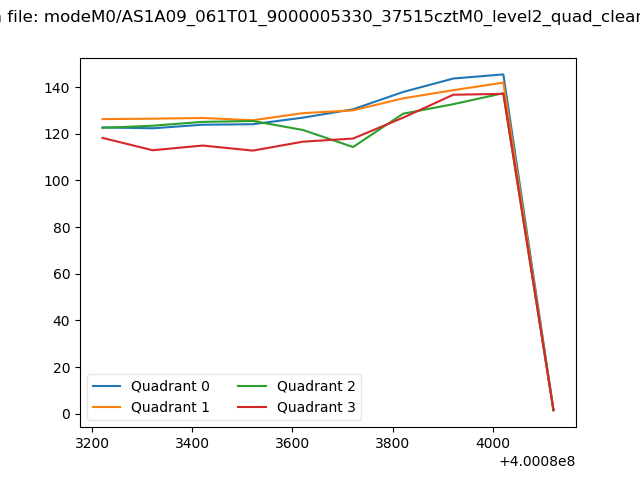 |
|
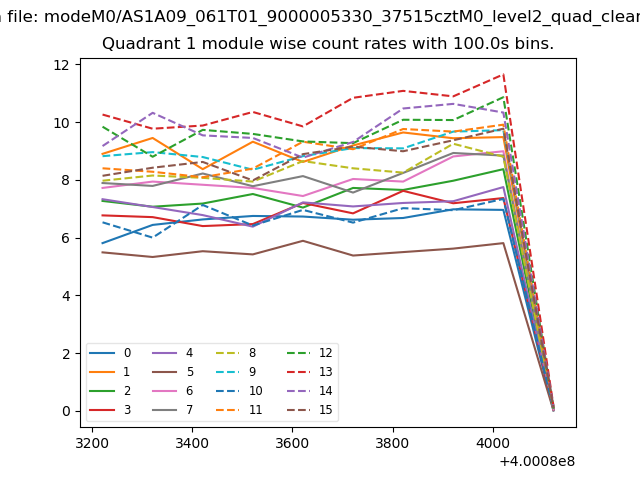
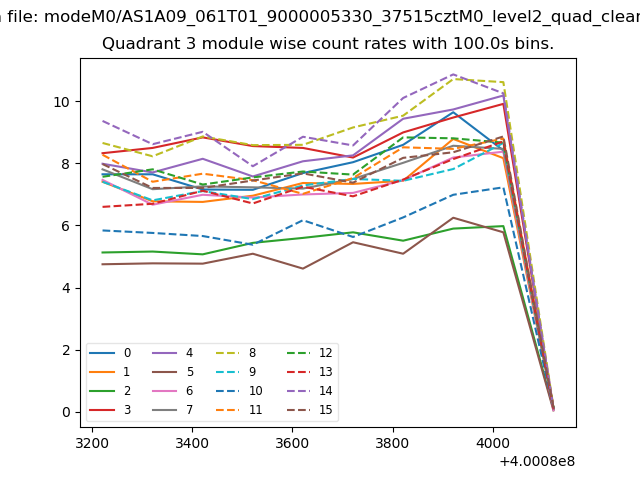
| Module-wise count rates for Quadrant A Data is divided into 100 sec bins |
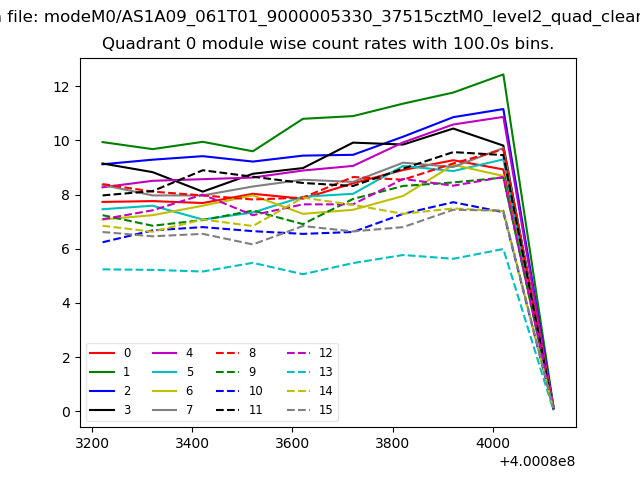 |
 |
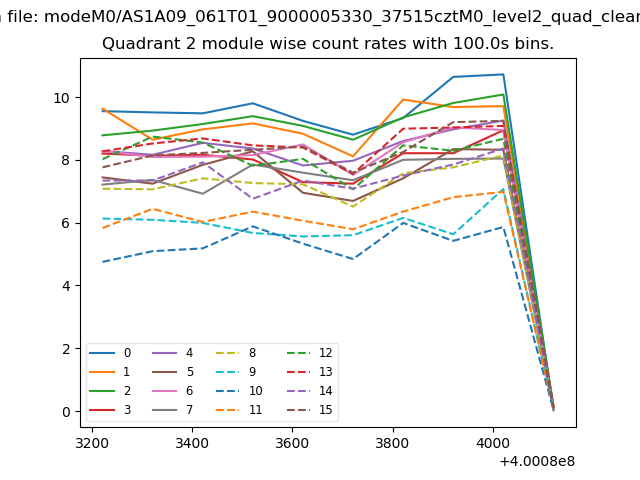
| Module-wise count rates for Quadrant B Data is divided into 100 sec bins |
 |
 |
| Module-wise count rates for Quadrant C Data is divided into 100 sec bins |
 |
 |
| Module-wise count rates for Quadrant D Data is divided into 100 sec bins |
 |
 |
| Parameter | Plot |
|---|---|
| CZT HV Monitor | 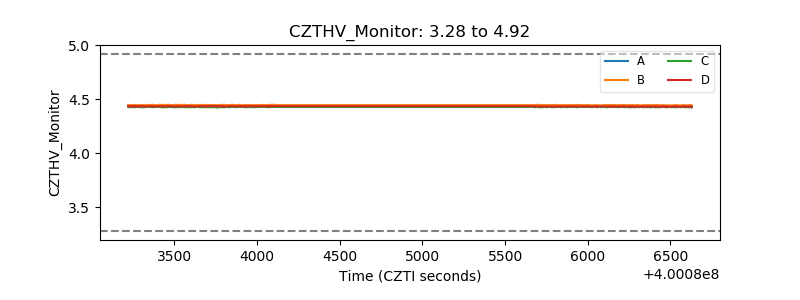 |
| D_VDD | 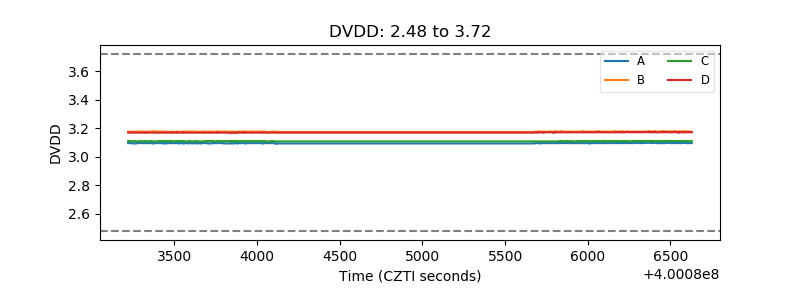 |
| Temperature 1 | 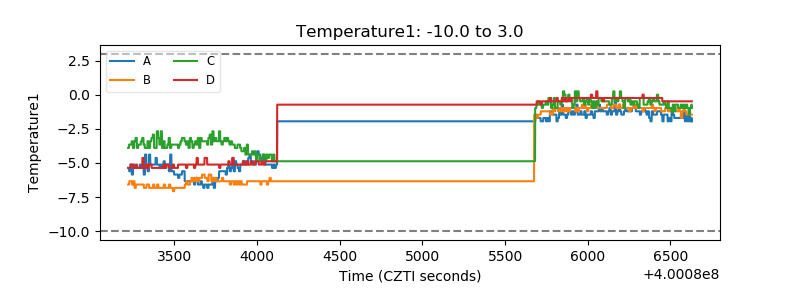 |
| Veto HV Monitor | 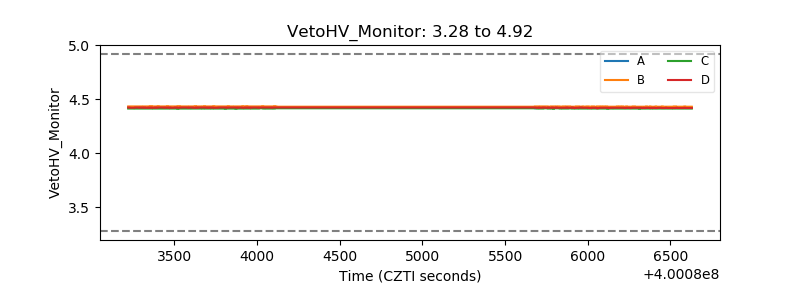 |
| Veto LLD | 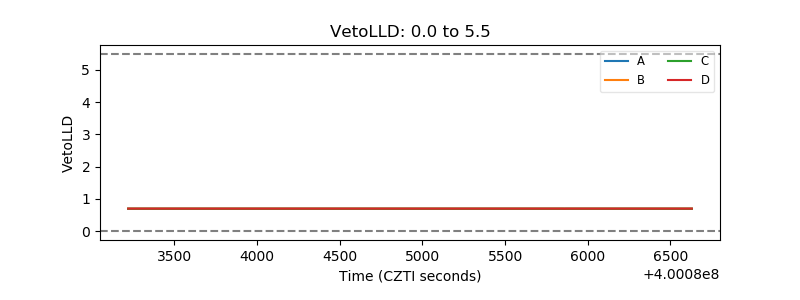 |
| Alpha Counter | 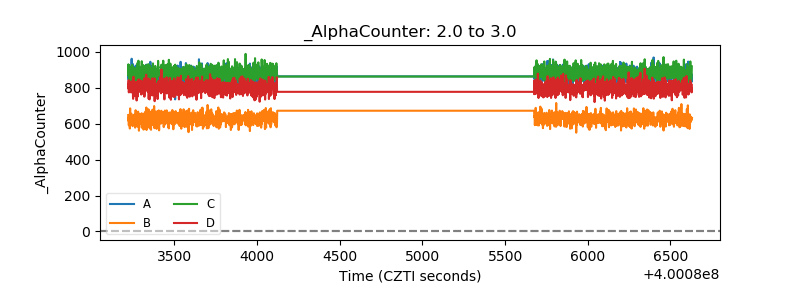 |
| _CPM_Rate | 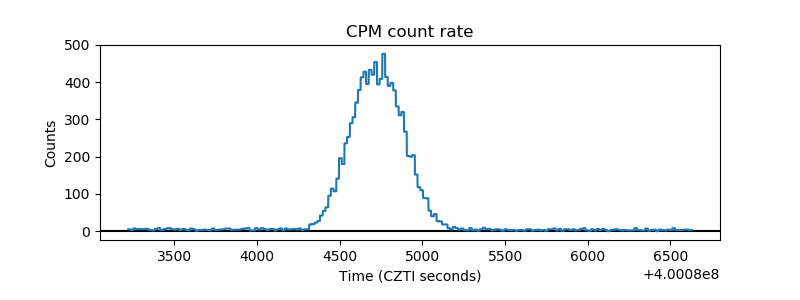 |
| CZT Counter | 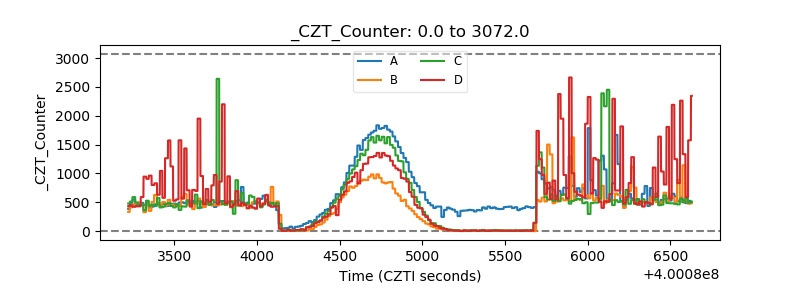 |
| +2.5 Volts monitor | 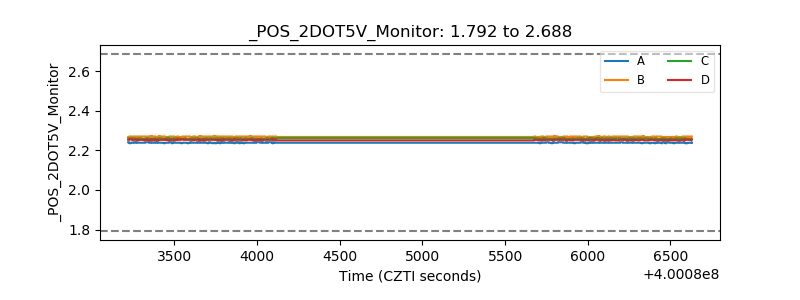 |
| +5 Volts monitor | 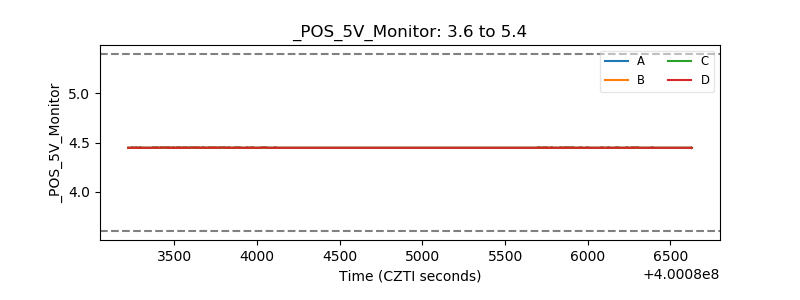 |
| _ROLL_ROT | 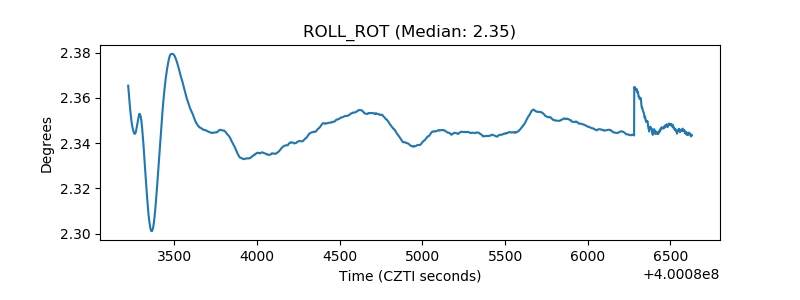 |
| _Roll_DEC | 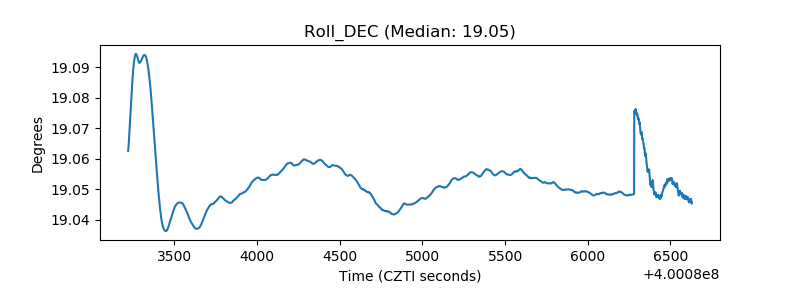 |
| _Roll_RA | 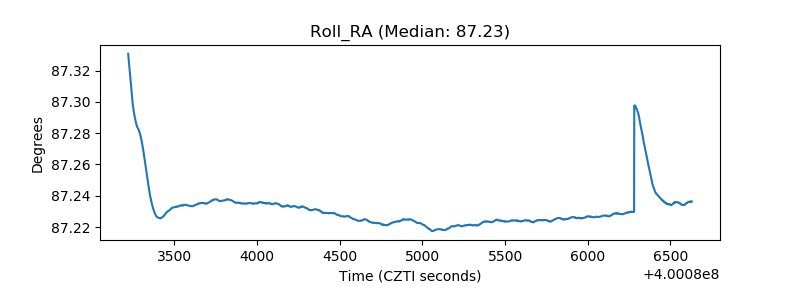 |
| Veto Counter | 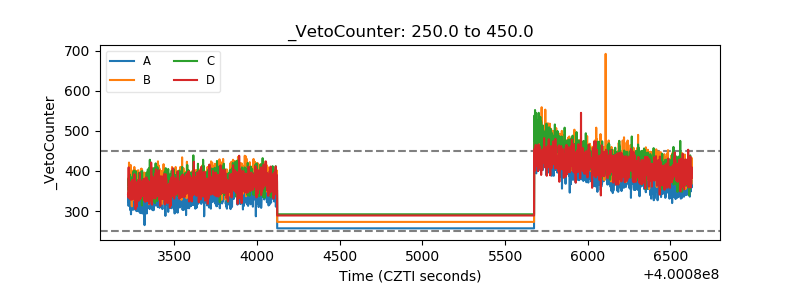 |