| Param | Original file | Final file |
|---|---|---|
| Filename | modeM0/AS1A09_061T01_9000005330_37518cztM0_level2.evt | modeM0/AS1A09_061T01_9000005330_37518cztM0_level2_quad_clean.evt |
| Size (bytes) | 451,958,400 | 61,894,080 |
| Size | 431.0 MB | 59.0 MB |
| Events in quadrant A | 3,044,605 | 379,759 |
| Events in quadrant B | 3,257,318 | 383,960 |
| Events in quadrant C | 2,943,148 | 380,149 |
| Events in quadrant D | 4,081,852 | 358,068 |
| Mode SS | |||
|---|---|---|---|
| Quadrant | BADHDUFLAG | Total packets | Discarded packets |
| A | 0 | 108 | 0 |
| B | 0 | 108 | 0 |
| C | 0 | 108 | 0 |
| D | 0 | 108 | 0 |
| Mode M9 | |||
|---|---|---|---|
| Quadrant | BADHDUFLAG | Total packets | Discarded packets |
| A | 0 | 26 | 0 |
| B | 0 | 26 | 0 |
| C | 0 | 26 | 0 |
| D | 0 | 27 | 0 |
| Mode M0 | |||
|---|---|---|---|
| Quadrant | BADHDUFLAG | Total packets | Discarded packets |
| A | 0 | 12459 | 9 |
| B | 0 | 13233 | 9 |
| C | 0 | 11965 | 5 |
| D | 0 | 15787 | 16 |
| Quadrant | Total seconds | Saturated seconds | Saturation percentage |
|---|---|---|---|
| A | 5315 | 32 | 0.602070% |
| B | 5314 | 101 | 1.900640% |
| C | 5317 | 58 | 1.090841% |
| D | 5313 | 366 | 6.888763% |
Noise dominated data is calculated using 1-second bins in cleaned event files. If a bin has >2000 counts, and if more than 50% of those come from <1% of pixels, then it is considered to be noise-dominated and hence unusable.
| Quadrant | # 1 sec bins | Bins with >0 counts | Bins with >2000 counts | High rate bins dominated by noise | Noise dominated (total time) | Noise dominated (detector-on time) | Marked lightcurve |
|---|---|---|---|---|---|---|---|
| A | 7141 | 5318 | 9 | 9 | 0.13% | 0.17% | 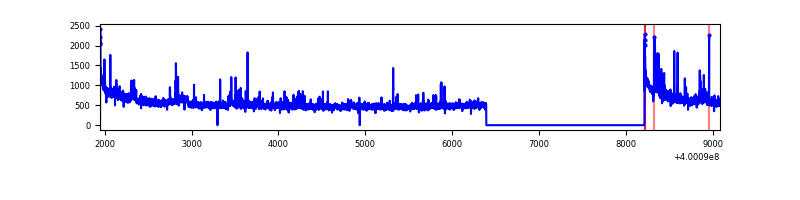 |
| B | 7141 | 5318 | 60 | 60 | 0.84% | 1.13% | 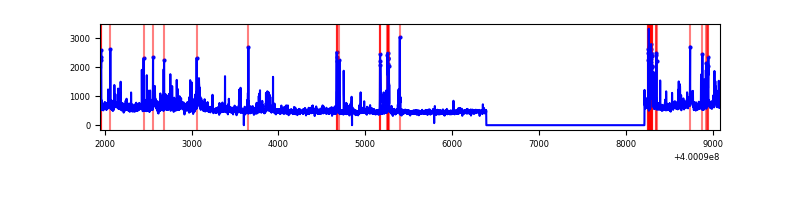 |
| C | 7141 | 5319 | 46 | 46 | 0.64% | 0.86% | 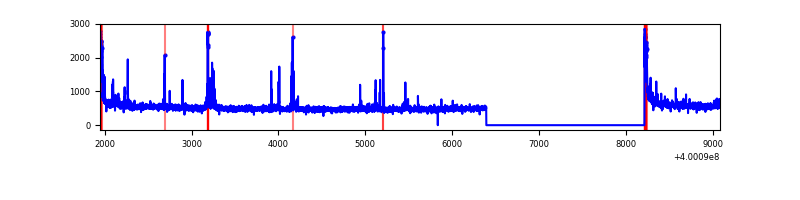 |
| D | 7141 | 5318 | 365 | 365 | 5.11% | 6.86% | 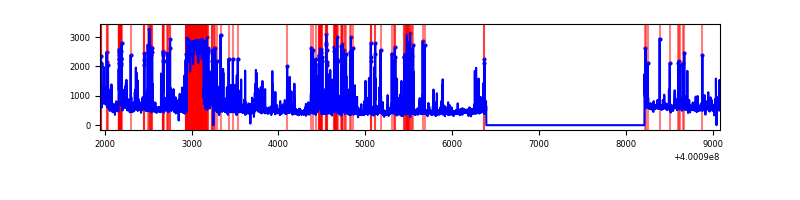 |
Top three noisy pixels from each quadrant. If the there are fewer than three noisy pixels in the level2.evt file, extra rows are filled as -1
| Pixel properties | Quadrant properties | ||||||
|---|---|---|---|---|---|---|---|
| Quadrant | DetID | PixID | Counts | Sigma | Mean | Median | Sigma |
| A | 10 | 83 | 330219 | 2546.75 | 637 | 626 | 129.4 |
| A | 9 | 143 | 89642 | 687.82 | 637 | 626 | 129.4 |
| A | 12 | 189 | 61480 | 470.22 | 637 | 626 | 129.4 |
| B | 0 | 190 | 139020 | 1139.92 | 632 | 617 | 121.4 |
| B | 0 | 197 | 129679 | 1062.98 | 632 | 617 | 121.4 |
| B | 5 | 172 | 117619 | 963.65 | 632 | 617 | 121.4 |
| C | 15 | 214 | 229743 | 1572.82 | 624 | 629 | 145.7 |
| C | 14 | 254 | 133073 | 909.2 | 624 | 629 | 145.7 |
| C | 0 | 10 | 119043 | 812.89 | 624 | 629 | 145.7 |
| D | 13 | 249 | 588806 | 3973.64 | 601 | 584 | 148.0 |
| D | 2 | 249 | 512546 | 3458.48 | 601 | 584 | 148.0 |
| D | 2 | 153 | 215865 | 1454.3 | 601 | 584 | 148.0 |
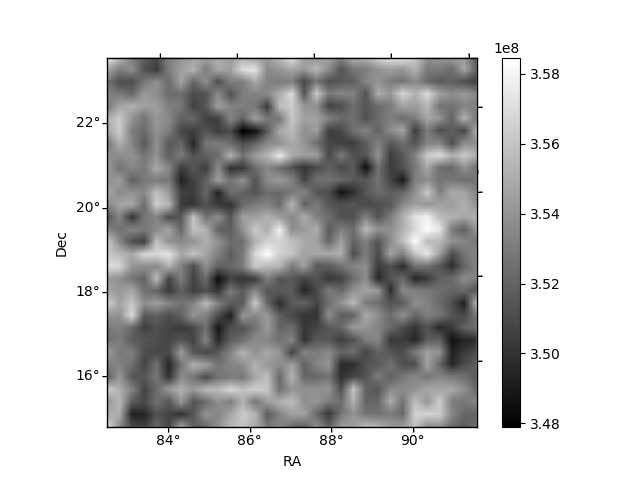
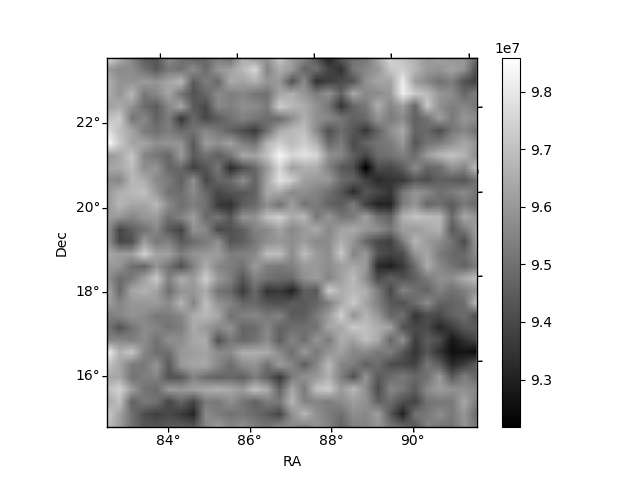
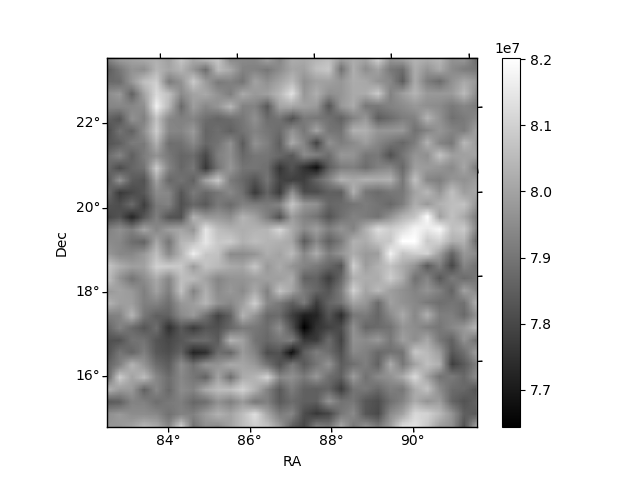
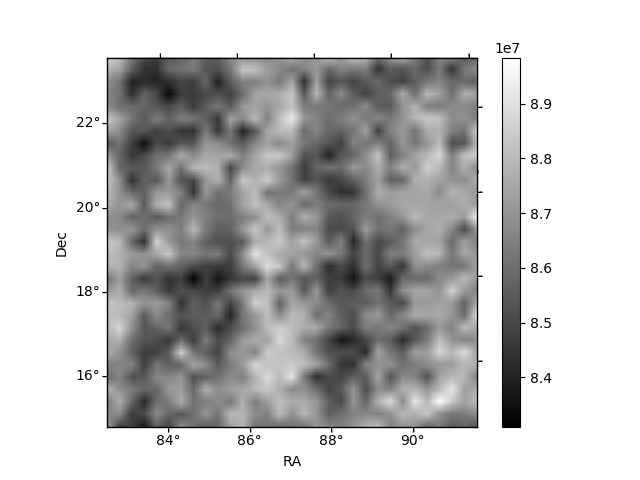
Histogram calculated using DETX and DETY for each event in the final _common_clean file
| Quadrant A | 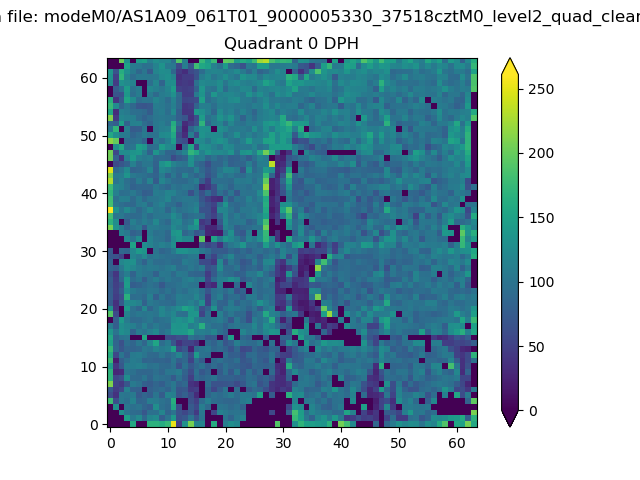 |
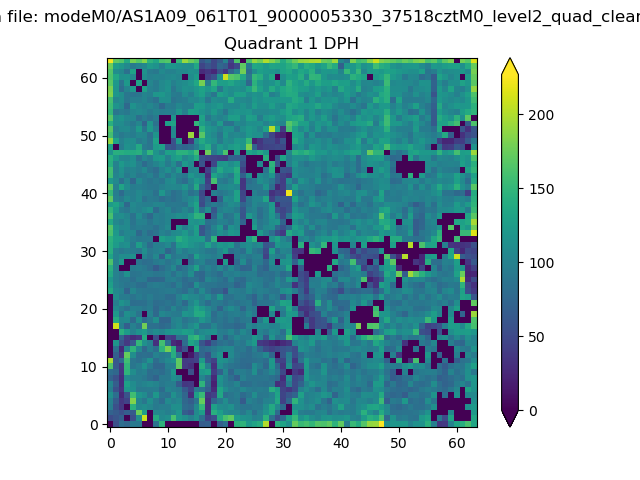 |
Quadrant B |
|---|---|---|---|
| Quadrant D | 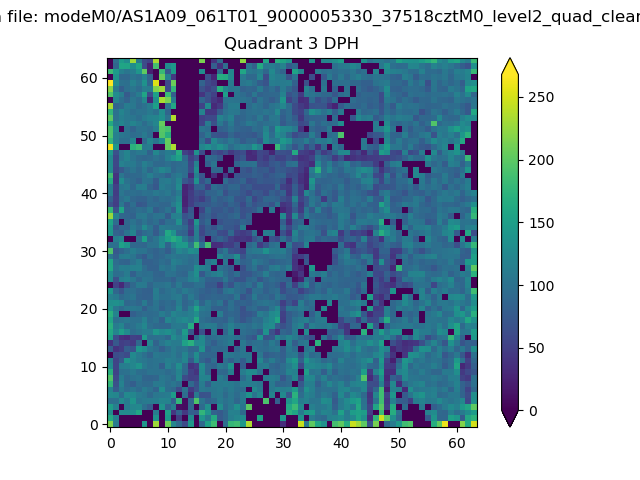 |
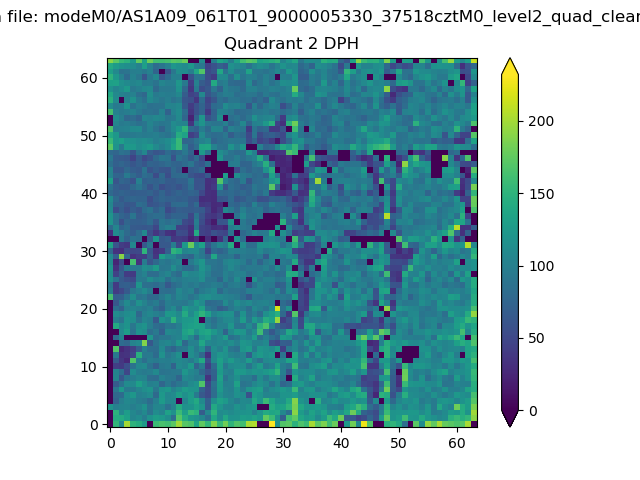 |
Quadrant C |
| Plot type | Count rate plots | Images |
|---|---|---|
| Comparison with Poisson distribution Blue bars denote a histogram of data divided into 1 sec bins. Red curve is a Poisson curve with rate = median count rate of data. |
 |
 |
| Quadrant-wise count rates Data is divided into 100 sec bins |
 |
|
| Module-wise count rates for Quadrant A Data is divided into 100 sec bins |
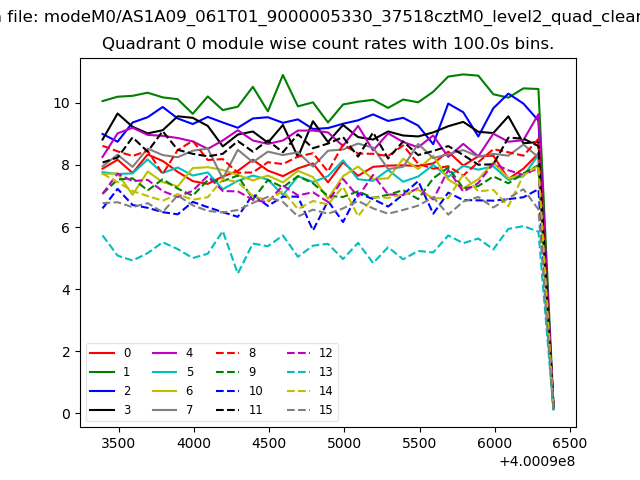 |
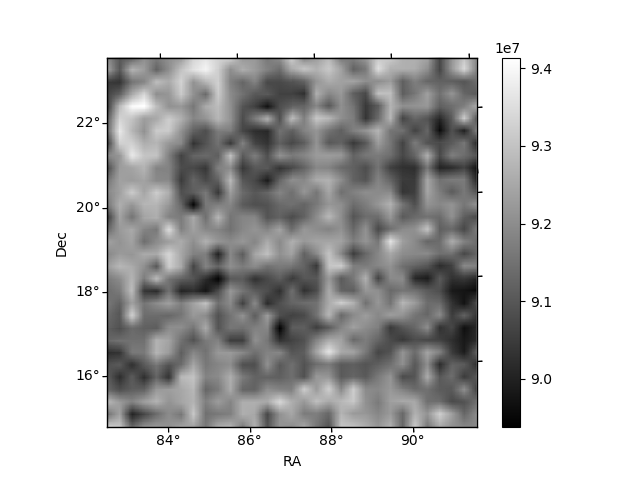 |
| Module-wise count rates for Quadrant B Data is divided into 100 sec bins |
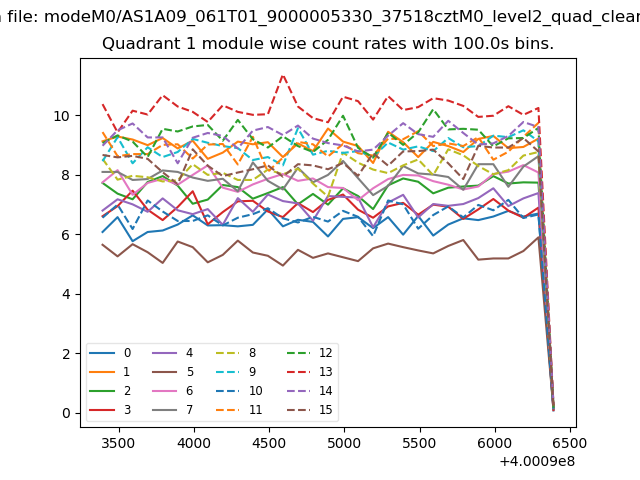 |
 |
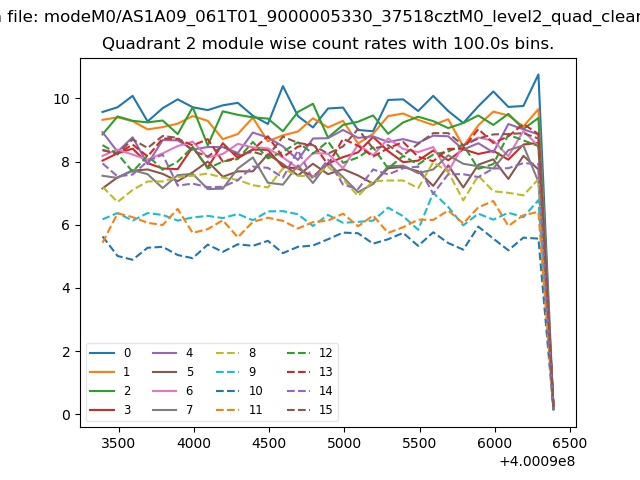
| Module-wise count rates for Quadrant C Data is divided into 100 sec bins |
 |
 |
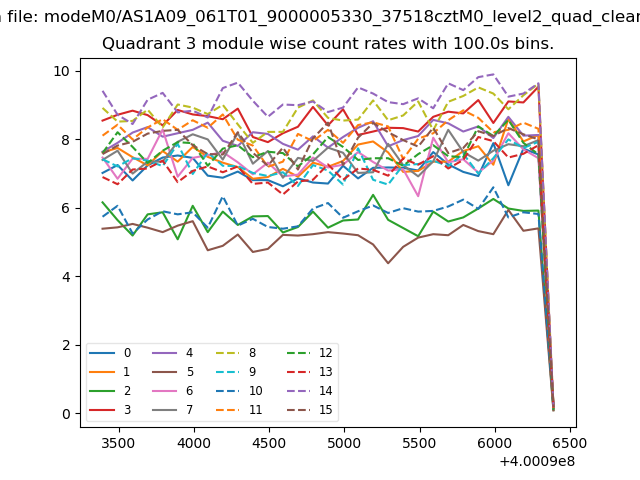
| Module-wise count rates for Quadrant D Data is divided into 100 sec bins |
 |
 |
| Parameter | Plot |
|---|---|
| CZT HV Monitor | 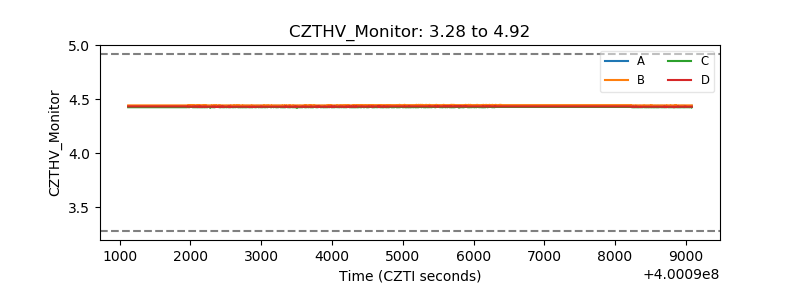 |
| D_VDD | 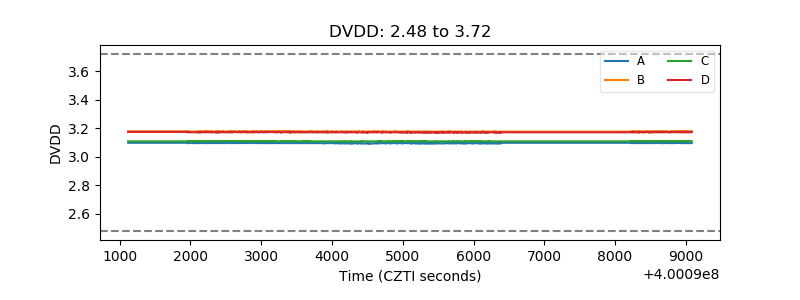 |
| Temperature 1 | 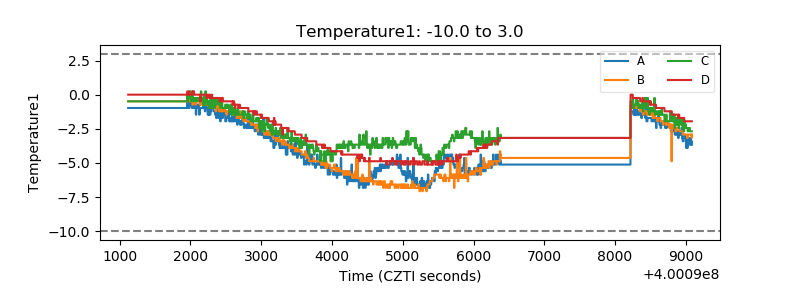 |
| Veto HV Monitor | 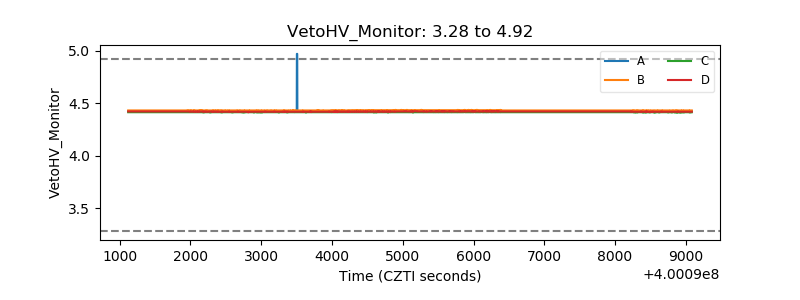 |
| Veto LLD | 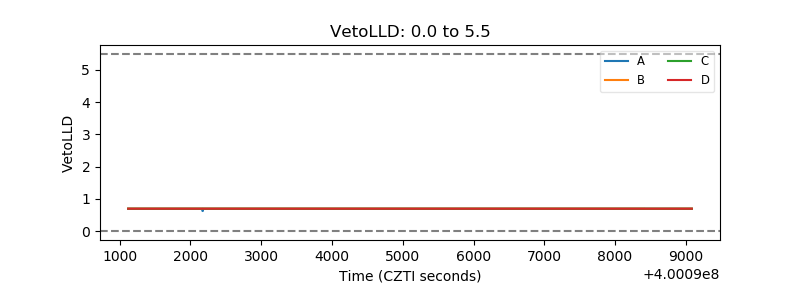 |
| Alpha Counter | 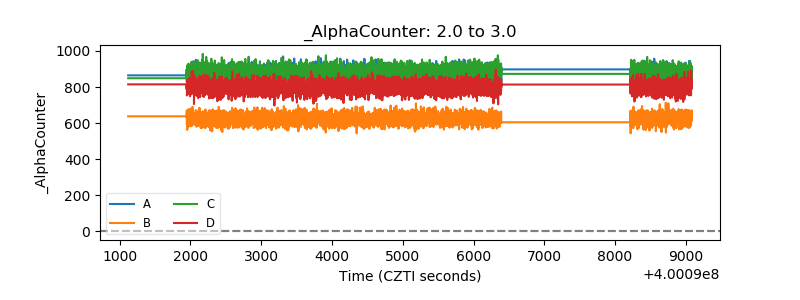 |
| _CPM_Rate |  |
| CZT Counter | 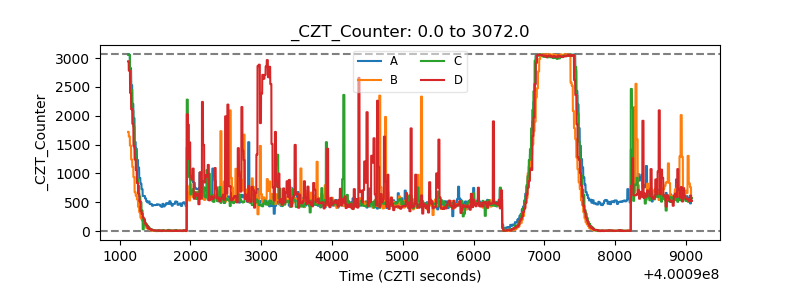 |
| +2.5 Volts monitor | 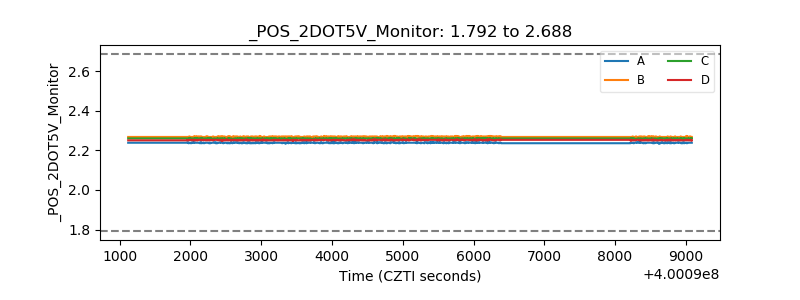 |
| +5 Volts monitor | 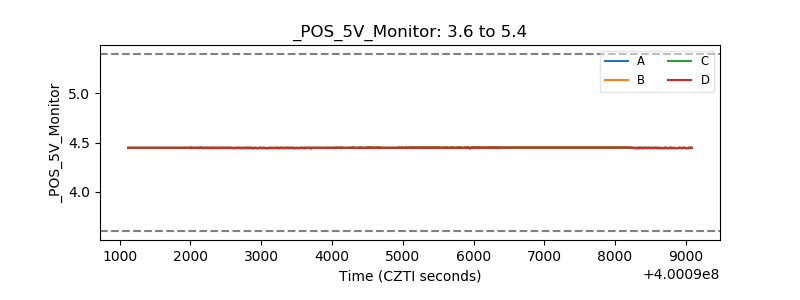 |
| _ROLL_ROT | 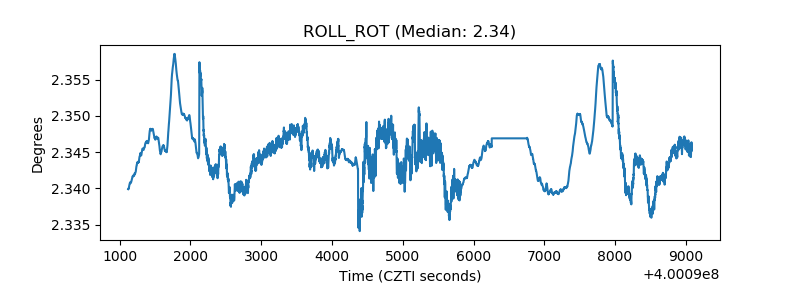 |
| _Roll_DEC | 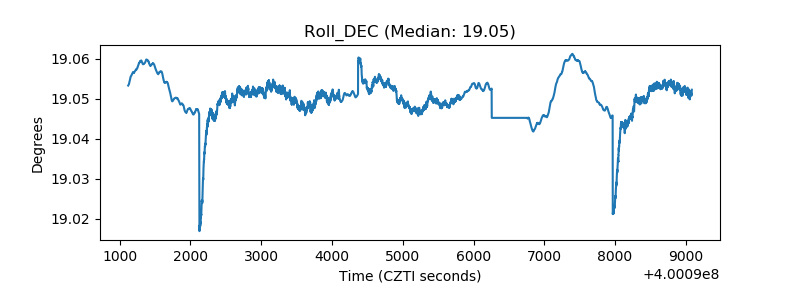 |
| _Roll_RA | 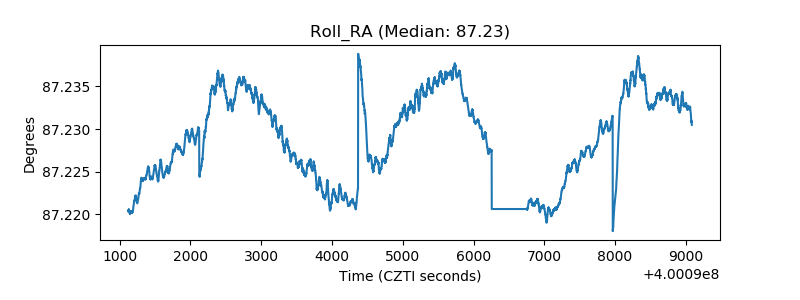 |
| Veto Counter | 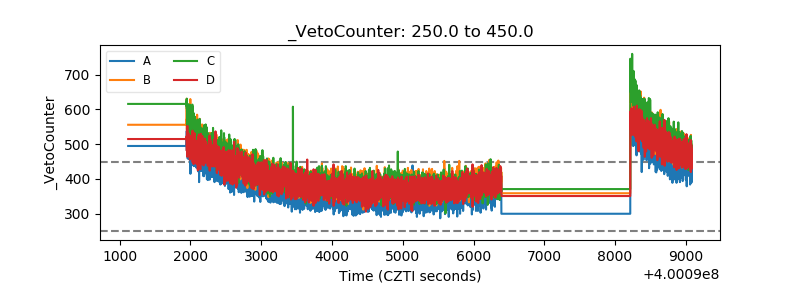 |