| Param | Original file | Final file |
|---|---|---|
| Filename | modeM0/AS1A09_061T01_9000005330_37519cztM0_level2.evt | modeM0/AS1A09_061T01_9000005330_37519cztM0_level2_quad_clean.evt |
| Size (bytes) | 467,164,800 | 72,103,680 |
| Size | 445.5 MB | 68.8 MB |
| Events in quadrant A | 2,888,612 | 468,547 |
| Events in quadrant B | 4,166,298 | 448,384 |
| Events in quadrant C | 3,041,834 | 470,313 |
| Events in quadrant D | 3,704,257 | 437,231 |
| Mode SS | |||
|---|---|---|---|
| Quadrant | BADHDUFLAG | Total packets | Discarded packets |
| A | 0 | 106 | 0 |
| B | 0 | 106 | 0 |
| C | 0 | 106 | 0 |
| D | 0 | 106 | 0 |
| Mode M9 | |||
|---|---|---|---|
| Quadrant | BADHDUFLAG | Total packets | Discarded packets |
| A | 0 | 32 | 0 |
| B | 0 | 32 | 0 |
| C | 0 | 32 | 0 |
| D | 0 | 33 | 0 |
| Mode M0 | |||
|---|---|---|---|
| Quadrant | BADHDUFLAG | Total packets | Discarded packets |
| A | 0 | 11865 | 3 |
| B | 0 | 15809 | 2 |
| C | 0 | 12134 | 2 |
| D | 0 | 14569 | 2 |
| Quadrant | Total seconds | Saturated seconds | Saturation percentage |
|---|---|---|---|
| A | 5112 | 27 | 0.528169% |
| B | 5112 | 537 | 10.504695% |
| C | 5112 | 78 | 1.525822% |
| D | 5112 | 235 | 4.597027% |
Noise dominated data is calculated using 1-second bins in cleaned event files. If a bin has >2000 counts, and if more than 50% of those come from <1% of pixels, then it is considered to be noise-dominated and hence unusable.
| Quadrant | # 1 sec bins | Bins with >0 counts | Bins with >2000 counts | High rate bins dominated by noise | Noise dominated (total time) | Noise dominated (detector-on time) | Marked lightcurve |
|---|---|---|---|---|---|---|---|
| A | 7054 | 5113 | 8 | 8 | 0.11% | 0.16% | 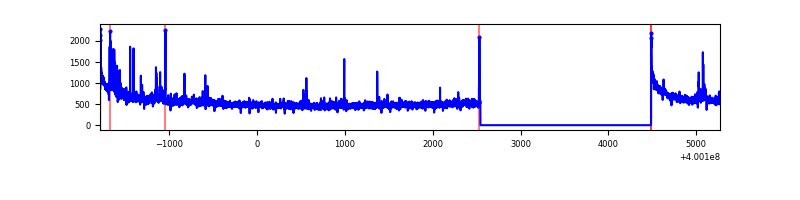 |
| B | 7054 | 5113 | 460 | 460 | 6.52% | 9.00% | 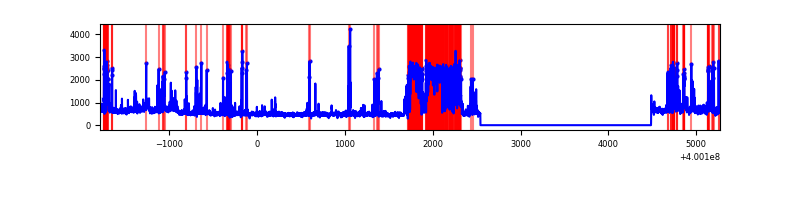 |
| C | 7054 | 5113 | 64 | 64 | 0.91% | 1.25% | 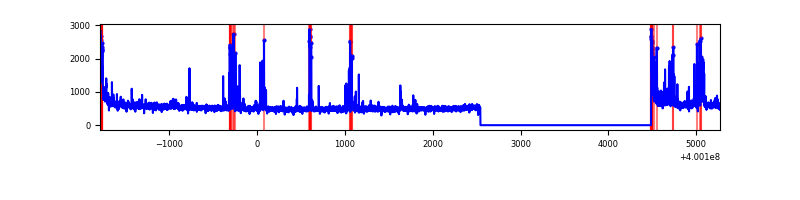 |
| D | 7054 | 5113 | 210 | 210 | 2.98% | 4.11% | 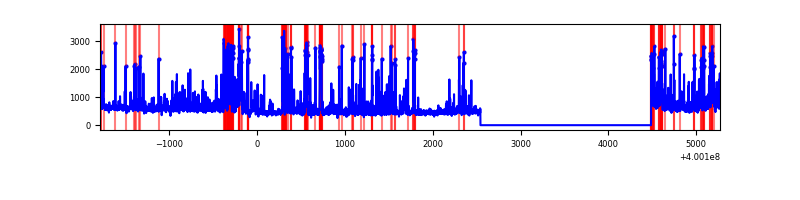 |
Top three noisy pixels from each quadrant. If the there are fewer than three noisy pixels in the level2.evt file, extra rows are filled as -1
| Pixel properties | Quadrant properties | ||||||
|---|---|---|---|---|---|---|---|
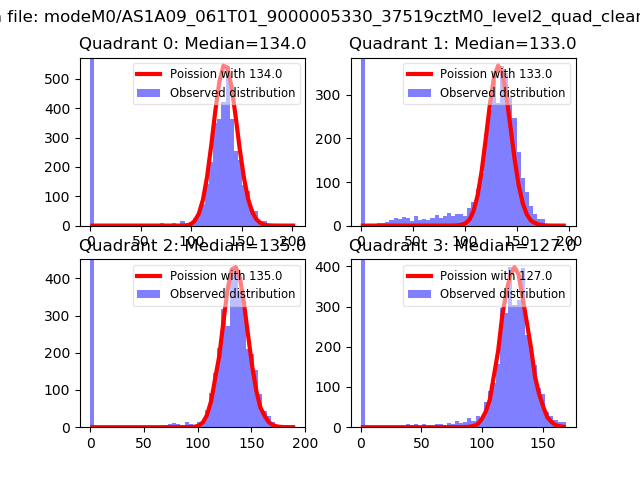
| Quadrant | DetID | PixID | Counts | Sigma | Mean | Median | Sigma |
| A | 10 | 83 | 313460 | 2422.71 | 628 | 618 | 129.1 |
| A | 9 | 143 | 102964 | 792.59 | 628 | 618 | 129.1 |
| A | 6 | 10 | 14973 | 111.17 | 628 | 618 | 129.1 |
| B | 5 | 172 | 1295101 | 11306.81 | 604 | 591 | 114.5 |
| B | 0 | 190 | 126318 | 1098.15 | 604 | 591 | 114.5 |
| B | 5 | 184 | 92013 | 798.52 | 604 | 591 | 114.5 |
| C | 15 | 214 | 219807 | 1507.78 | 620 | 625 | 145.4 |
| C | 14 | 254 | 214585 | 1471.85 | 620 | 625 | 145.4 |
| C | 0 | 10 | 112762 | 771.4 | 620 | 625 | 145.4 |
| D | 2 | 249 | 578931 | 3881.7 | 607 | 591 | 149.0 |
| D | 13 | 249 | 228231 | 1527.87 | 607 | 591 | 149.0 |
| D | 12 | 235 | 159061 | 1063.62 | 607 | 591 | 149.0 |
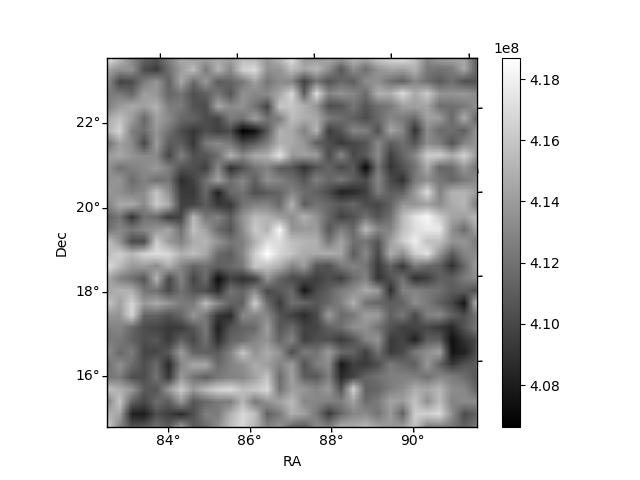
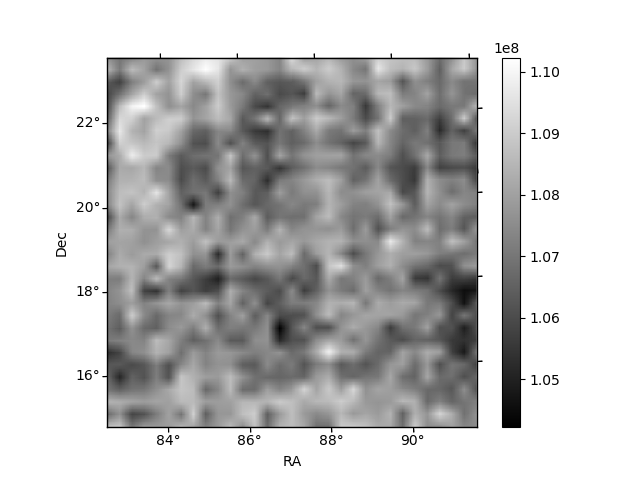
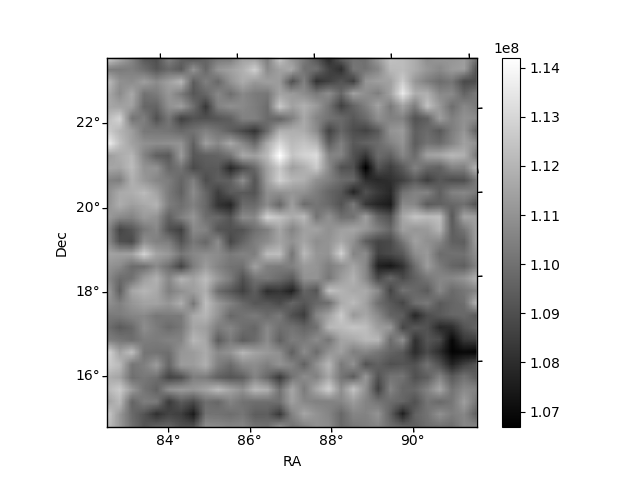
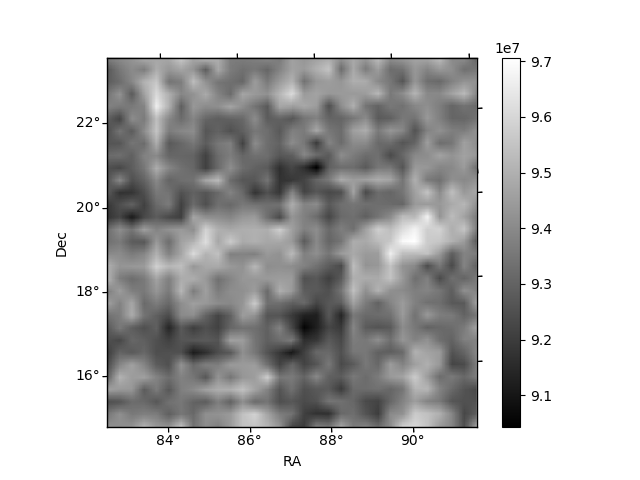
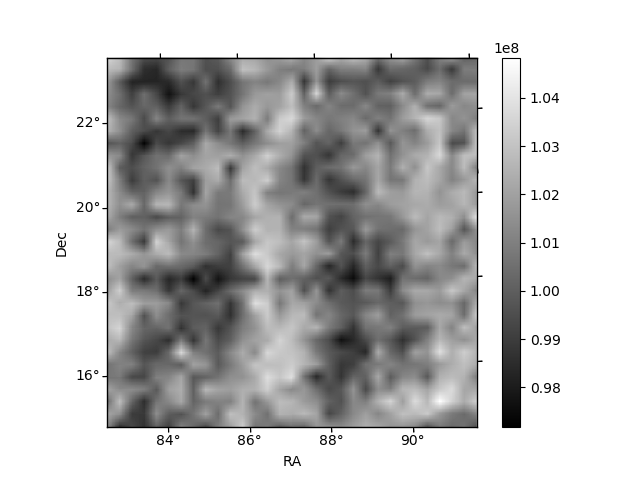
Histogram calculated using DETX and DETY for each event in the final _common_clean file
| Quadrant A | 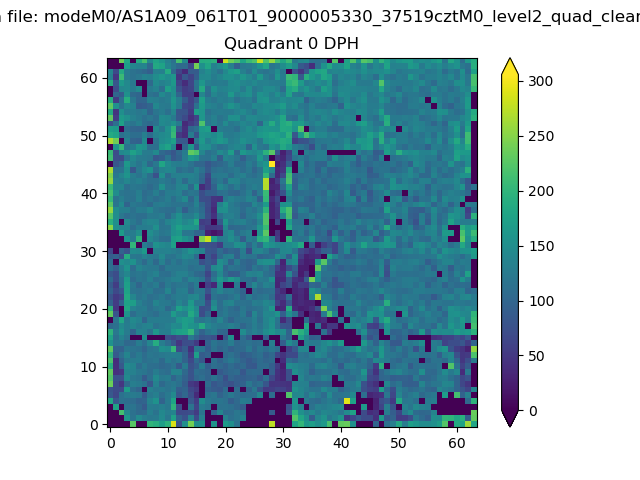 |
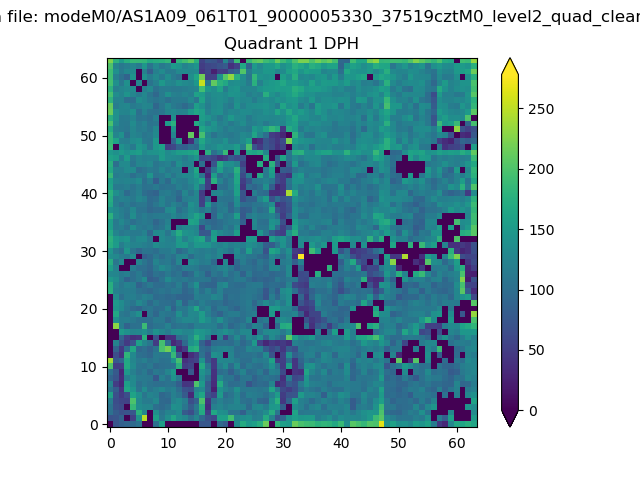 |
Quadrant B |
|---|---|---|---|
| Quadrant D | 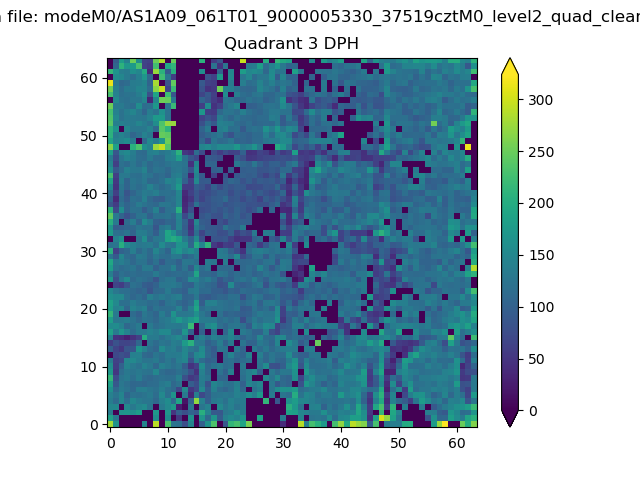 |
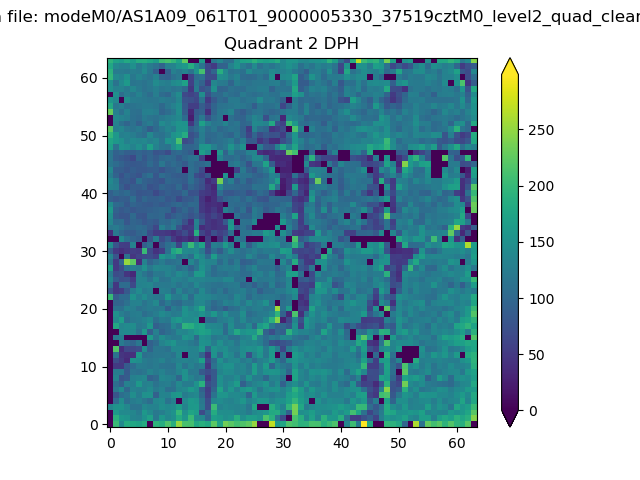 |
Quadrant C |
| Plot type | Count rate plots | Images |
|---|---|---|
| Comparison with Poisson distribution Blue bars denote a histogram of data divided into 1 sec bins. Red curve is a Poisson curve with rate = median count rate of data. |
 |
 |
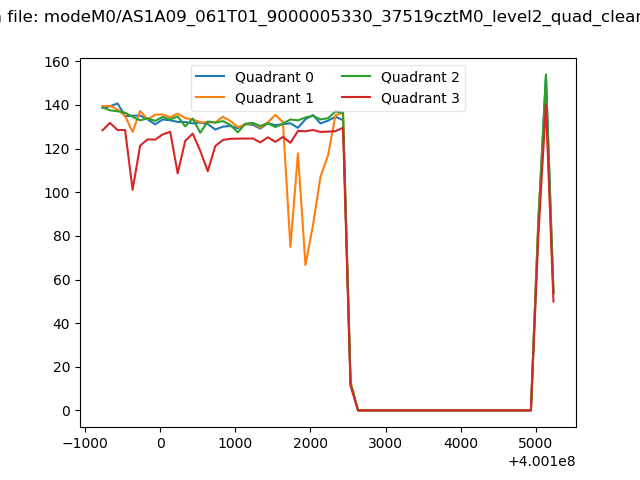
| Quadrant-wise count rates Data is divided into 100 sec bins |
 |
|
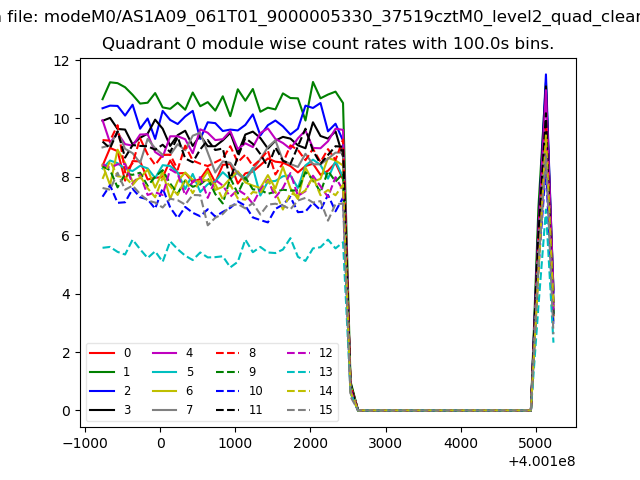
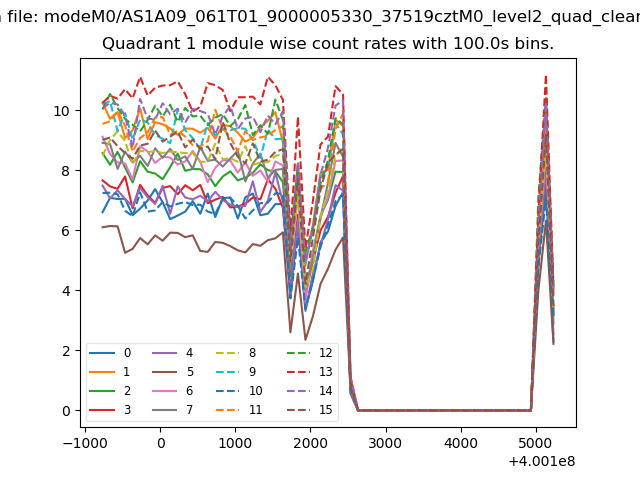
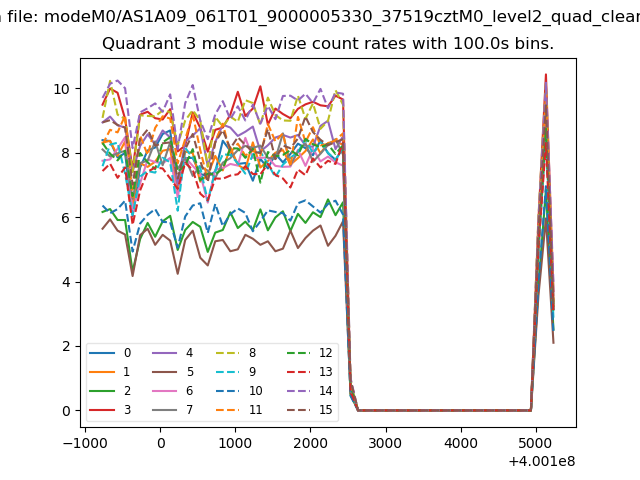
| Module-wise count rates for Quadrant A Data is divided into 100 sec bins |
 |
 |
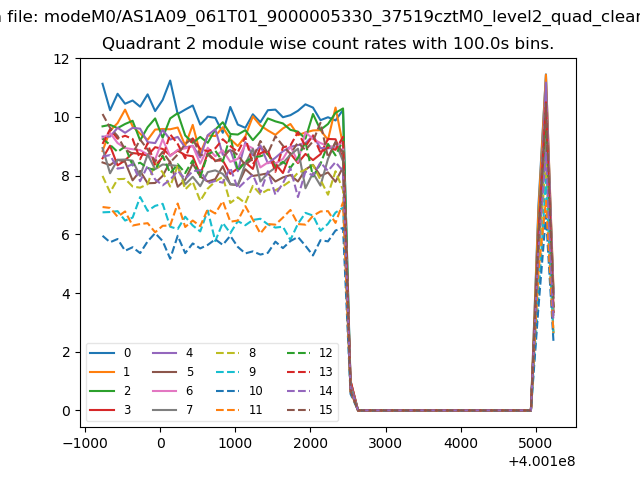
| Module-wise count rates for Quadrant B Data is divided into 100 sec bins |
 |
 |
| Module-wise count rates for Quadrant C Data is divided into 100 sec bins |
 |
 |
| Module-wise count rates for Quadrant D Data is divided into 100 sec bins |
 |
 |
| Parameter | Plot |
|---|---|
| CZT HV Monitor | 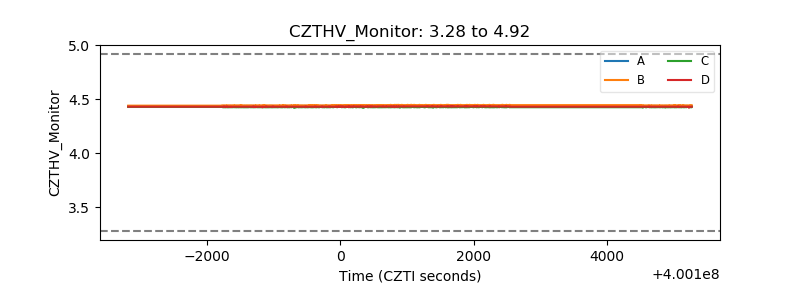 |
| D_VDD | 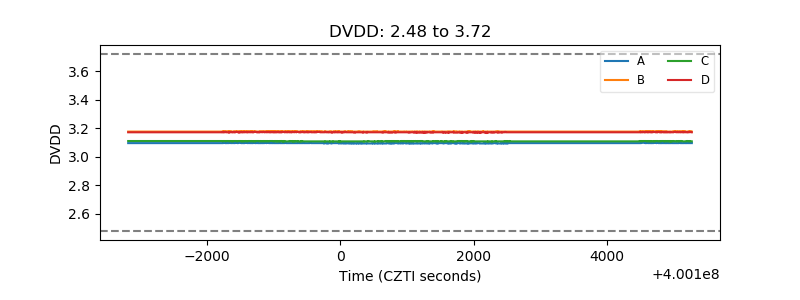 |
| Temperature 1 | 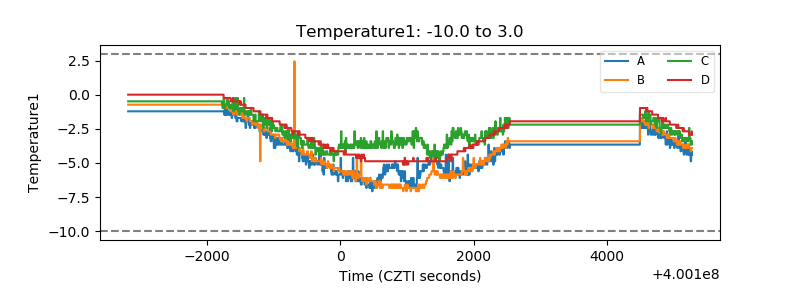 |
| Veto HV Monitor |  |
| Veto LLD | 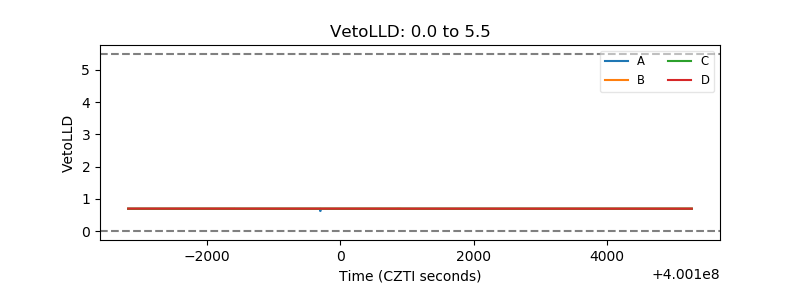 |
| Alpha Counter | 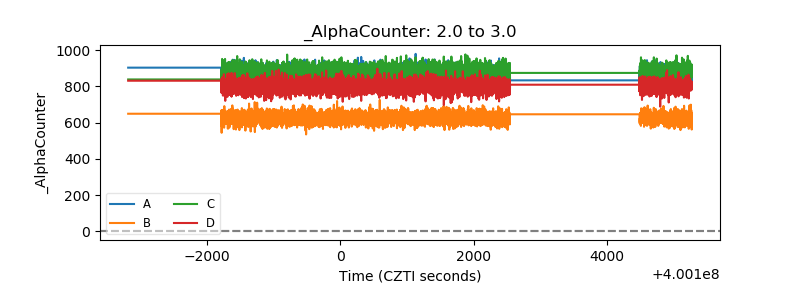 |
| _CPM_Rate | 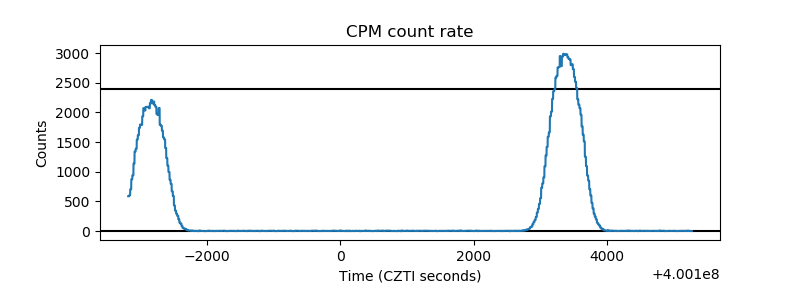 |
| CZT Counter | 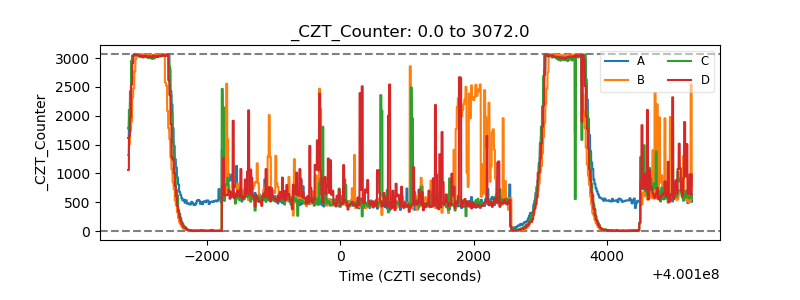 |
| +2.5 Volts monitor | 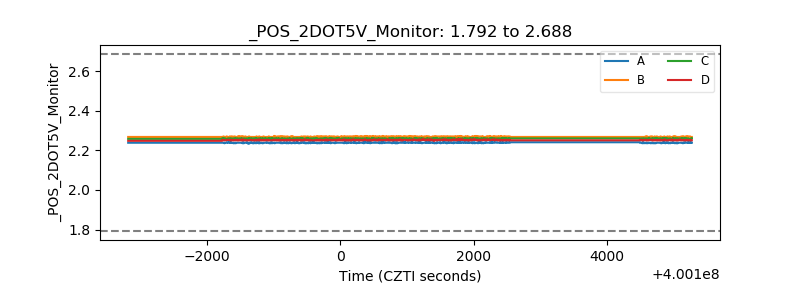 |
| +5 Volts monitor | 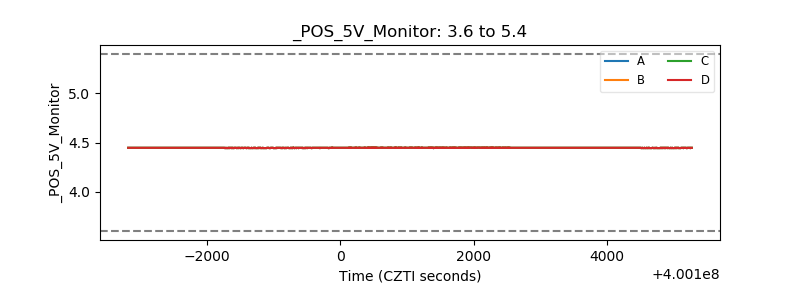 |
| _ROLL_ROT | 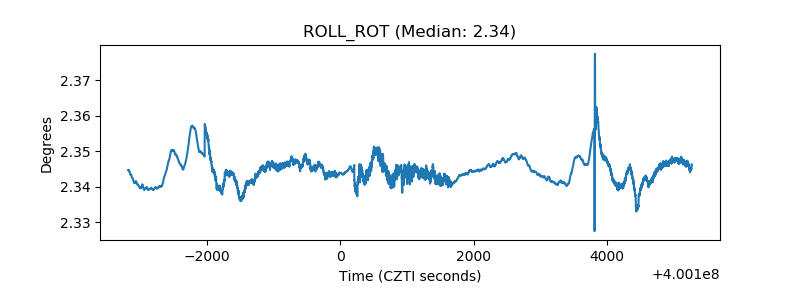 |
| _Roll_DEC | 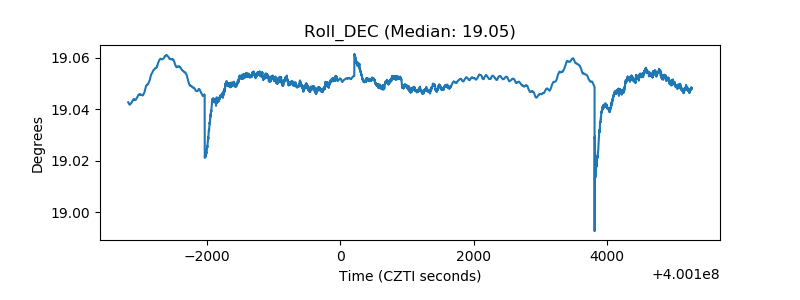 |
| _Roll_RA |  |
| Veto Counter | 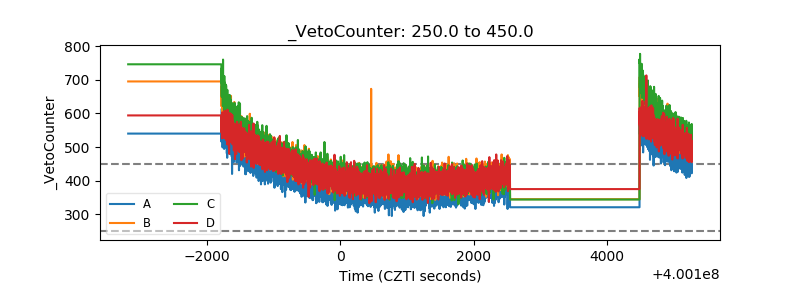 |