| Param | Original file | Final file |
|---|---|---|
| Filename | modeM0/AS1A09_061T01_9000005330_37520cztM0_level2.evt | modeM0/AS1A09_061T01_9000005330_37520cztM0_level2_quad_clean.evt |
| Size (bytes) | 475,251,840 | 86,241,600 |
| Size | 453.2 MB | 82.2 MB |
| Events in quadrant A | 2,917,141 | 577,685 |
| Events in quadrant B | 3,365,263 | 583,057 |
| Events in quadrant C | 3,147,361 | 583,995 |
| Events in quadrant D | 4,628,876 | 520,989 |
| Mode SS | |||
|---|---|---|---|
| Quadrant | BADHDUFLAG | Total packets | Discarded packets |
| A | 0 | 100 | 0 |
| B | 0 | 100 | 0 |
| C | 0 | 100 | 0 |
| D | 0 | 100 | 0 |
| Mode M9 | |||
|---|---|---|---|
| Quadrant | BADHDUFLAG | Total packets | Discarded packets |
| A | 0 | 24 | 0 |
| B | 0 | 24 | 0 |
| C | 0 | 24 | 0 |
| D | 0 | 25 | 0 |
| Mode M0 | |||
|---|---|---|---|
| Quadrant | BADHDUFLAG | Total packets | Discarded packets |
| A | 0 | 11771 | 3 |
| B | 0 | 13218 | 2 |
| C | 0 | 12399 | 6 |
| D | 0 | 17100 | 3 |
| Quadrant | Total seconds | Saturated seconds | Saturation percentage |
|---|---|---|---|
| A | 4934 | 28 | 0.567491% |
| B | 4934 | 263 | 5.330361% |
| C | 4932 | 95 | 1.926196% |
| D | 4933 | 632 | 12.811676% |
Noise dominated data is calculated using 1-second bins in cleaned event files. If a bin has >2000 counts, and if more than 50% of those come from <1% of pixels, then it is considered to be noise-dominated and hence unusable.
| Quadrant | # 1 sec bins | Bins with >0 counts | Bins with >2000 counts | High rate bins dominated by noise | Noise dominated (total time) | Noise dominated (detector-on time) | Marked lightcurve |
|---|---|---|---|---|---|---|---|
| A | 6996 | 4935 | 27 | 27 | 0.39% | 0.55% | 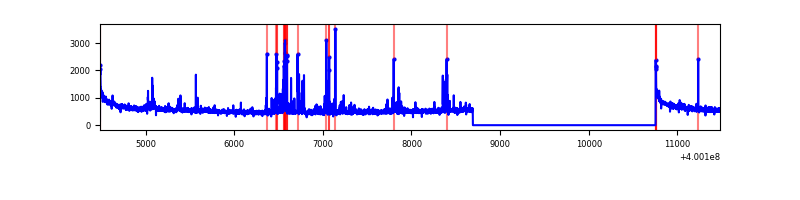 |
| B | 6996 | 4934 | 206 | 206 | 2.94% | 4.18% | 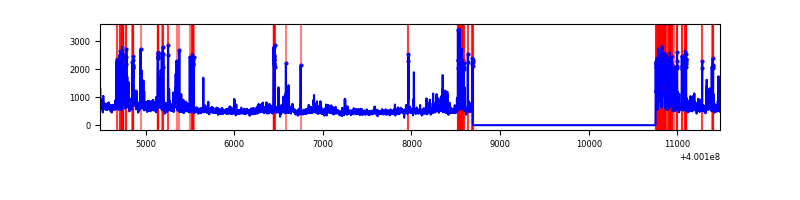 |
| C | 6996 | 4934 | 77 | 77 | 1.10% | 1.56% | 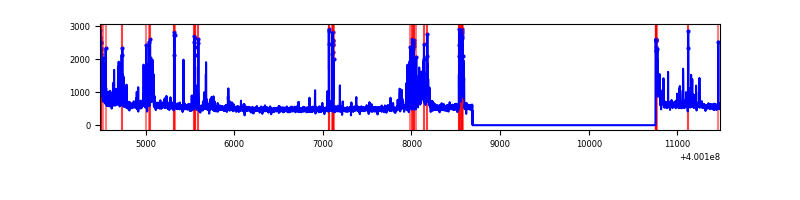 |
| D | 6996 | 4935 | 628 | 628 | 8.98% | 12.73% | 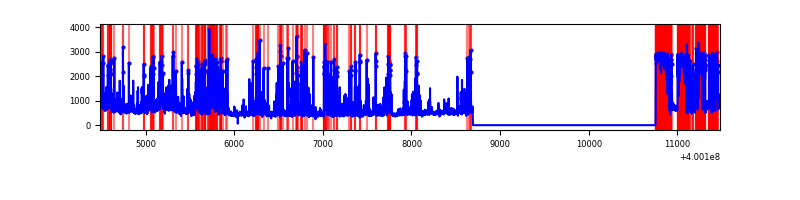 |
Top three noisy pixels from each quadrant. If the there are fewer than three noisy pixels in the level2.evt file, extra rows are filled as -1
| Pixel properties | Quadrant properties | ||||||
|---|---|---|---|---|---|---|---|
| Quadrant | DetID | PixID | Counts | Sigma | Mean | Median | Sigma |
| A | 10 | 83 | 296760 | 2376.51 | 610 | 599 | 124.6 |
| A | 13 | 248 | 166702 | 1332.87 | 610 | 599 | 124.6 |
| A | 6 | 10 | 39142 | 309.28 | 610 | 599 | 124.6 |
| B | 5 | 172 | 644099 | 5678.42 | 600 | 586 | 113.3 |
| B | 0 | 213 | 81716 | 715.9 | 600 | 586 | 113.3 |
| B | 0 | 229 | 52983 | 462.36 | 600 | 586 | 113.3 |
| C | 14 | 254 | 391906 | 2780.87 | 604 | 609 | 140.7 |
| C | 15 | 214 | 212156 | 1503.42 | 604 | 609 | 140.7 |
| C | 0 | 10 | 94258 | 665.55 | 604 | 609 | 140.7 |
| D | 12 | 227 | 1186040 | 8547.79 | 562 | 547 | 138.7 |
| D | 2 | 249 | 775060 | 5584.49 | 562 | 547 | 138.7 |
| D | 13 | 249 | 210182 | 1511.53 | 562 | 547 | 138.7 |
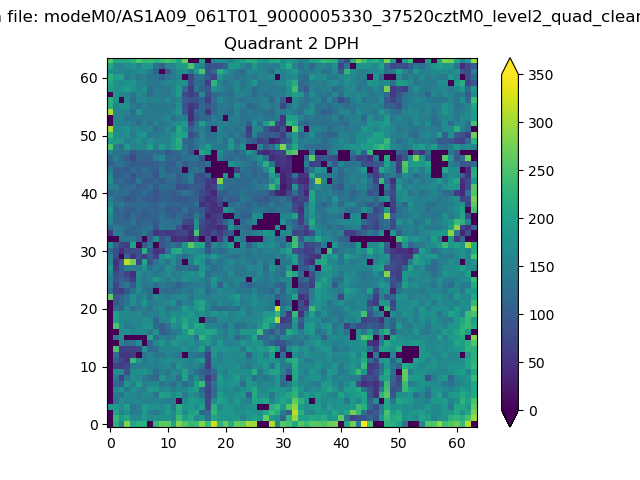
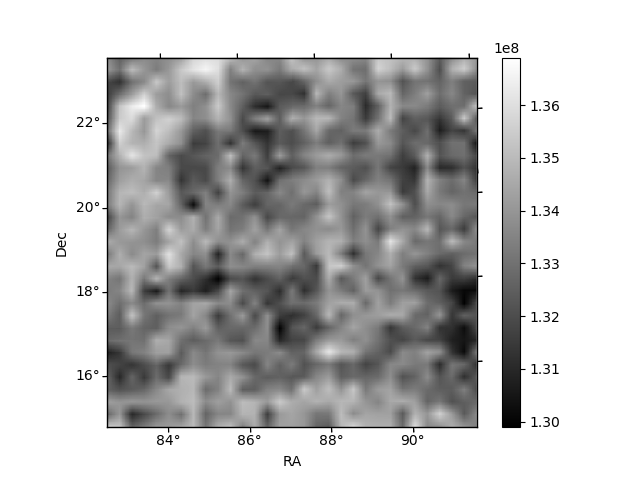
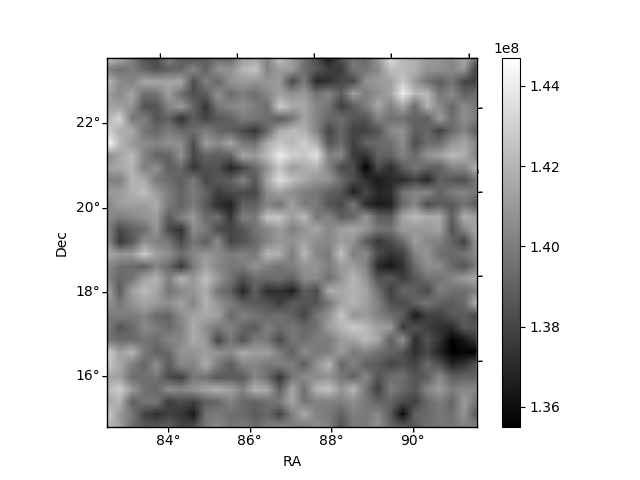
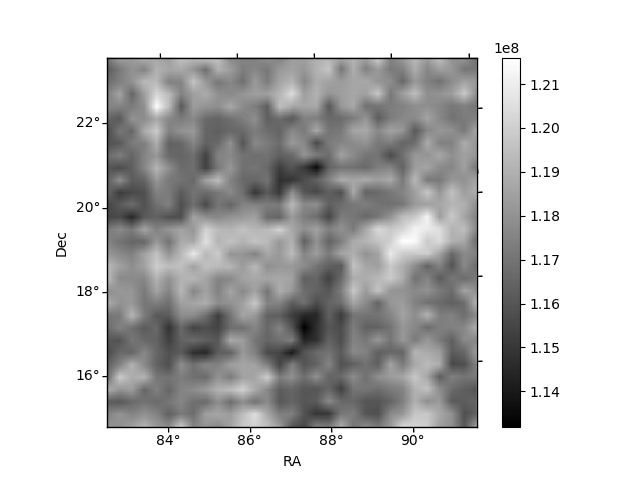
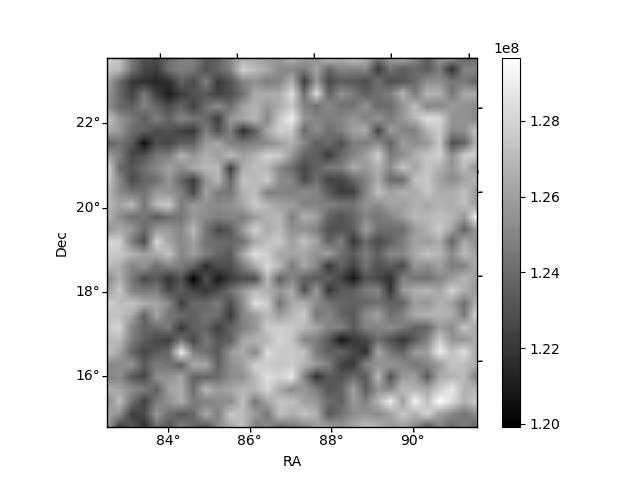
Histogram calculated using DETX and DETY for each event in the final _common_clean file
| Quadrant A | 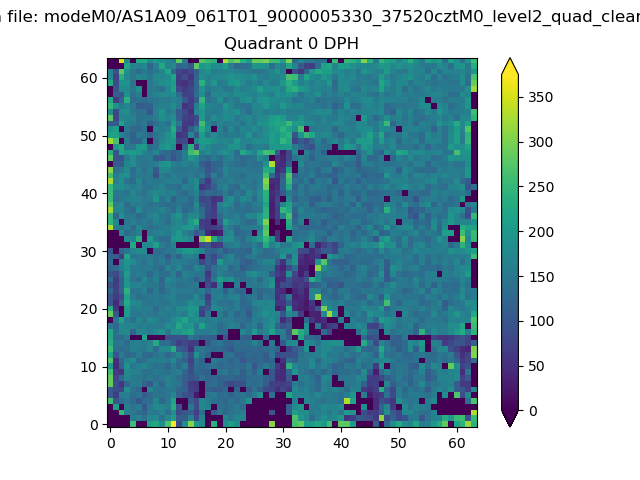 |
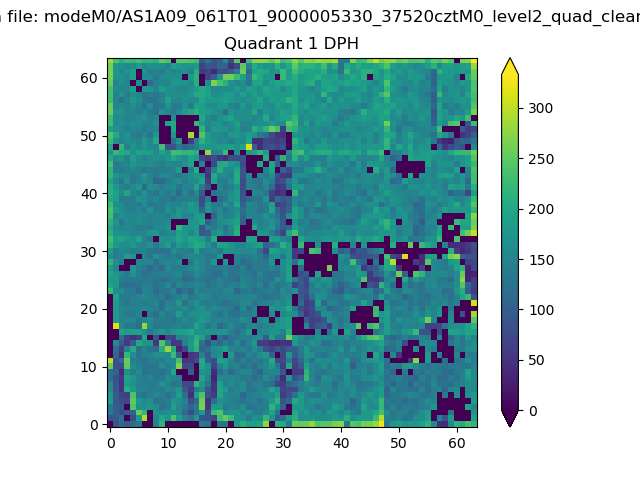 |
Quadrant B |
|---|---|---|---|
| Quadrant D | 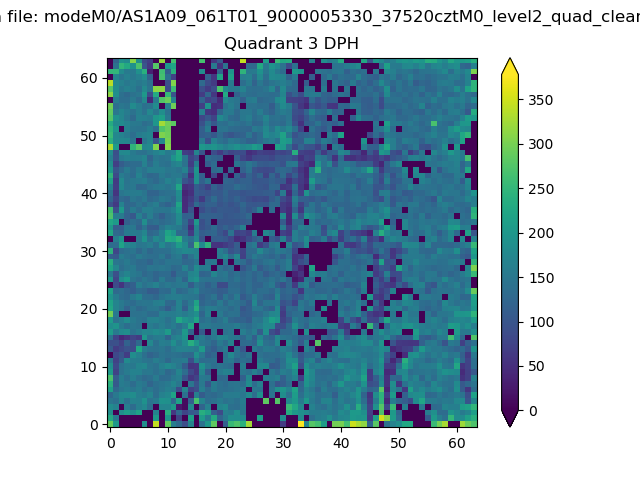 |
 |
Quadrant C |
| Plot type | Count rate plots | Images |
|---|---|---|
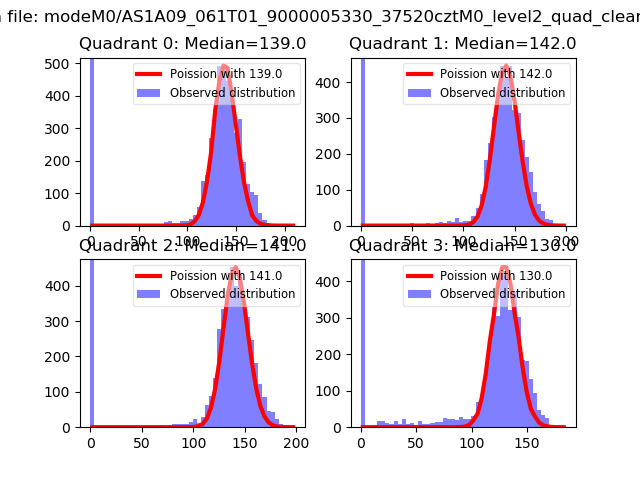
| Comparison with Poisson distribution Blue bars denote a histogram of data divided into 1 sec bins. Red curve is a Poisson curve with rate = median count rate of data. |
 |
 |
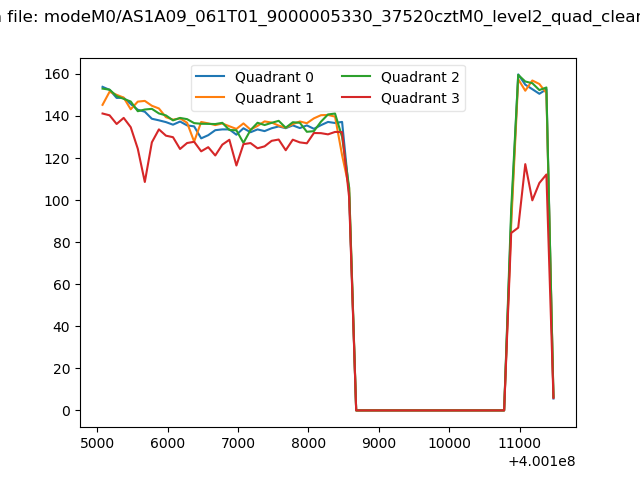
| Quadrant-wise count rates Data is divided into 100 sec bins |
 |
|
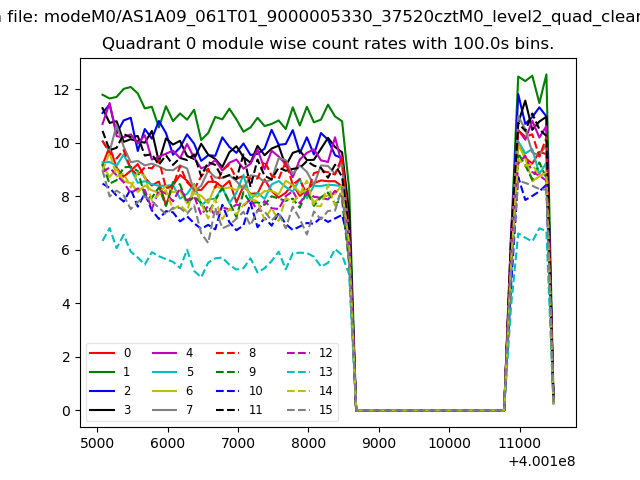
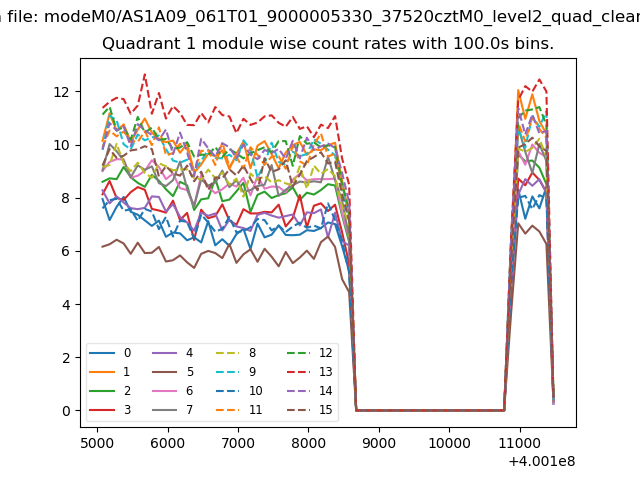
| Module-wise count rates for Quadrant A Data is divided into 100 sec bins |
 |
 |
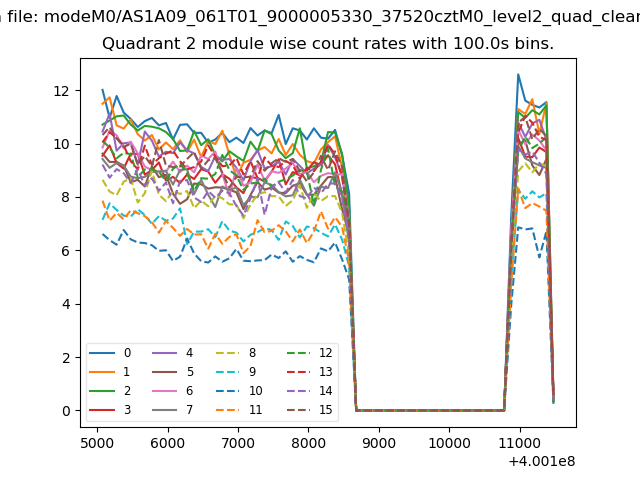
| Module-wise count rates for Quadrant B Data is divided into 100 sec bins |
 |
 |
| Module-wise count rates for Quadrant C Data is divided into 100 sec bins |
 |
 |
| Module-wise count rates for Quadrant D Data is divided into 100 sec bins |
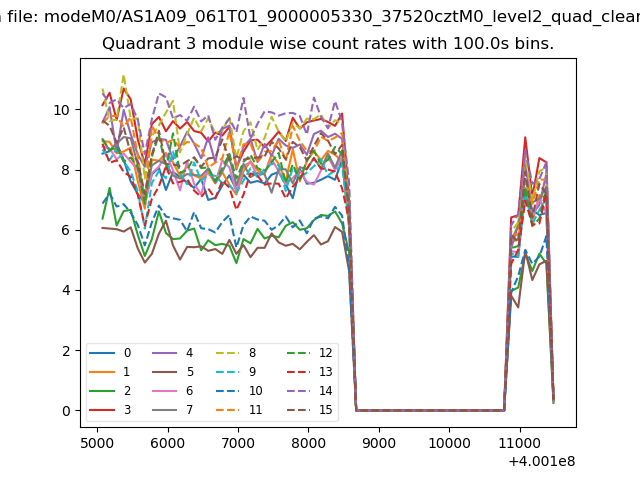 |
 |
| Parameter | Plot |
|---|---|
| CZT HV Monitor | 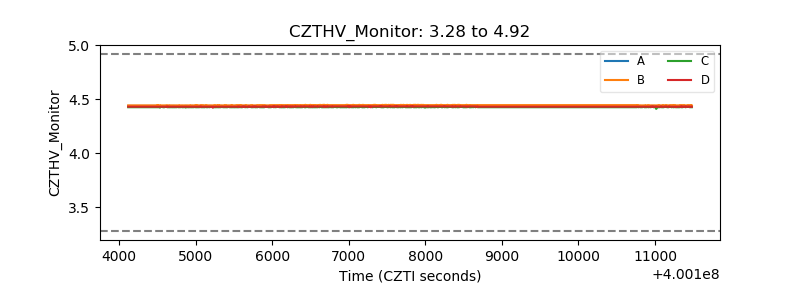 |
| D_VDD | 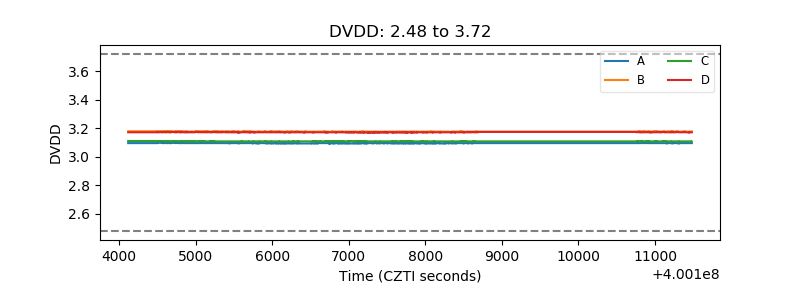 |
| Temperature 1 | 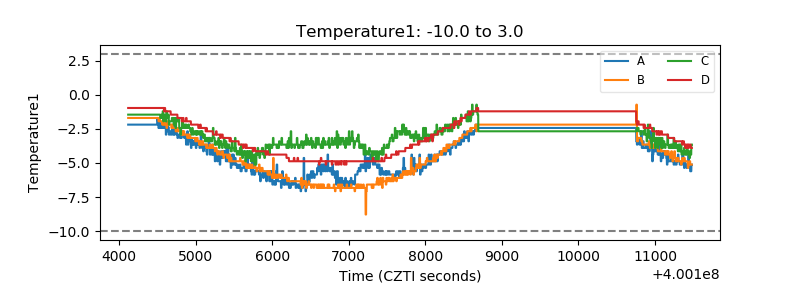 |
| Veto HV Monitor |  |
| Veto LLD | 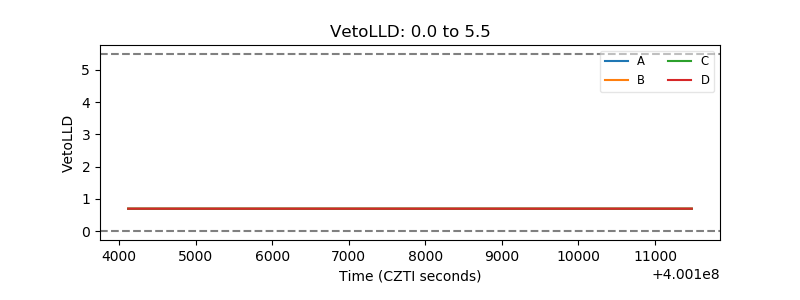 |
| Alpha Counter | 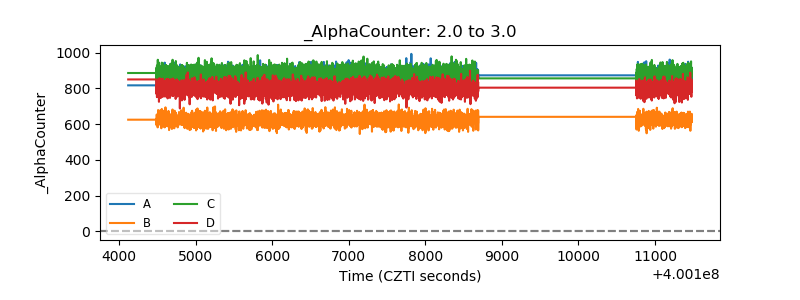 |
| _CPM_Rate | 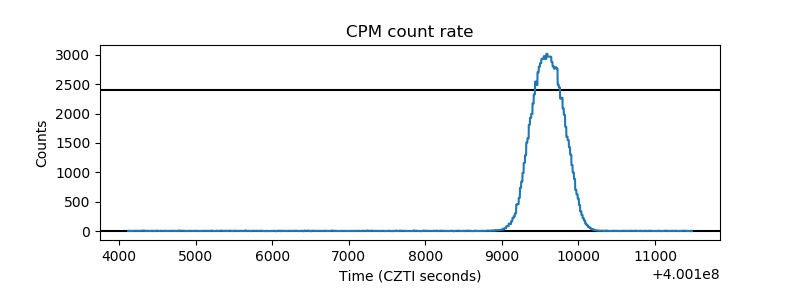 |
| CZT Counter | 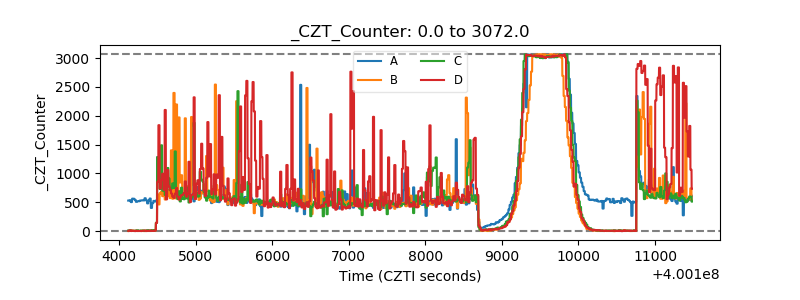 |
| +2.5 Volts monitor |  |
| +5 Volts monitor | 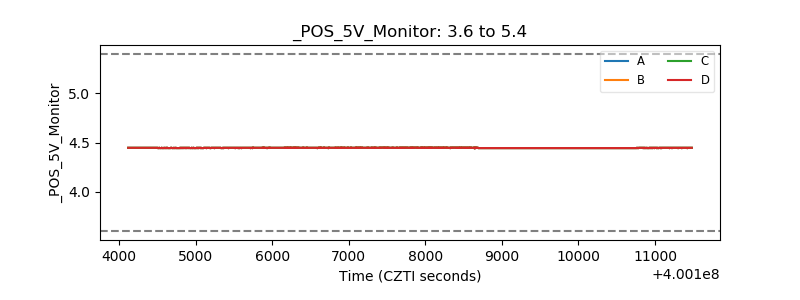 |
| _ROLL_ROT | 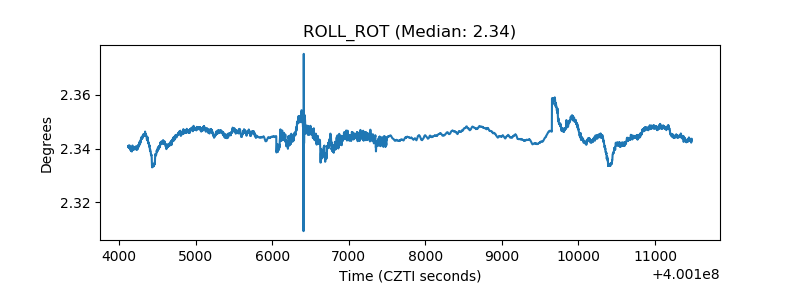 |
| _Roll_DEC | 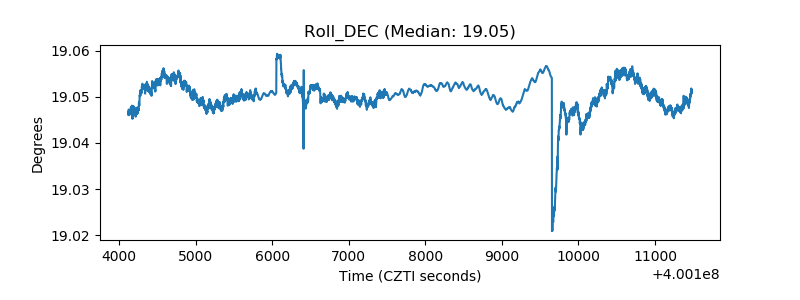 |
| _Roll_RA | 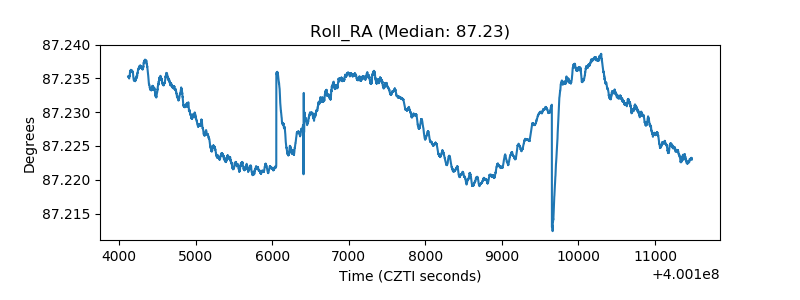 |
| Veto Counter | 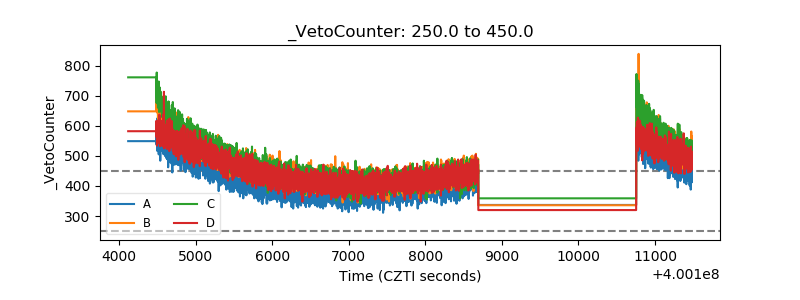 |