| Param | Original file | Final file |
|---|---|---|
| Filename | modeM0/AS1A09_061T01_9000005330_37521cztM0_level2.evt | modeM0/AS1A09_061T01_9000005330_37521cztM0_level2_quad_clean.evt |
| Size (bytes) | 452,537,280 | 90,578,880 |
| Size | 431.6 MB | 86.4 MB |
| Events in quadrant A | 2,737,807 | 608,730 |
| Events in quadrant B | 2,957,971 | 625,667 |
| Events in quadrant C | 3,000,450 | 614,605 |
| Events in quadrant D | 4,672,862 | 546,784 |
| Mode SS | |||
|---|---|---|---|
| Quadrant | BADHDUFLAG | Total packets | Discarded packets |
| A | 0 | 100 | 0 |
| B | 0 | 100 | 0 |
| C | 0 | 100 | 0 |
| D | 0 | 100 | 0 |
| Mode M9 | |||
|---|---|---|---|
| Quadrant | BADHDUFLAG | Total packets | Discarded packets |
| A | 0 | 32 | 0 |
| B | 0 | 32 | 0 |
| C | 0 | 32 | 0 |
| D | 0 | 33 | 0 |
| Mode M0 | |||
|---|---|---|---|
| Quadrant | BADHDUFLAG | Total packets | Discarded packets |
| A | 0 | 11197 | 3 |
| B | 0 | 11958 | 2 |
| C | 0 | 11872 | 2 |
| D | 0 | 17283 | 2 |
| Quadrant | Total seconds | Saturated seconds | Saturation percentage |
|---|---|---|---|
| A | 4951 | 18 | 0.363563% |
| B | 4951 | 170 | 3.433650% |
| C | 4951 | 131 | 2.645930% |
| D | 4951 | 714 | 14.421329% |
Noise dominated data is calculated using 1-second bins in cleaned event files. If a bin has >2000 counts, and if more than 50% of those come from <1% of pixels, then it is considered to be noise-dominated and hence unusable.
| Quadrant | # 1 sec bins | Bins with >0 counts | Bins with >2000 counts | High rate bins dominated by noise | Noise dominated (total time) | Noise dominated (detector-on time) | Marked lightcurve |
|---|---|---|---|---|---|---|---|
| A | 7074 | 4952 | 12 | 12 | 0.17% | 0.24% | 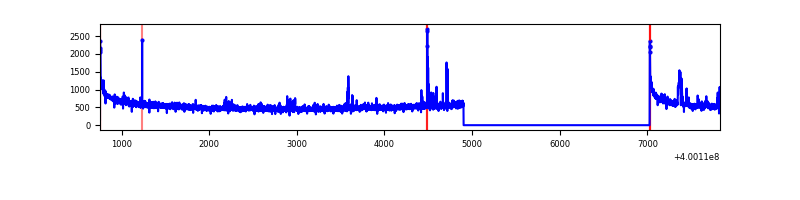 |
| B | 7074 | 4952 | 132 | 132 | 1.87% | 2.67% | 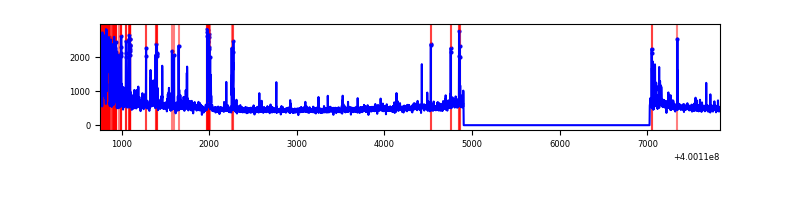 |
| C | 7074 | 4952 | 114 | 114 | 1.61% | 2.30% | 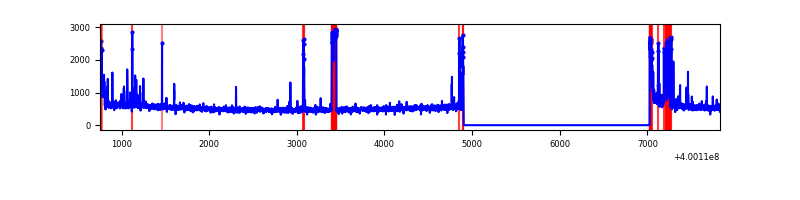 |
| D | 7074 | 4952 | 721 | 721 | 10.19% | 14.56% | 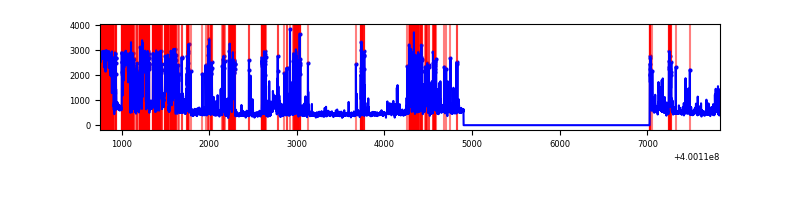 |
Top three noisy pixels from each quadrant. If the there are fewer than three noisy pixels in the level2.evt file, extra rows are filled as -1
| Pixel properties | Quadrant properties | ||||||
|---|---|---|---|---|---|---|---|
| Quadrant | DetID | PixID | Counts | Sigma | Mean | Median | Sigma |
| A | 10 | 83 | 283593 | 2312.12 | 600 | 589 | 122.4 |
| A | 12 | 227 | 35857 | 288.14 | 600 | 589 | 122.4 |
| A | 6 | 10 | 28371 | 226.98 | 600 | 589 | 122.4 |
| B | 5 | 172 | 330725 | 2904.71 | 595 | 581 | 113.7 |
| B | 5 | 255 | 66579 | 580.67 | 595 | 581 | 113.7 |
| B | 0 | 229 | 51325 | 446.46 | 595 | 581 | 113.7 |
| C | 14 | 254 | 244039 | 1756.82 | 590 | 595 | 138.6 |
| C | 15 | 214 | 208607 | 1501.12 | 590 | 595 | 138.6 |
| C | 0 | 10 | 108143 | 776.12 | 590 | 595 | 138.6 |
| D | 12 | 227 | 1338285 | 9904.28 | 546 | 531 | 135.1 |
| D | 2 | 249 | 577334 | 4270.46 | 546 | 531 | 135.1 |
| D | 13 | 249 | 238995 | 1765.51 | 546 | 531 | 135.1 |
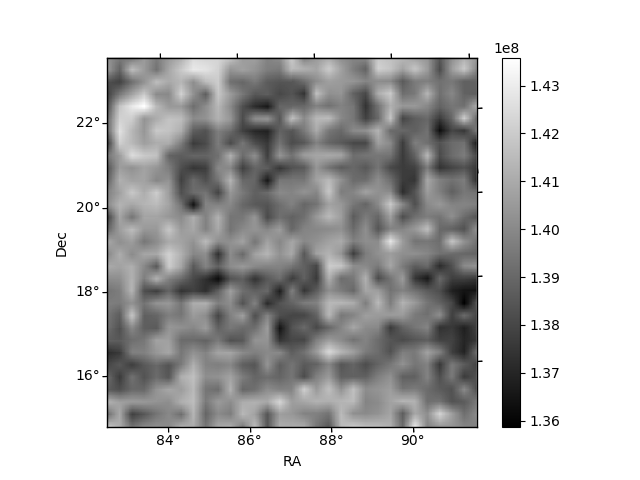
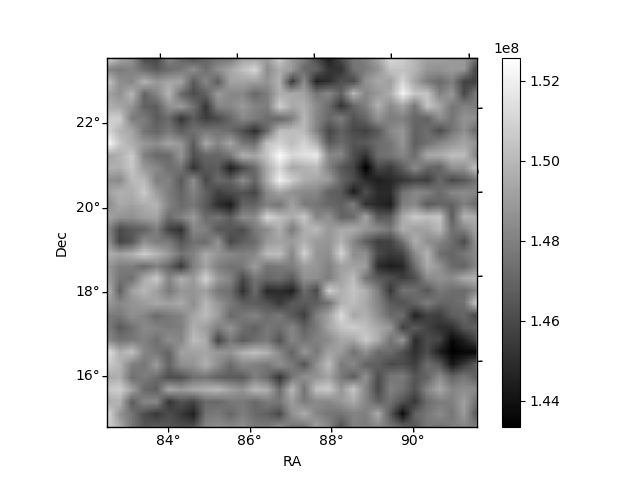
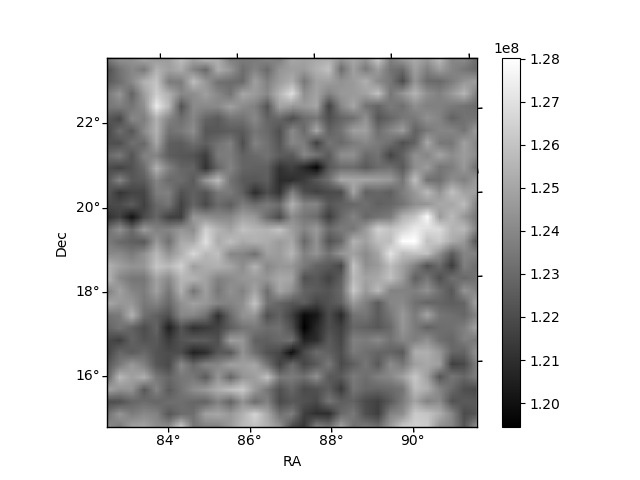
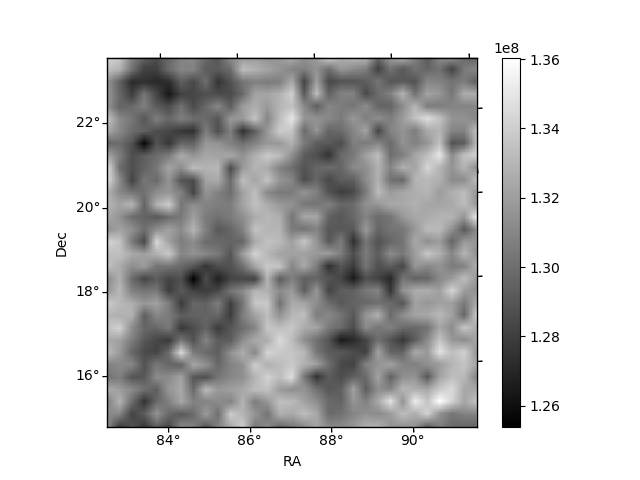
Histogram calculated using DETX and DETY for each event in the final _common_clean file
| Quadrant A | 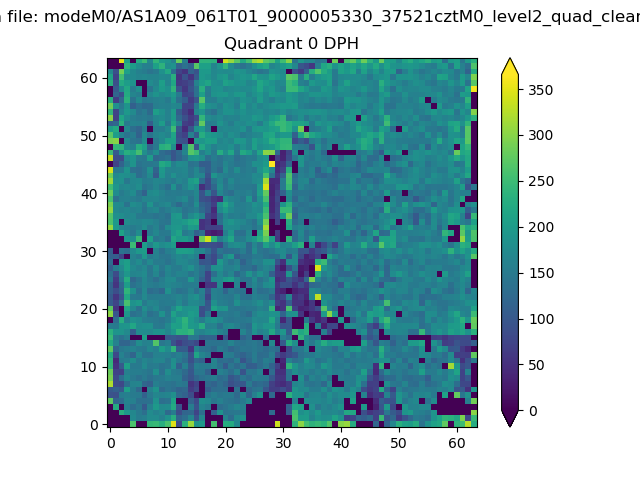 |
 |
Quadrant B |
|---|---|---|---|
| Quadrant D | 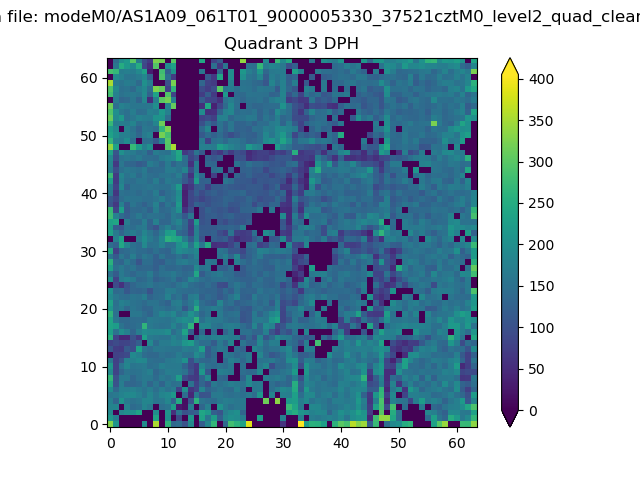 |
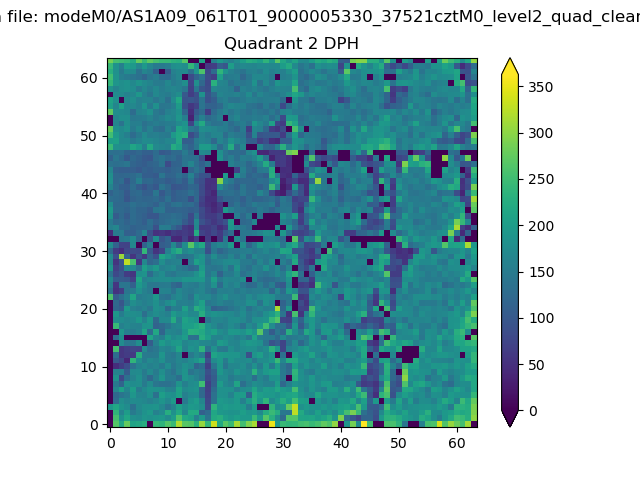 |
Quadrant C |
| Plot type | Count rate plots | Images |
|---|---|---|
| Comparison with Poisson distribution Blue bars denote a histogram of data divided into 1 sec bins. Red curve is a Poisson curve with rate = median count rate of data. |
 |
 |
| Quadrant-wise count rates Data is divided into 100 sec bins |
 |
|
| Module-wise count rates for Quadrant A Data is divided into 100 sec bins |
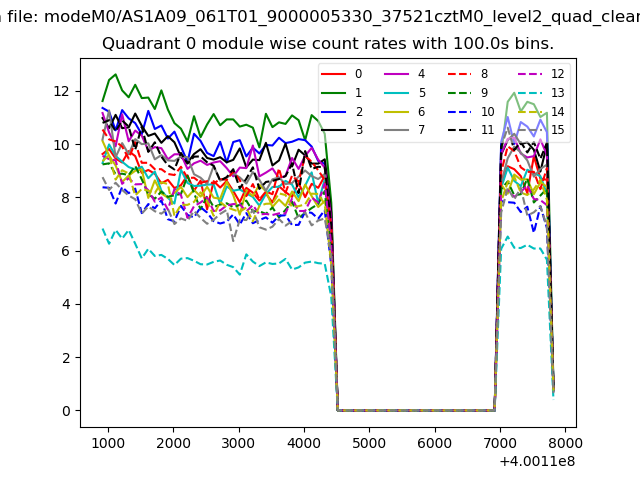 |
 |
| Module-wise count rates for Quadrant B Data is divided into 100 sec bins |
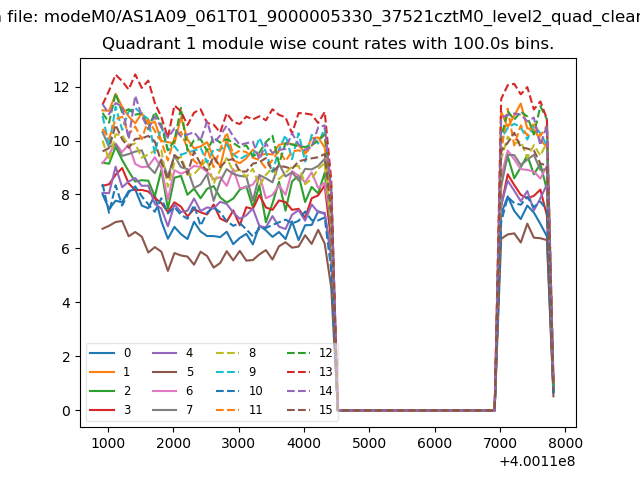 |
 |
| Module-wise count rates for Quadrant C Data is divided into 100 sec bins |
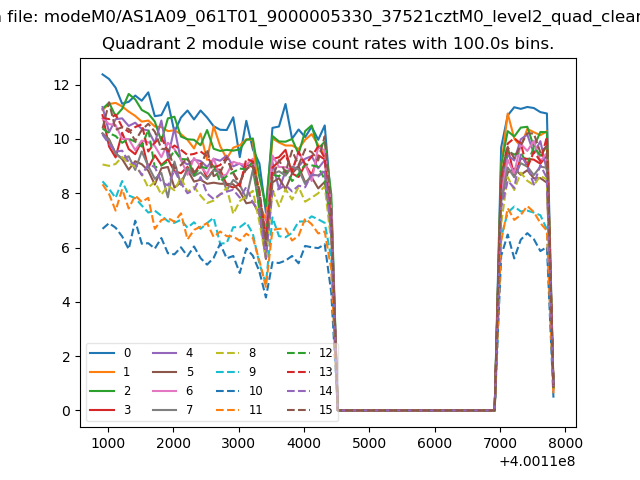 |
 |
| Module-wise count rates for Quadrant D Data is divided into 100 sec bins |
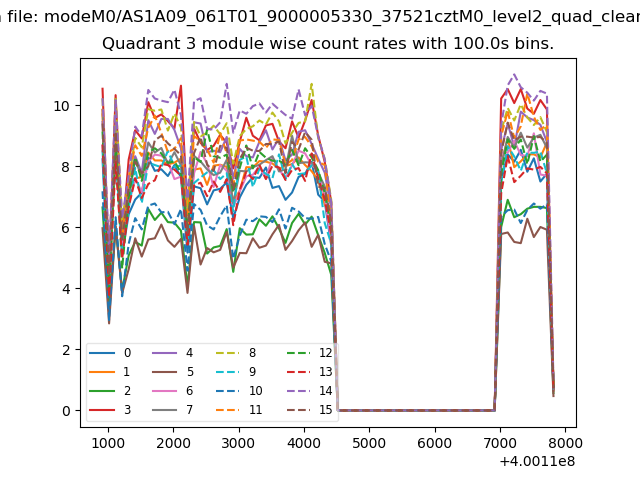 |
 |
| Parameter | Plot |
|---|---|
| CZT HV Monitor | 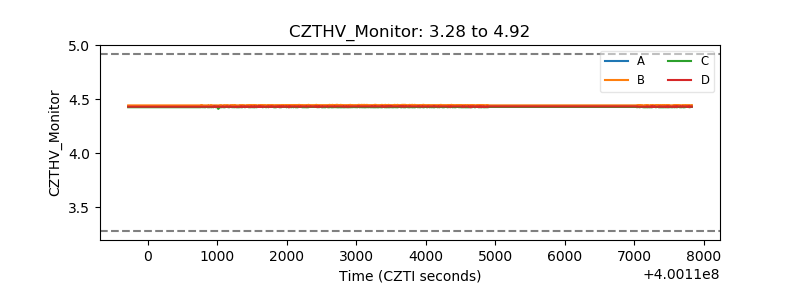 |
| D_VDD | 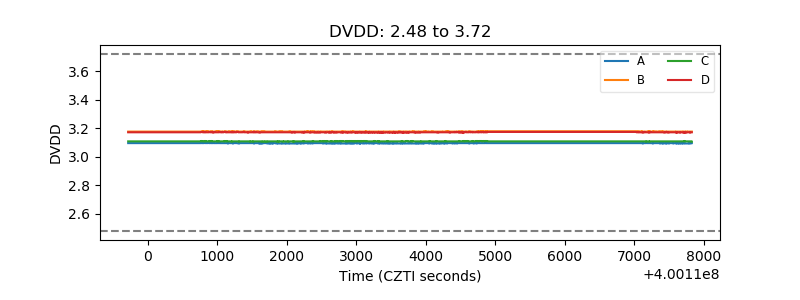 |
| Temperature 1 | 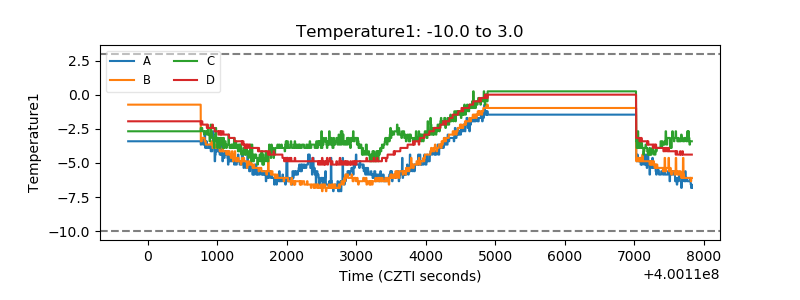 |
| Veto HV Monitor |  |
| Veto LLD | 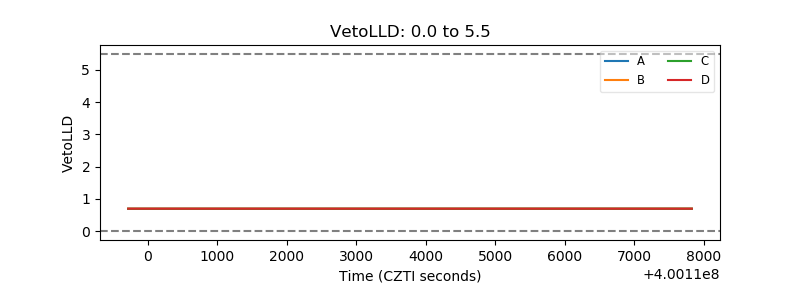 |
| Alpha Counter | 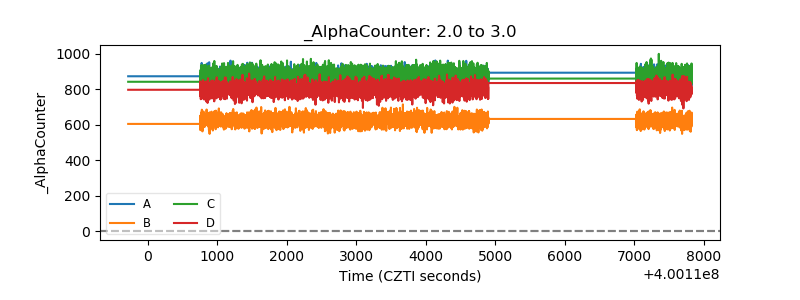 |
| _CPM_Rate |  |
| CZT Counter | 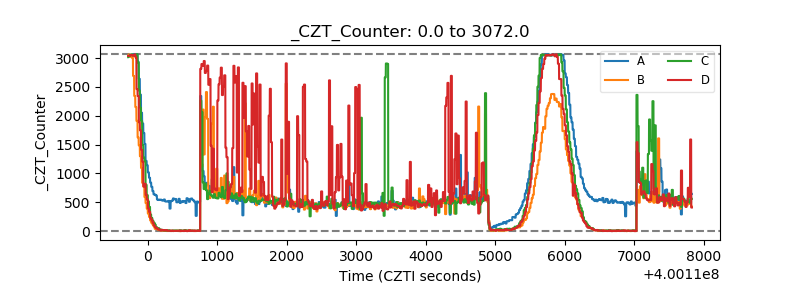 |
| +2.5 Volts monitor | 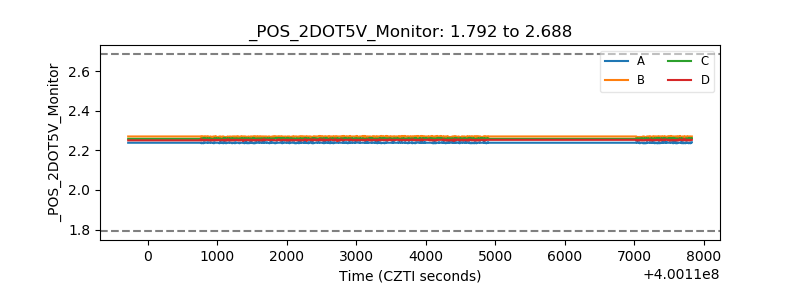 |
| +5 Volts monitor |  |
| _ROLL_ROT | 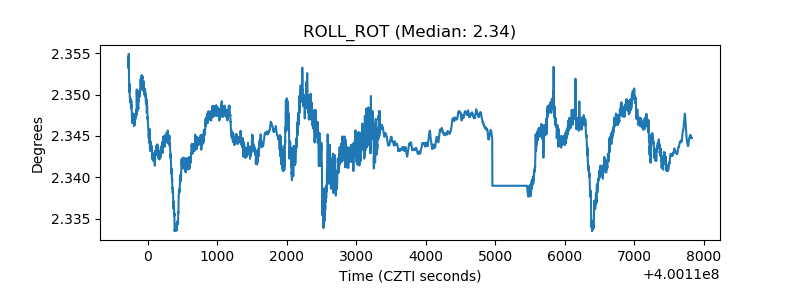 |
| _Roll_DEC | 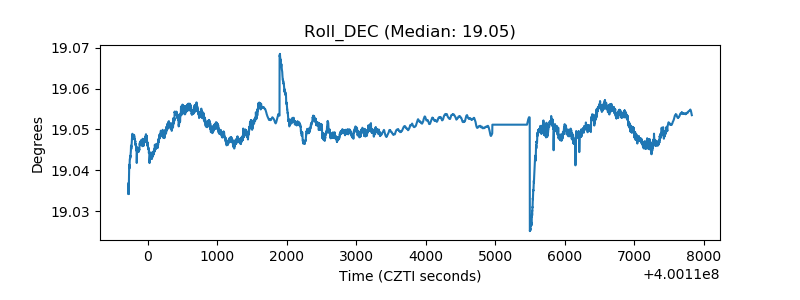 |
| _Roll_RA | 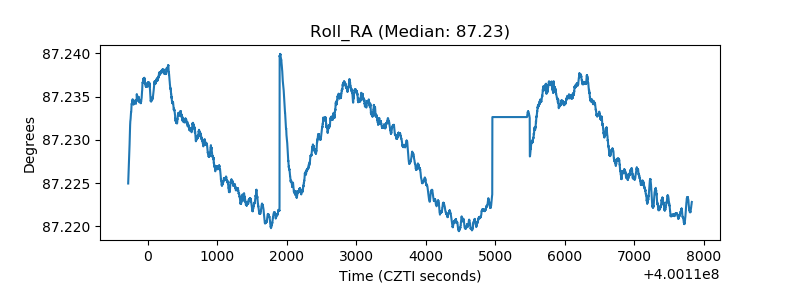 |
| Veto Counter | 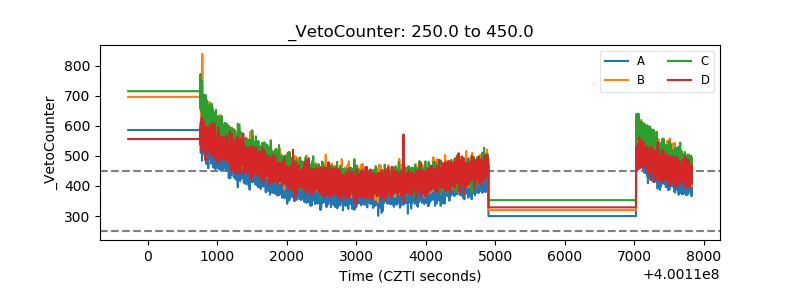 |