| Param | Original file | Final file |
|---|---|---|
| Filename | modeM0/AS1A09_061T01_9000005330_37523cztM0_level2.evt | modeM0/AS1A09_061T01_9000005330_37523cztM0_level2_quad_clean.evt |
| Size (bytes) | 426,695,040 | 72,100,800 |
| Size | 406.9 MB | 68.8 MB |
| Events in quadrant A | 2,721,057 | 458,174 |
| Events in quadrant B | 2,844,217 | 470,361 |
| Events in quadrant C | 2,699,421 | 464,887 |
| Events in quadrant D | 4,314,103 | 435,394 |
| Mode SS | |||
|---|---|---|---|
| Quadrant | BADHDUFLAG | Total packets | Discarded packets |
| A | 0 | 104 | 0 |
| B | 0 | 104 | 0 |
| C | 0 | 104 | 0 |
| D | 0 | 104 | 0 |
| Mode M9 | |||
|---|---|---|---|
| Quadrant | BADHDUFLAG | Total packets | Discarded packets |
| A | 0 | 30 | 0 |
| B | 0 | 30 | 0 |
| C | 0 | 30 | 0 |
| D | 0 | 31 | 0 |
| Mode M0 | |||
|---|---|---|---|
| Quadrant | BADHDUFLAG | Total packets | Discarded packets |
| A | 0 | 11337 | 3 |
| B | 0 | 11866 | 2 |
| C | 0 | 11134 | 2 |
| D | 0 | 16364 | 2 |
| Quadrant | Total seconds | Saturated seconds | Saturation percentage |
|---|---|---|---|
| A | 5054 | 45 | 0.890384% |
| B | 5054 | 145 | 2.869015% |
| C | 5054 | 52 | 1.028888% |
| D | 5054 | 629 | 12.445588% |
Noise dominated data is calculated using 1-second bins in cleaned event files. If a bin has >2000 counts, and if more than 50% of those come from <1% of pixels, then it is considered to be noise-dominated and hence unusable.
| Quadrant | # 1 sec bins | Bins with >0 counts | Bins with >2000 counts | High rate bins dominated by noise | Noise dominated (total time) | Noise dominated (detector-on time) | Marked lightcurve |
|---|---|---|---|---|---|---|---|
| A | 7057 | 5055 | 35 | 35 | 0.50% | 0.69% | 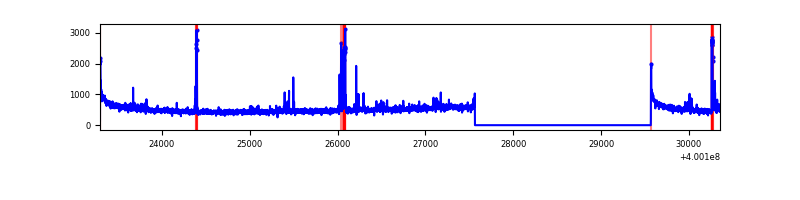 |
| B | 7057 | 5055 | 111 | 111 | 1.57% | 2.20% | 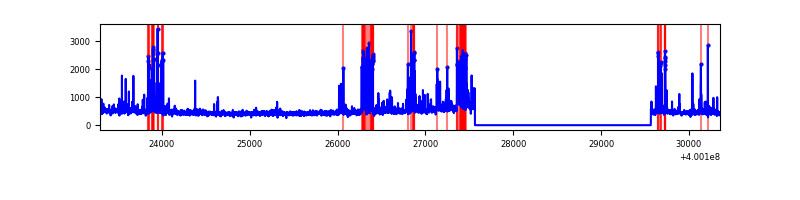 |
| C | 7057 | 5055 | 42 | 42 | 0.60% | 0.83% | 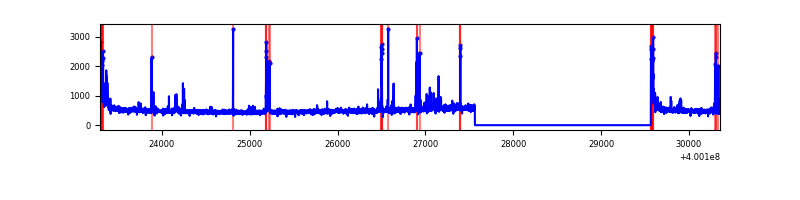 |
| D | 7057 | 5055 | 599 | 599 | 8.49% | 11.85% | 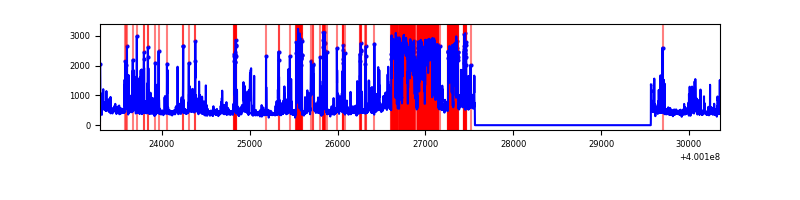 |
Top three noisy pixels from each quadrant. If the there are fewer than three noisy pixels in the level2.evt file, extra rows are filled as -1
| Pixel properties | Quadrant properties | ||||||
|---|---|---|---|---|---|---|---|
| Quadrant | DetID | PixID | Counts | Sigma | Mean | Median | Sigma |
| A | 10 | 83 | 281676 | 2414.82 | 571 | 560 | 116.4 |
| A | 13 | 248 | 144756 | 1238.66 | 571 | 560 | 116.4 |
| A | 15 | 222 | 32172 | 271.55 | 571 | 560 | 116.4 |
| B | 5 | 172 | 439218 | 4002.85 | 569 | 556 | 109.6 |
| B | 0 | 190 | 47378 | 427.26 | 569 | 556 | 109.6 |
| B | 0 | 229 | 32454 | 291.07 | 569 | 556 | 109.6 |
| C | 15 | 214 | 216277 | 1628.65 | 561 | 565 | 132.4 |
| C | 14 | 254 | 149591 | 1125.16 | 561 | 565 | 132.4 |
| C | 0 | 10 | 105684 | 793.66 | 561 | 565 | 132.4 |
| D | 12 | 227 | 1288681 | 9947.65 | 524 | 510 | 129.5 |
| D | 13 | 249 | 439402 | 3389.26 | 524 | 510 | 129.5 |
| D | 2 | 249 | 282944 | 2181.04 | 524 | 510 | 129.5 |
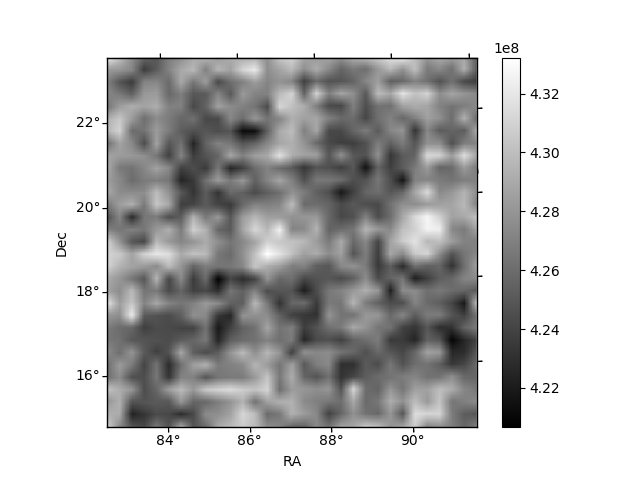
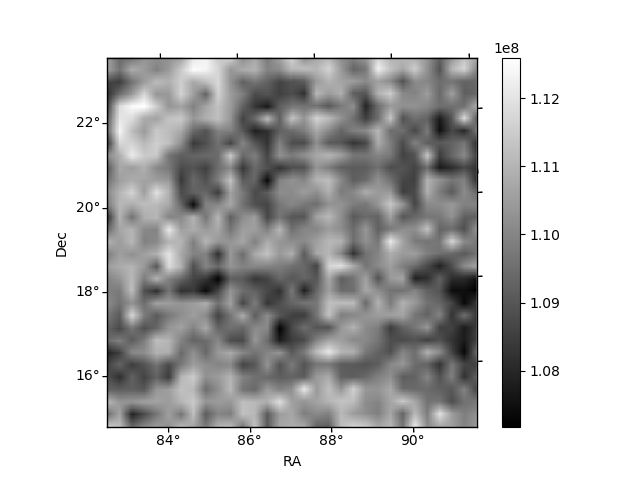
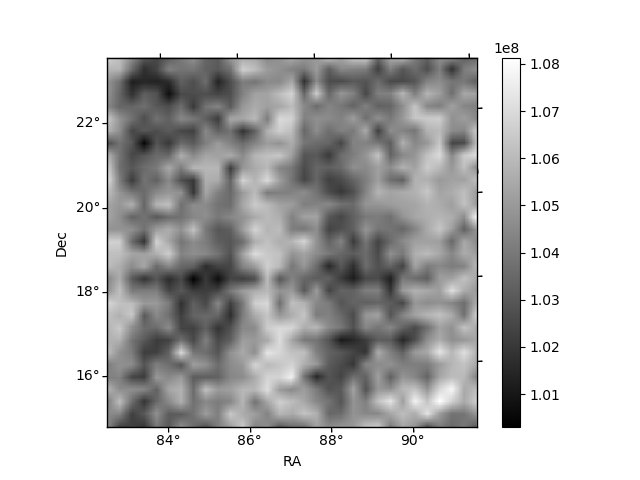
Histogram calculated using DETX and DETY for each event in the final _common_clean file
| Quadrant A | 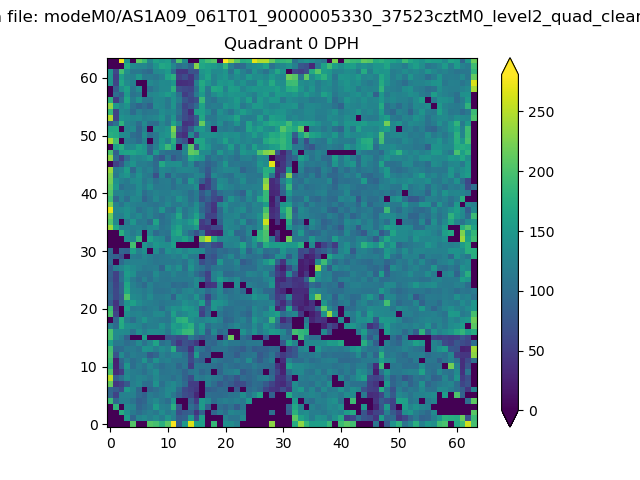 |
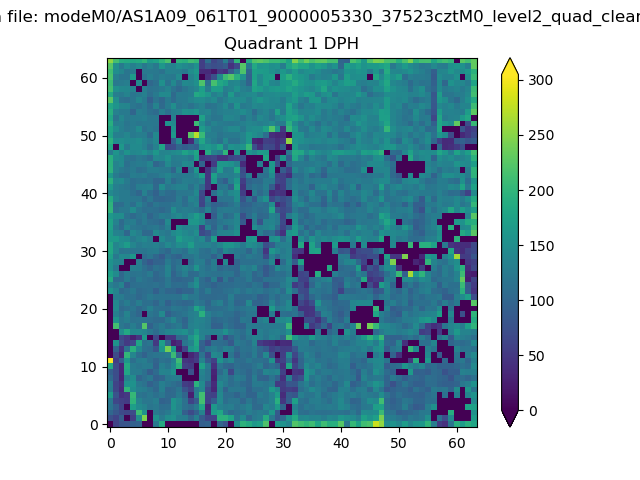 |
Quadrant B |
|---|---|---|---|
| Quadrant D | 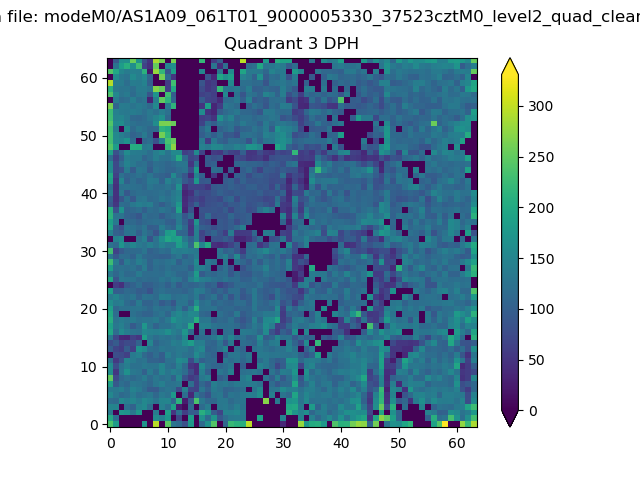 |
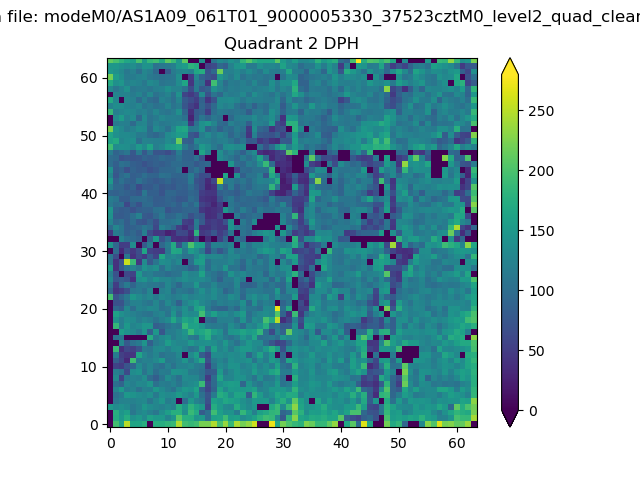 |
Quadrant C |
| Plot type | Count rate plots | Images |
|---|---|---|
| Comparison with Poisson distribution Blue bars denote a histogram of data divided into 1 sec bins. Red curve is a Poisson curve with rate = median count rate of data. |
 |
 |
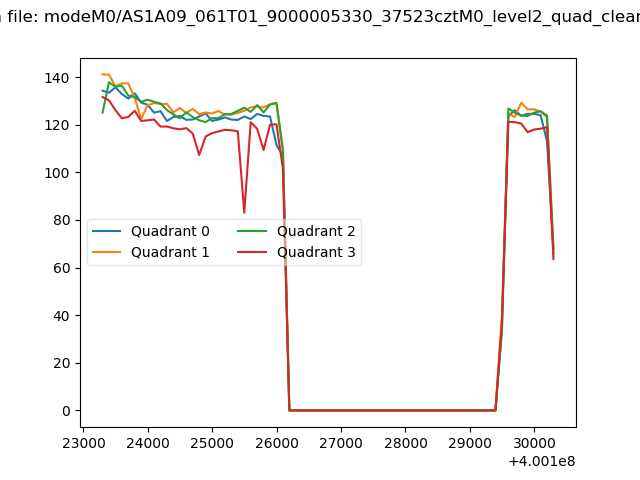
| Quadrant-wise count rates Data is divided into 100 sec bins |
 |
|
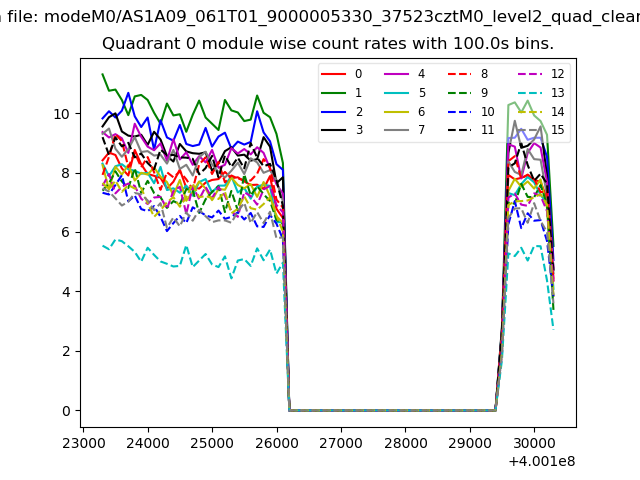
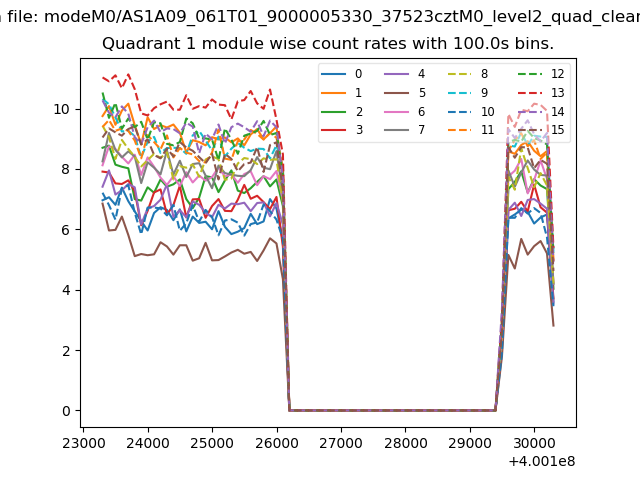
| Module-wise count rates for Quadrant A Data is divided into 100 sec bins |
 |
 |
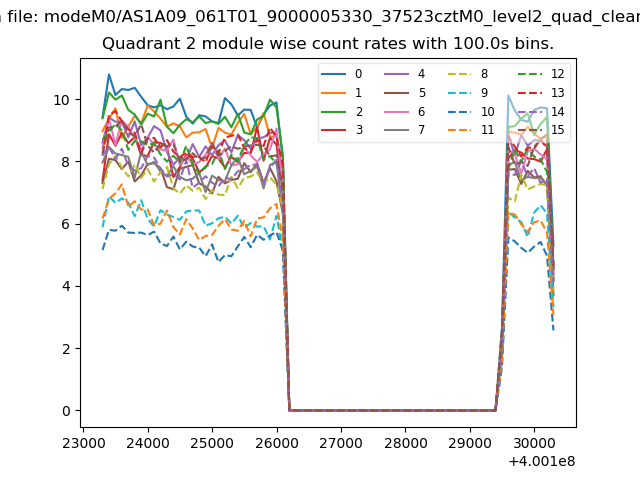
| Module-wise count rates for Quadrant B Data is divided into 100 sec bins |
 |
 |
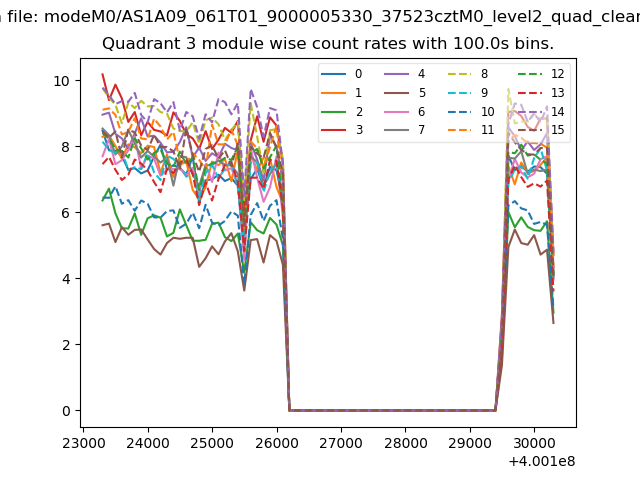
| Module-wise count rates for Quadrant C Data is divided into 100 sec bins |
 |
 |
| Module-wise count rates for Quadrant D Data is divided into 100 sec bins |
 |
 |
| Parameter | Plot |
|---|---|
| CZT HV Monitor | 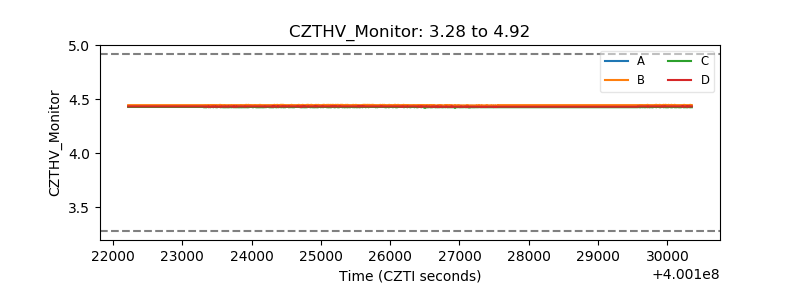 |
| D_VDD | 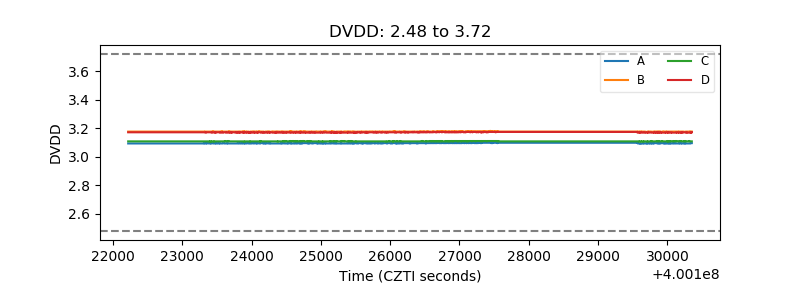 |
| Temperature 1 | 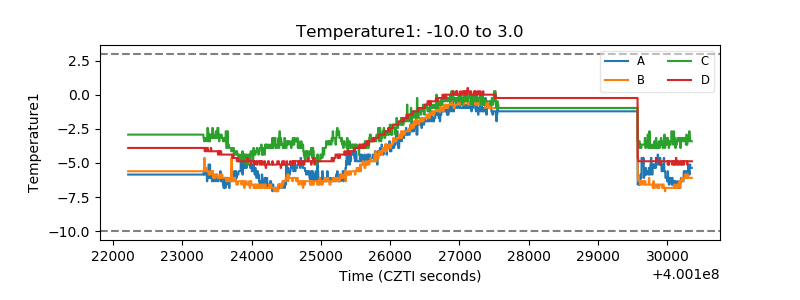 |
| Veto HV Monitor | 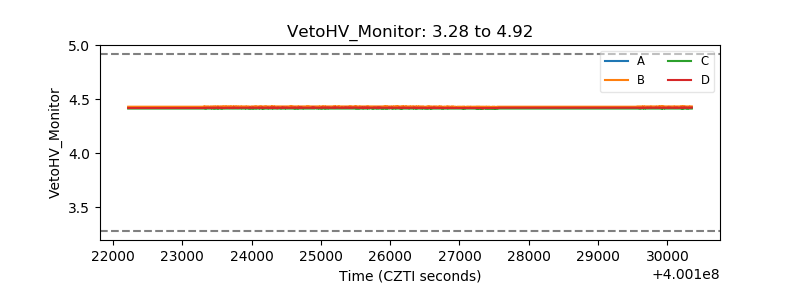 |
| Veto LLD | 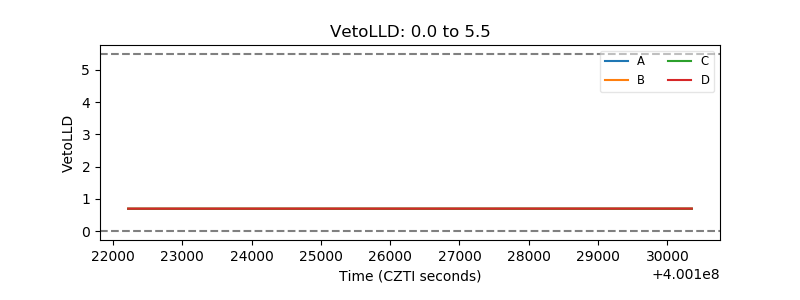 |
| Alpha Counter | 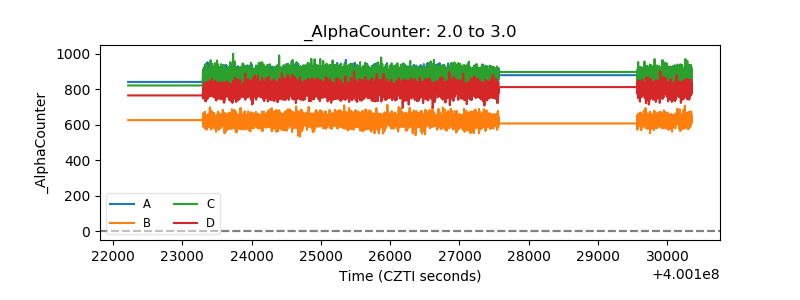 |
| _CPM_Rate | 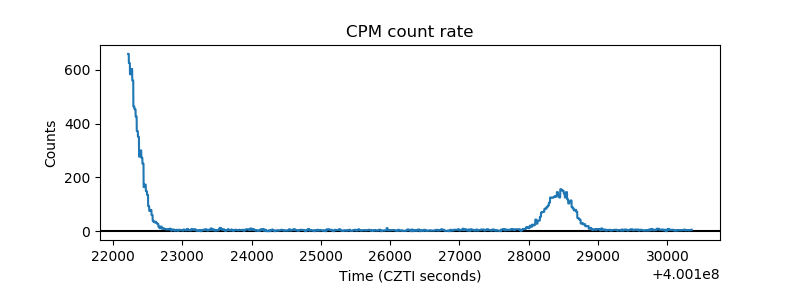 |
| CZT Counter | 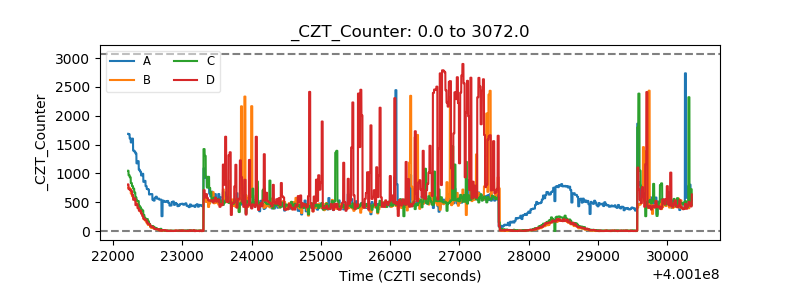 |
| +2.5 Volts monitor | 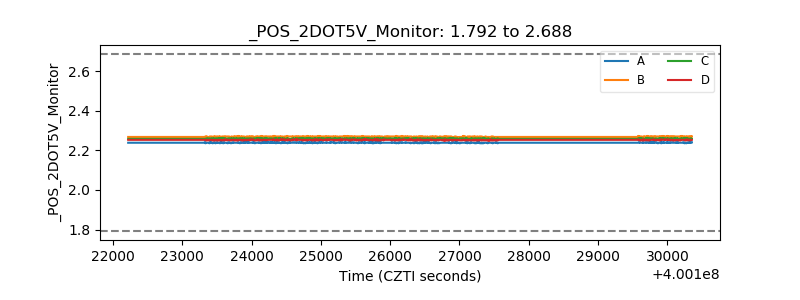 |
| +5 Volts monitor | 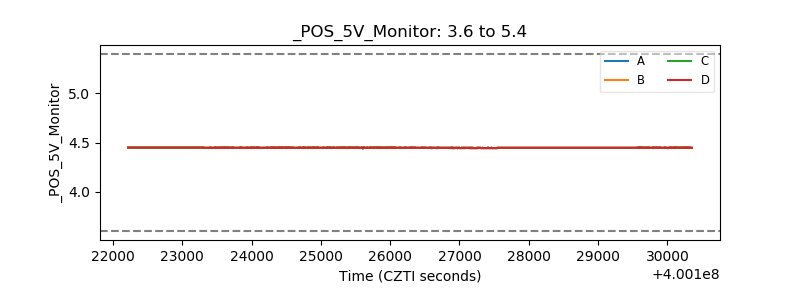 |
| _ROLL_ROT | 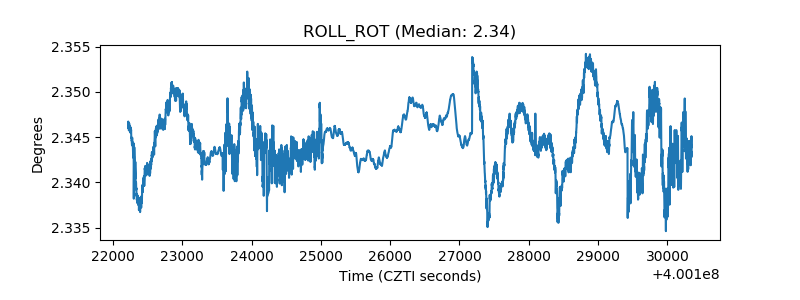 |
| _Roll_DEC | 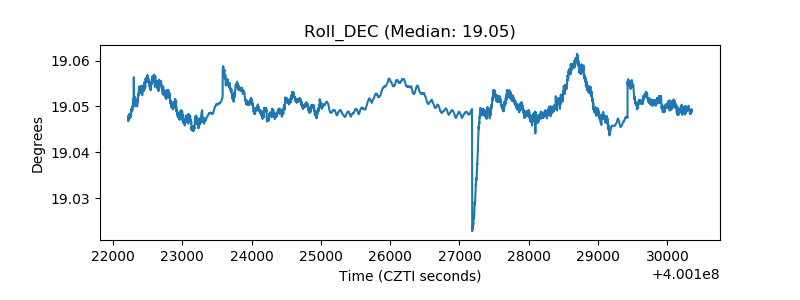 |
| _Roll_RA | 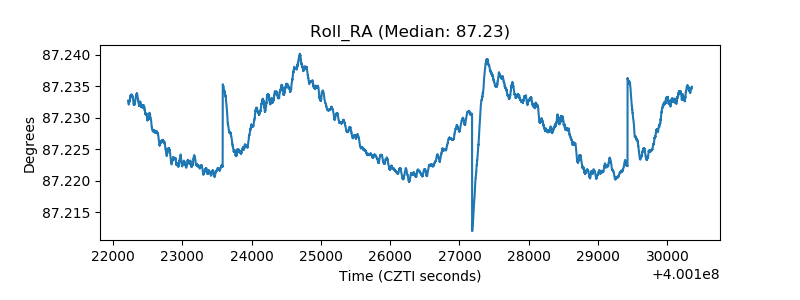 |
| Veto Counter | 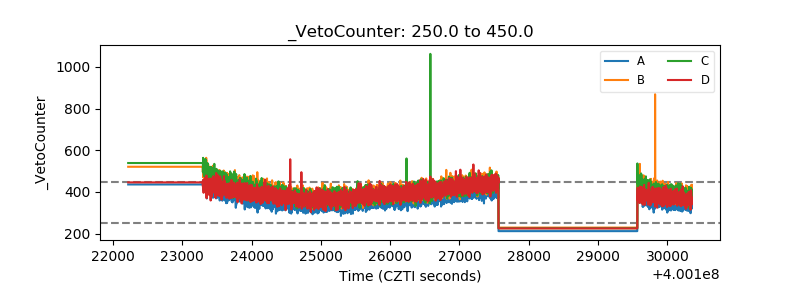 |