| Param | Original file | Final file |
|---|---|---|
| Filename | modeM0/AS1A09_061T01_9000005330_37524cztM0_level2.evt | modeM0/AS1A09_061T01_9000005330_37524cztM0_level2_quad_clean.evt |
| Size (bytes) | 473,258,880 | 63,440,640 |
| Size | 451.3 MB | 60.5 MB |
| Events in quadrant A | 2,991,191 | 389,910 |
| Events in quadrant B | 3,733,809 | 393,320 |
| Events in quadrant C | 3,147,545 | 395,947 |
| Events in quadrant D | 4,094,054 | 364,377 |
| Mode SS | |||
|---|---|---|---|
| Quadrant | BADHDUFLAG | Total packets | Discarded packets |
| A | 0 | 110 | 0 |
| B | 0 | 110 | 0 |
| C | 0 | 110 | 0 |
| D | 0 | 110 | 0 |
| Mode M9 | |||
|---|---|---|---|
| Quadrant | BADHDUFLAG | Total packets | Discarded packets |
| A | 0 | 35 | 0 |
| B | 0 | 35 | 0 |
| C | 0 | 35 | 0 |
| D | 0 | 36 | 0 |
| Mode M0 | |||
|---|---|---|---|
| Quadrant | BADHDUFLAG | Total packets | Discarded packets |
| A | 0 | 12313 | 3 |
| B | 0 | 14719 | 2 |
| C | 0 | 12729 | 2 |
| D | 0 | 15952 | 2 |
| Quadrant | Total seconds | Saturated seconds | Saturation percentage |
|---|---|---|---|
| A | 5385 | 63 | 1.169916% |
| B | 5385 | 496 | 9.210771% |
| C | 5385 | 195 | 3.621170% |
| D | 5385 | 504 | 9.359331% |
Noise dominated data is calculated using 1-second bins in cleaned event files. If a bin has >2000 counts, and if more than 50% of those come from <1% of pixels, then it is considered to be noise-dominated and hence unusable.
| Quadrant | # 1 sec bins | Bins with >0 counts | Bins with >2000 counts | High rate bins dominated by noise | Noise dominated (total time) | Noise dominated (detector-on time) | Marked lightcurve |
|---|---|---|---|---|---|---|---|
| A | 7087 | 5386 | 59 | 59 | 0.83% | 1.10% | 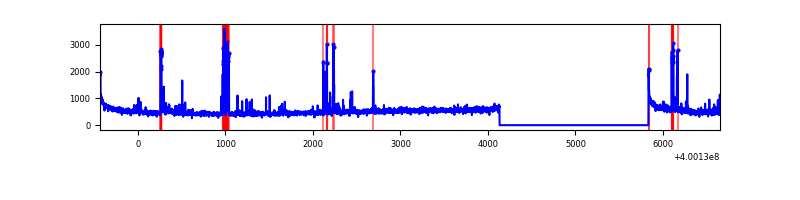 |
| B | 7087 | 5385 | 406 | 406 | 5.73% | 7.54% | 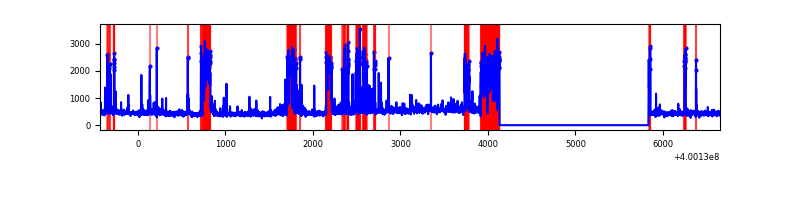 |
| C | 7087 | 5386 | 169 | 169 | 2.38% | 3.14% | 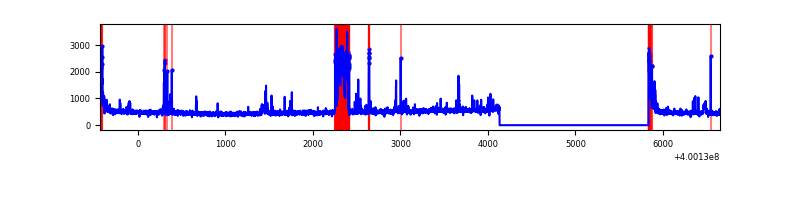 |
| D | 7087 | 5385 | 495 | 495 | 6.98% | 9.19% | 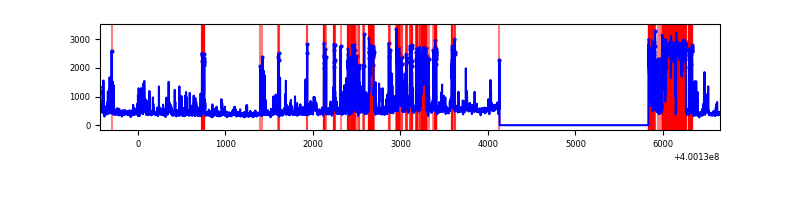 |
Top three noisy pixels from each quadrant. If the there are fewer than three noisy pixels in the level2.evt file, extra rows are filled as -1
| Pixel properties | Quadrant properties | ||||||
|---|---|---|---|---|---|---|---|
| Quadrant | DetID | PixID | Counts | Sigma | Mean | Median | Sigma |
| A | 10 | 83 | 296331 | 2399.95 | 603 | 590 | 123.2 |
| A | 13 | 248 | 225892 | 1828.33 | 603 | 590 | 123.2 |
| A | 15 | 222 | 62320 | 500.94 | 603 | 590 | 123.2 |
| B | 5 | 172 | 840377 | 7538.31 | 580 | 565 | 111.4 |
| B | 0 | 229 | 422206 | 3784.73 | 580 | 565 | 111.4 |
| B | 0 | 213 | 44332 | 392.86 | 580 | 565 | 111.4 |
| C | 14 | 254 | 500322 | 3625.95 | 579 | 582 | 137.8 |
| C | 15 | 214 | 226871 | 1641.88 | 579 | 582 | 137.8 |
| C | 0 | 10 | 128056 | 924.91 | 579 | 582 | 137.8 |
| D | 12 | 227 | 822627 | 5854.1 | 570 | 554 | 140.4 |
| D | 2 | 249 | 342986 | 2438.51 | 570 | 554 | 140.4 |
| D | 12 | 233 | 234413 | 1665.34 | 570 | 554 | 140.4 |
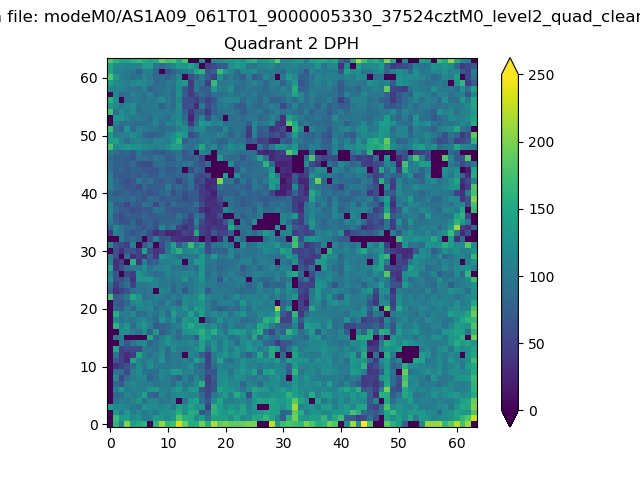
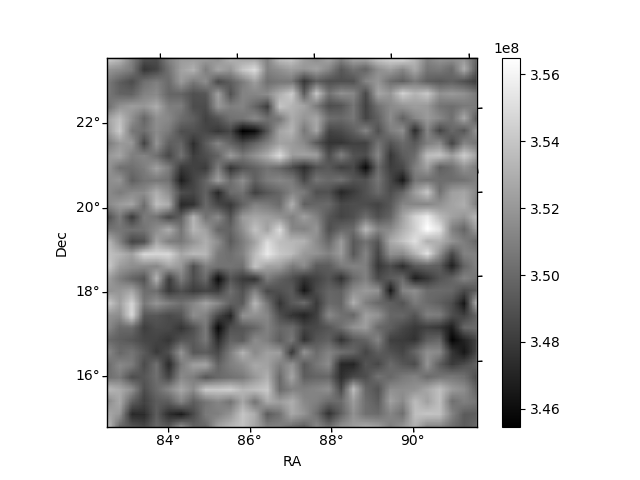
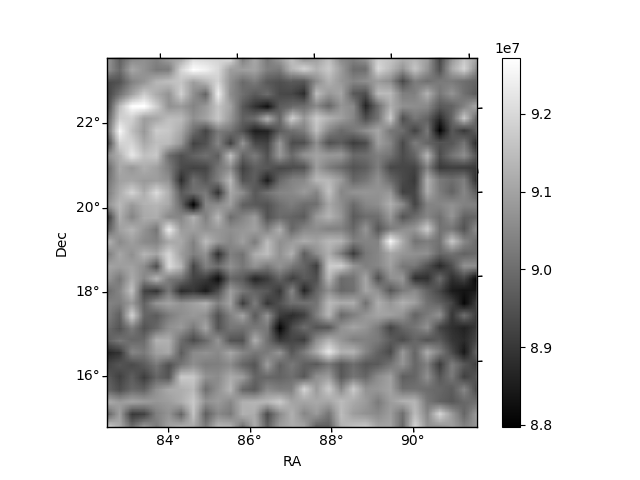
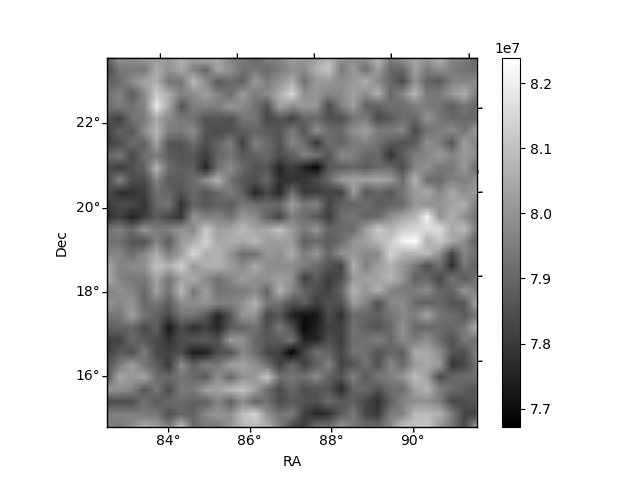
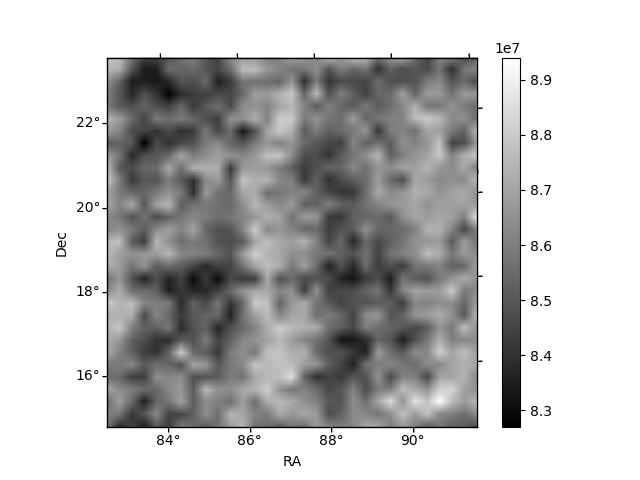
Histogram calculated using DETX and DETY for each event in the final _common_clean file
| Quadrant A | 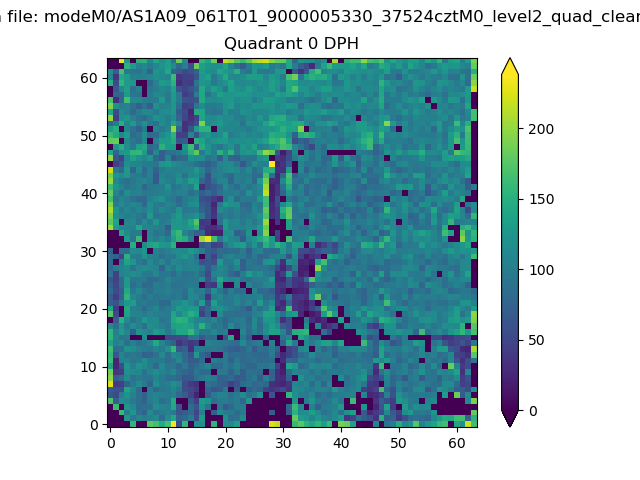 |
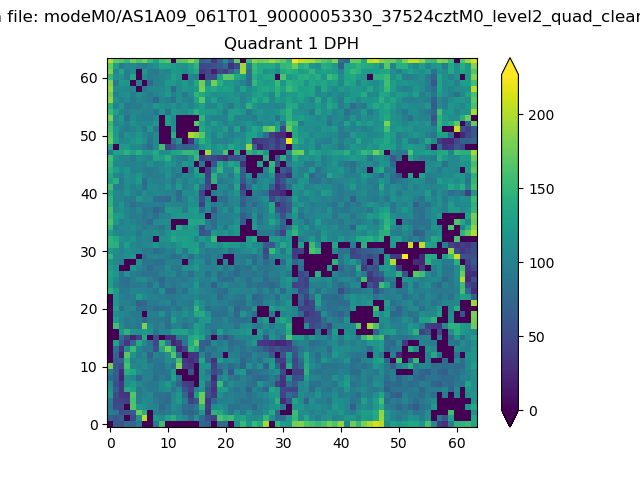 |
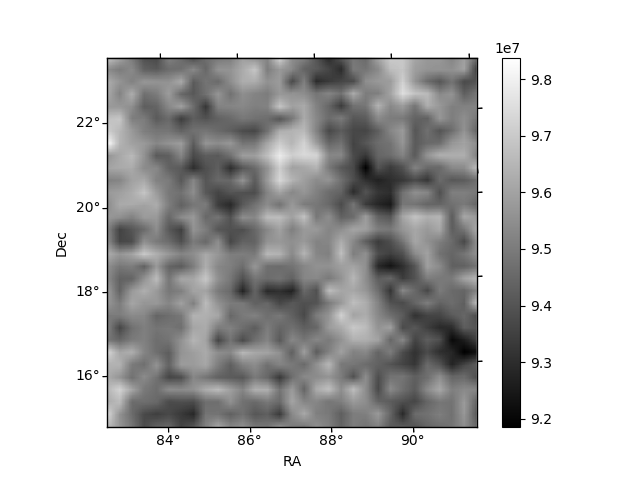
Quadrant B |
|---|---|---|---|
| Quadrant D | 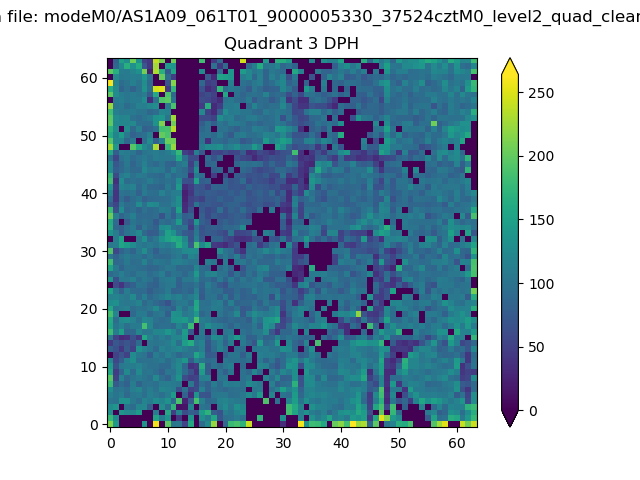 |
 |
Quadrant C |
| Plot type | Count rate plots | Images |
|---|---|---|
| Comparison with Poisson distribution Blue bars denote a histogram of data divided into 1 sec bins. Red curve is a Poisson curve with rate = median count rate of data. |
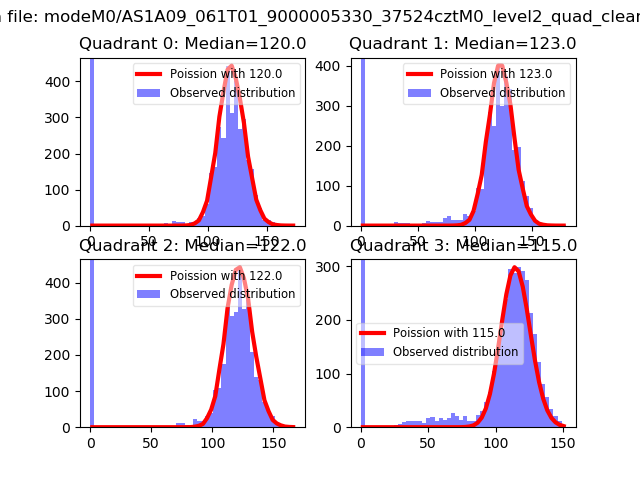 |
 |
| Quadrant-wise count rates Data is divided into 100 sec bins |
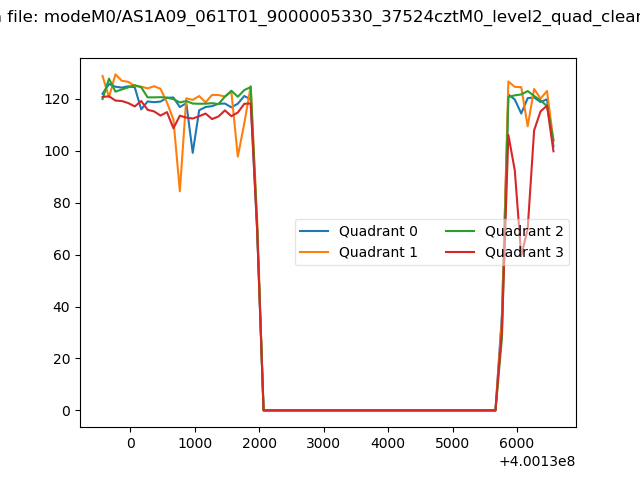 |
|
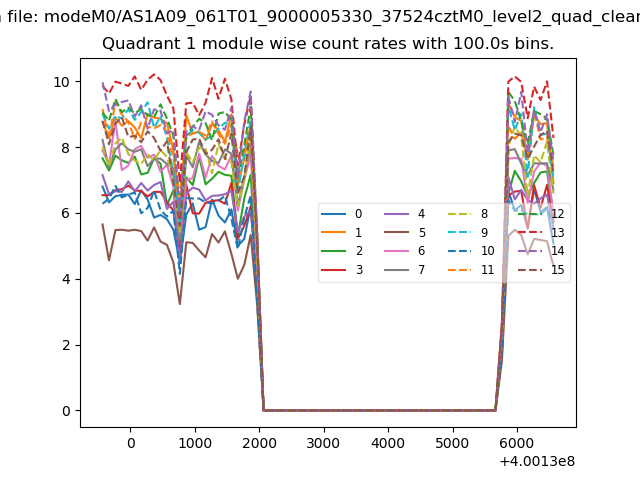
| Module-wise count rates for Quadrant A Data is divided into 100 sec bins |
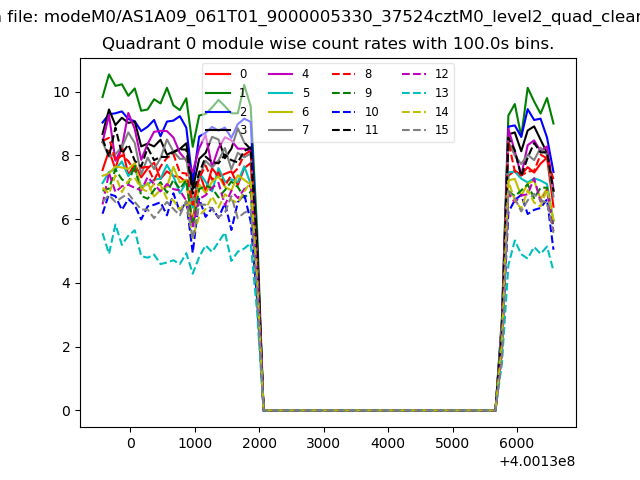 |
 |
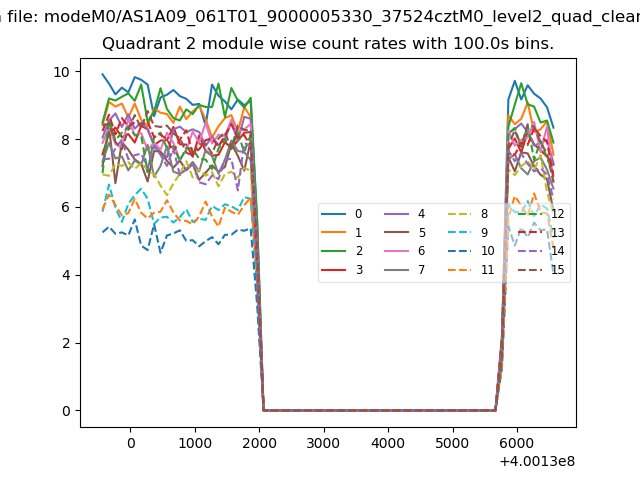
| Module-wise count rates for Quadrant B Data is divided into 100 sec bins |
 |
 |
| Module-wise count rates for Quadrant C Data is divided into 100 sec bins |
 |
 |
| Module-wise count rates for Quadrant D Data is divided into 100 sec bins |
 |
 |
| Parameter | Plot |
|---|---|
| CZT HV Monitor | 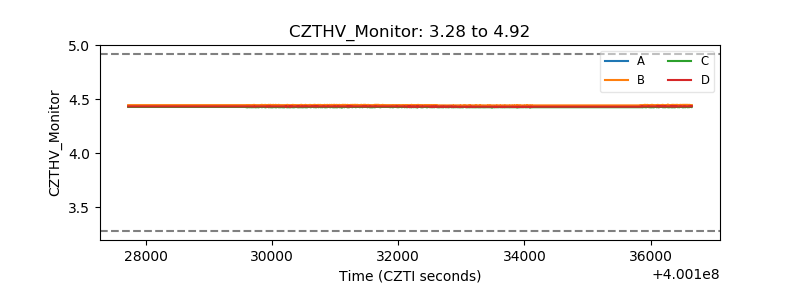 |
| D_VDD | 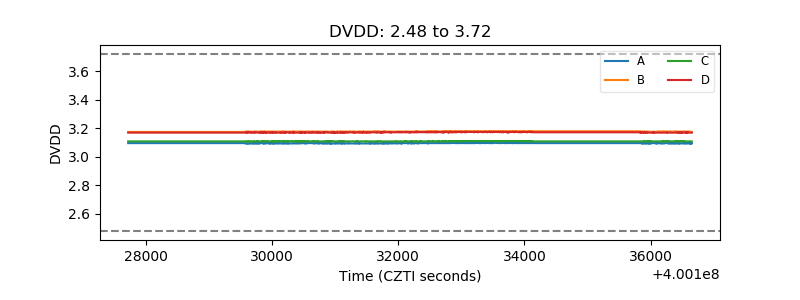 |
| Temperature 1 | 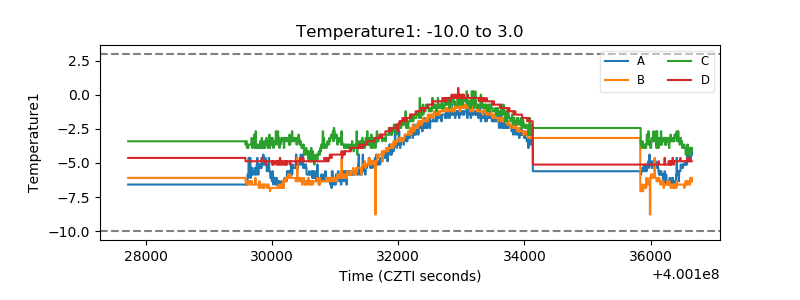 |
| Veto HV Monitor | 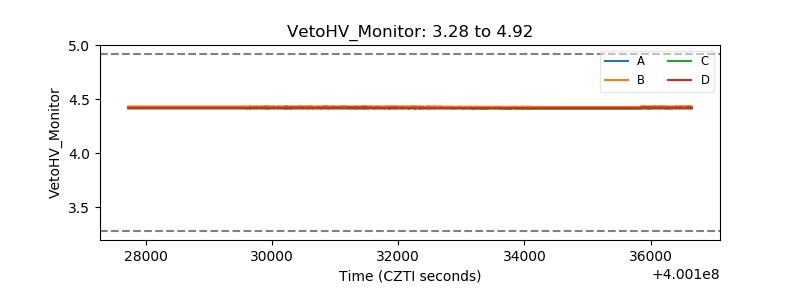 |
| Veto LLD | 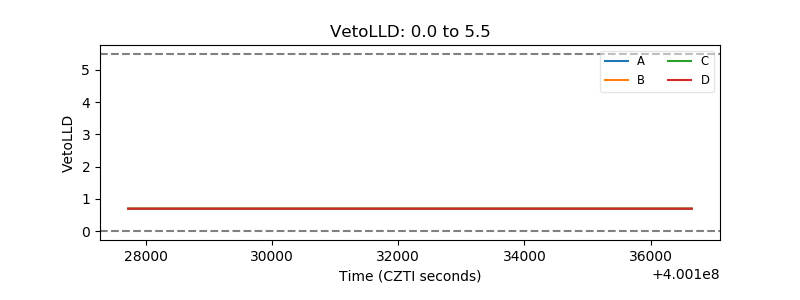 |
| Alpha Counter |  |
| _CPM_Rate | 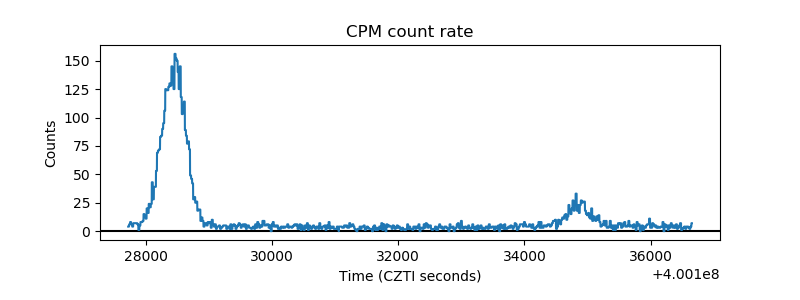 |
| CZT Counter | 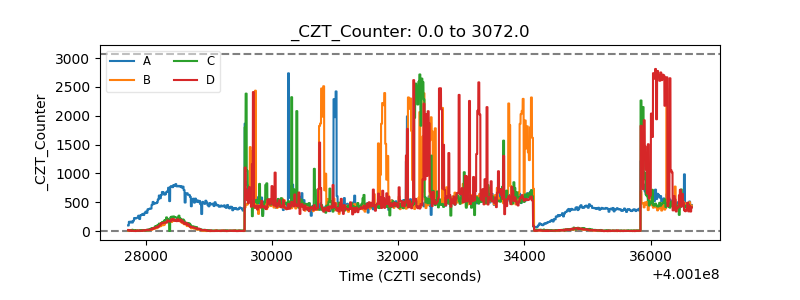 |
| +2.5 Volts monitor | 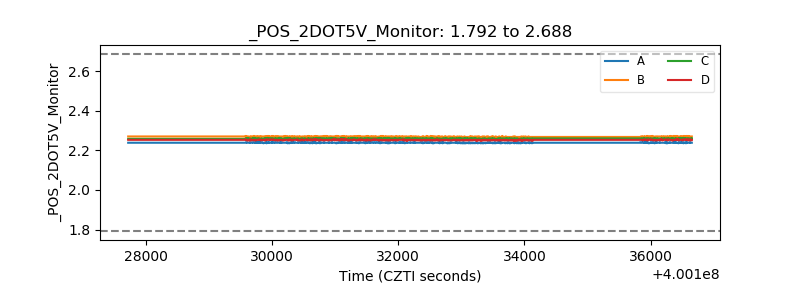 |
| +5 Volts monitor |  |
| _ROLL_ROT | 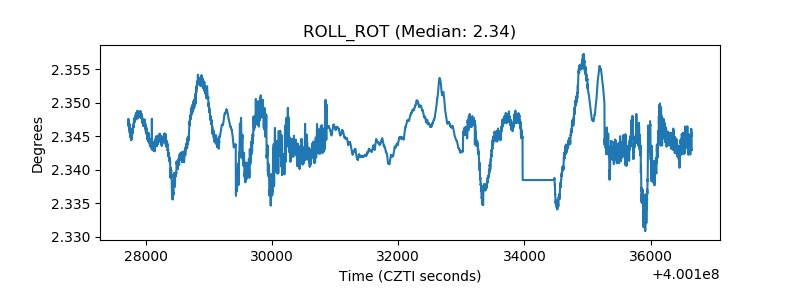 |
| _Roll_DEC | 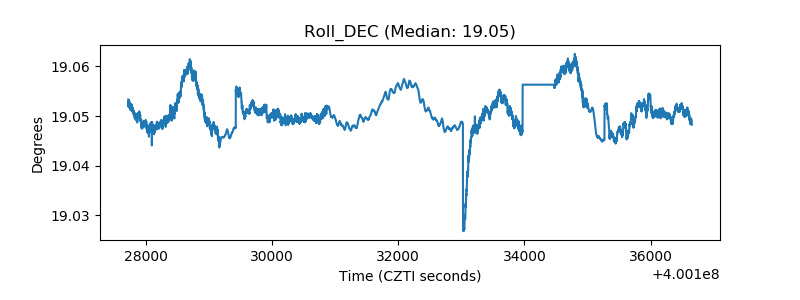 |
| _Roll_RA | 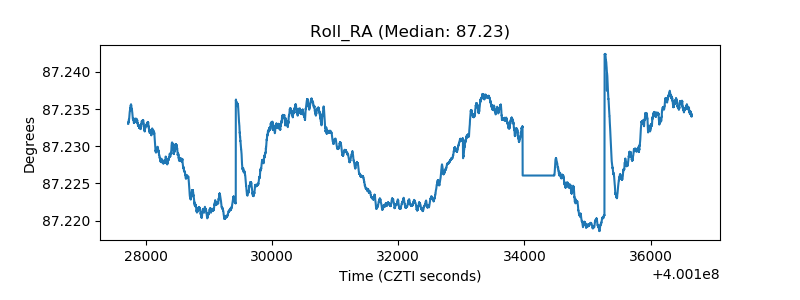 |
| Veto Counter | 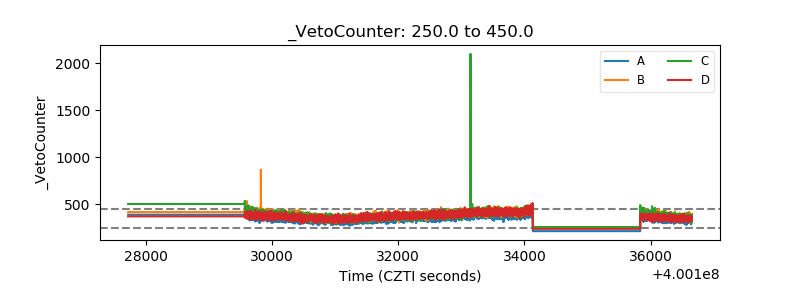 |