| Param | Original file | Final file |
|---|---|---|
| Filename | modeM0/AS1A09_061T01_9000005330_37529cztM0_level2.evt | modeM0/AS1A09_061T01_9000005330_37529cztM0_level2_quad_clean.evt |
| Size (bytes) | 1,441,716,480 | 161,003,520 |
| Size | 1.3 GB | 153.5 MB |
| Events in quadrant A | 8,734,593 | 978,022 |
| Events in quadrant B | 9,044,712 | 985,547 |
| Events in quadrant C | 8,585,364 | 968,117 |
| Events in quadrant D | 16,244,042 | 865,200 |
| Mode SS | |||
|---|---|---|---|
| Quadrant | BADHDUFLAG | Total packets | Discarded packets |
| A | 0 | 320 | 0 |
| B | 0 | 320 | 0 |
| C | 0 | 320 | 0 |
| D | 0 | 320 | 0 |
| Mode M9 | |||
|---|---|---|---|
| Quadrant | BADHDUFLAG | Total packets | Discarded packets |
| A | 0 | 50 | 0 |
| B | 0 | 50 | 0 |
| C | 0 | 50 | 0 |
| D | 0 | 51 | 0 |
| Mode M0 | |||
|---|---|---|---|
| Quadrant | BADHDUFLAG | Total packets | Discarded packets |
| A | 0 | 35190 | 5 |
| B | 0 | 36625 | 4 |
| C | 0 | 34649 | 4 |
| D | 0 | 58758 | 4 |
| Quadrant | Total seconds | Saturated seconds | Saturation percentage |
|---|---|---|---|
| A | 15629 | 75 | 0.479877% |
| B | 15629 | 398 | 2.546548% |
| C | 15629 | 157 | 1.004543% |
| D | 15629 | 2974 | 19.028729% |
Noise dominated data is calculated using 1-second bins in cleaned event files. If a bin has >2000 counts, and if more than 50% of those come from <1% of pixels, then it is considered to be noise-dominated and hence unusable.
| Quadrant | # 1 sec bins | Bins with >0 counts | Bins with >2000 counts | High rate bins dominated by noise | Noise dominated (total time) | Noise dominated (detector-on time) | Marked lightcurve |
|---|---|---|---|---|---|---|---|
| A | 19866 | 15632 | 58 | 58 | 0.29% | 0.37% | 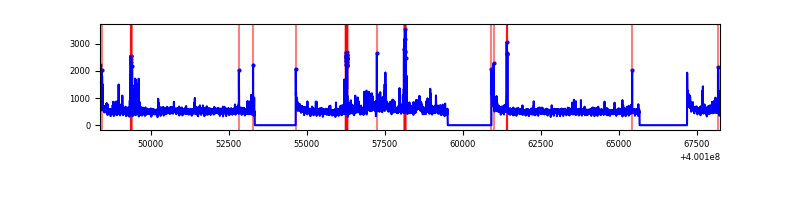 |
| B | 19866 | 15632 | 275 | 275 | 1.38% | 1.76% | 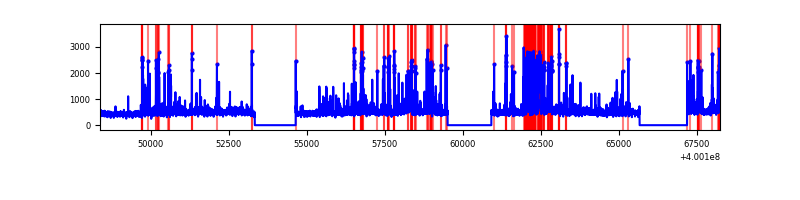 |
| C | 19866 | 15632 | 144 | 144 | 0.72% | 0.92% | 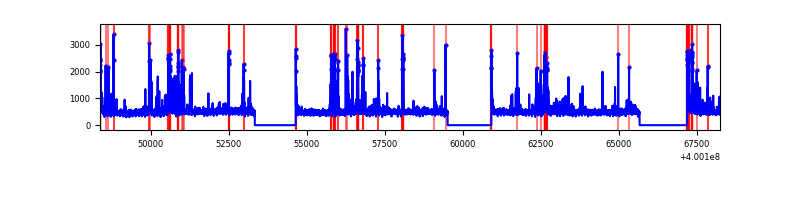 |
| D | 19865 | 15630 | 2936 | 2936 | 14.78% | 18.78% | 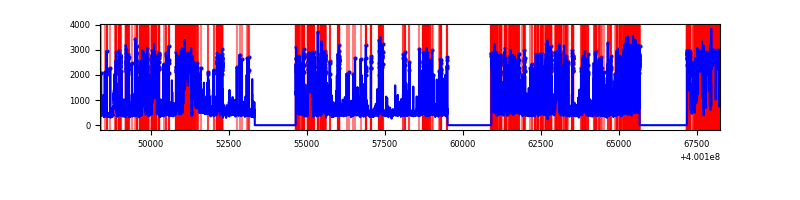 |
Top three noisy pixels from each quadrant. If the there are fewer than three noisy pixels in the level2.evt file, extra rows are filled as -1
| Pixel properties | Quadrant properties | ||||||
|---|---|---|---|---|---|---|---|
| Quadrant | DetID | PixID | Counts | Sigma | Mean | Median | Sigma |
| A | 10 | 83 | 820581 | 2232.17 | 1798 | 1758 | 366.8 |
| A | 15 | 222 | 418641 | 1136.45 | 1798 | 1758 | 366.8 |
| A | 9 | 143 | 178376 | 481.47 | 1798 | 1758 | 366.8 |
| B | 5 | 172 | 1115591 | 3286.01 | 1779 | 1733 | 339.0 |
| B | 0 | 229 | 250002 | 732.42 | 1779 | 1733 | 339.0 |
| B | 0 | 213 | 241740 | 708.05 | 1779 | 1733 | 339.0 |
| C | 14 | 254 | 814751 | 1988.17 | 1746 | 1756 | 408.9 |
| C | 15 | 214 | 673460 | 1642.64 | 1746 | 1756 | 408.9 |
| C | 0 | 10 | 143027 | 345.48 | 1746 | 1756 | 408.9 |
| D | 12 | 227 | 4013227 | 10183.61 | 1588 | 1542 | 393.9 |
| D | 12 | 233 | 3224802 | 8182.2 | 1588 | 1542 | 393.9 |
| D | 2 | 249 | 1088660 | 2759.63 | 1588 | 1542 | 393.9 |
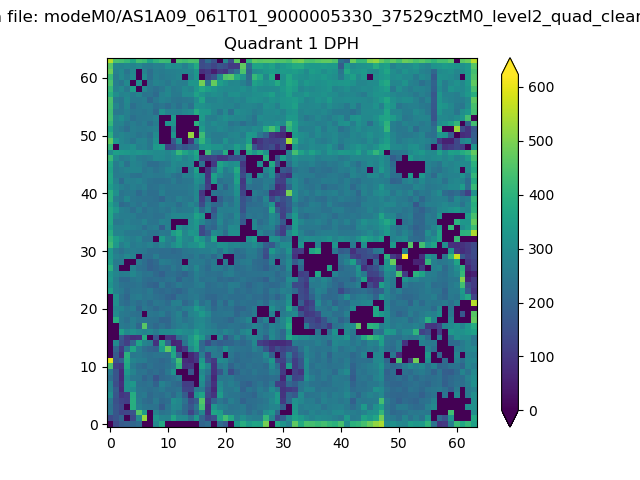
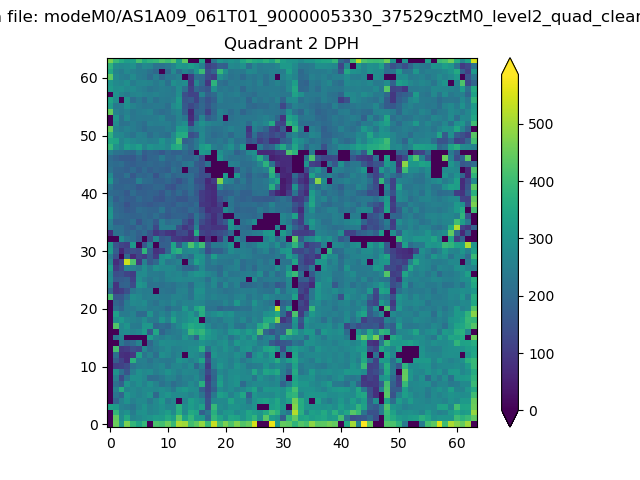
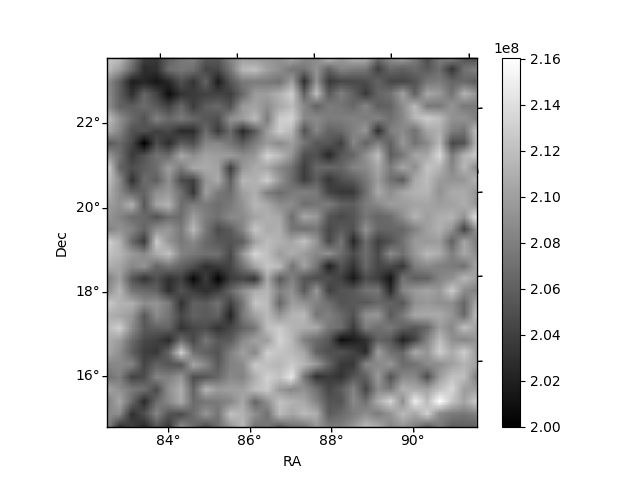
Histogram calculated using DETX and DETY for each event in the final _common_clean file
| Quadrant A |  |
 |
Quadrant B |
|---|---|---|---|
| Quadrant D | 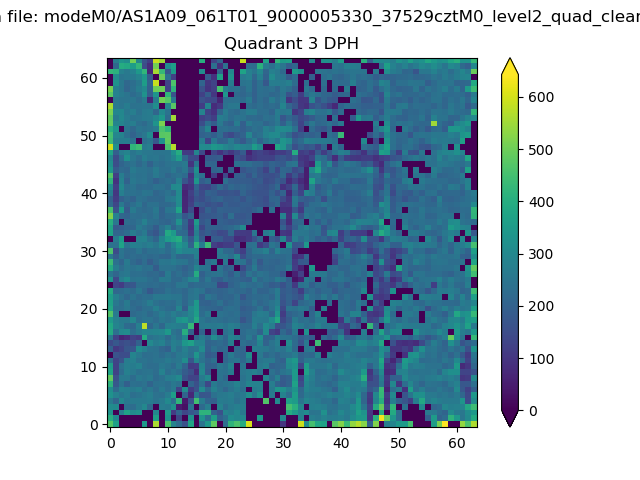 |
 |
Quadrant C |
| Plot type | Count rate plots | Images |
|---|---|---|
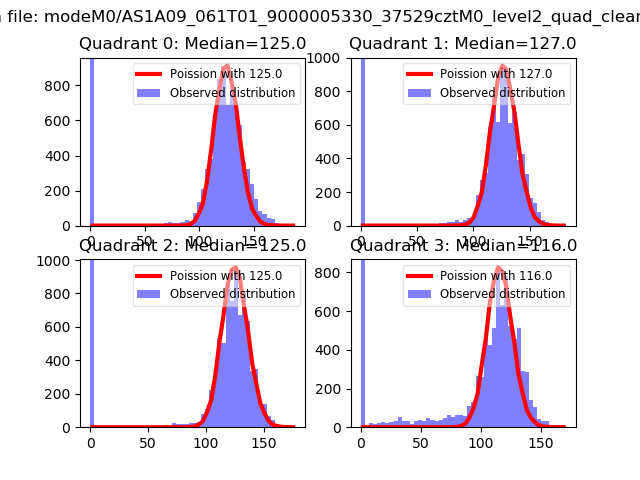
| Comparison with Poisson distribution Blue bars denote a histogram of data divided into 1 sec bins. Red curve is a Poisson curve with rate = median count rate of data. |
 |
 |
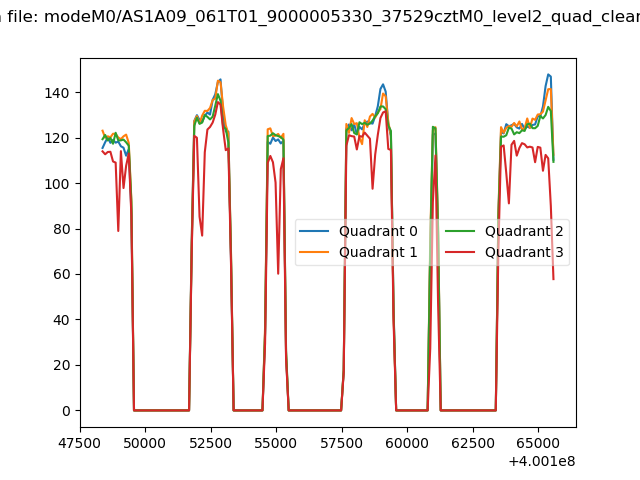
| Quadrant-wise count rates Data is divided into 100 sec bins |
 |
|
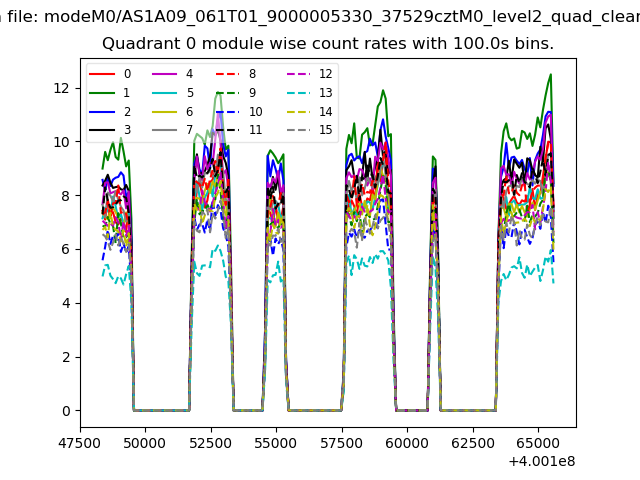
| Module-wise count rates for Quadrant A Data is divided into 100 sec bins |
 |
 |
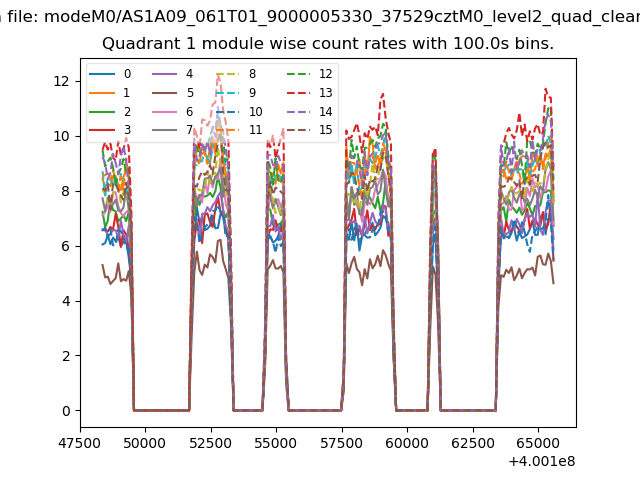
| Module-wise count rates for Quadrant B Data is divided into 100 sec bins |
 |
 |
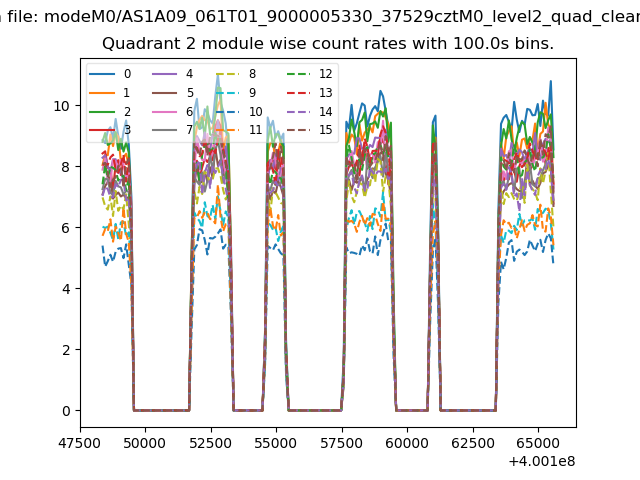
| Module-wise count rates for Quadrant C Data is divided into 100 sec bins |
 |
 |
| Module-wise count rates for Quadrant D Data is divided into 100 sec bins |
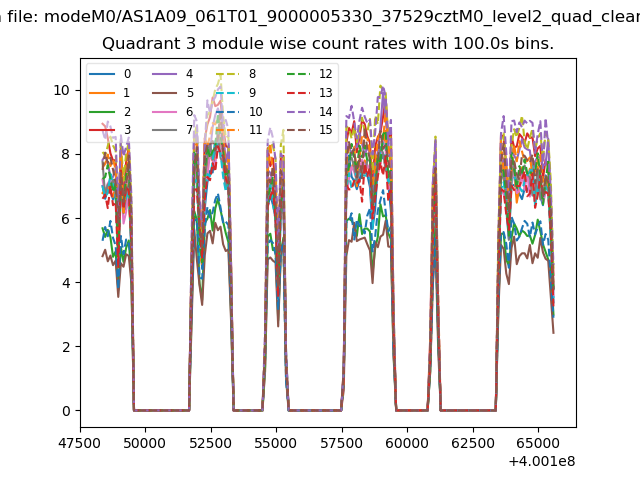 |
 |
| Parameter | Plot |
|---|---|
| CZT HV Monitor | 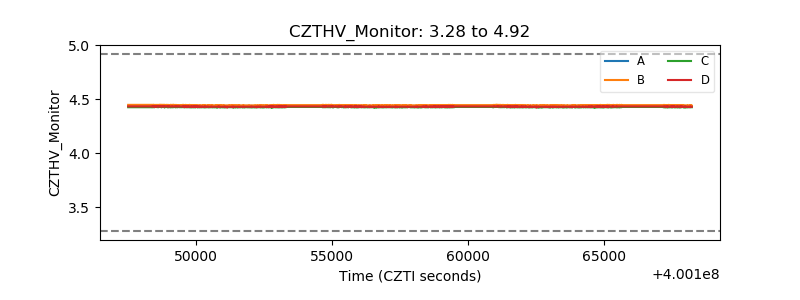 |
| D_VDD | 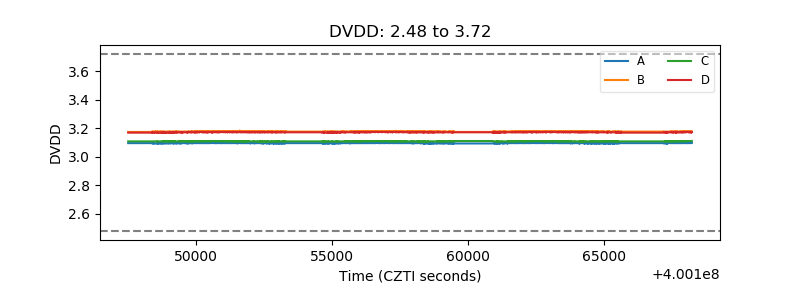 |
| Temperature 1 | 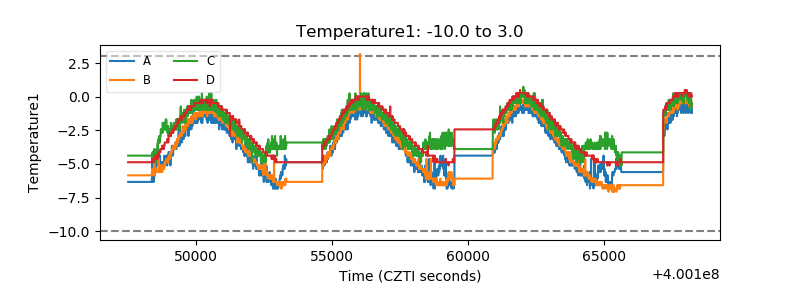 |
| Veto HV Monitor |  |
| Veto LLD | 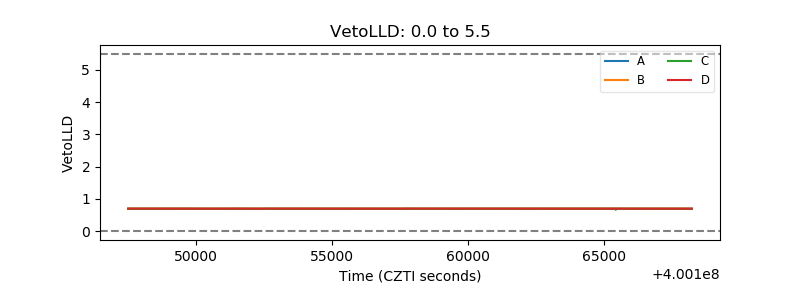 |
| Alpha Counter | 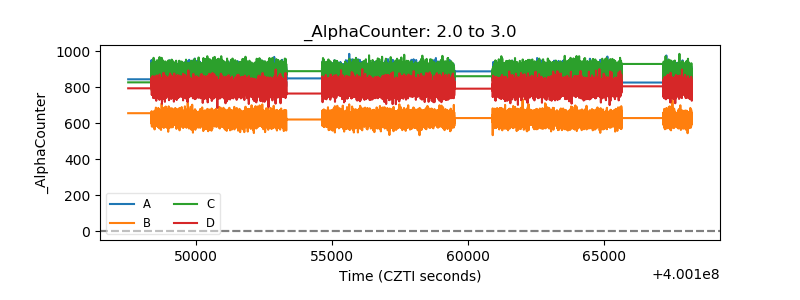 |
| _CPM_Rate | 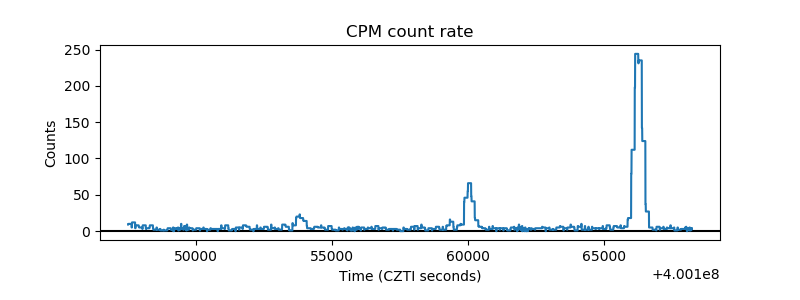 |
| CZT Counter | 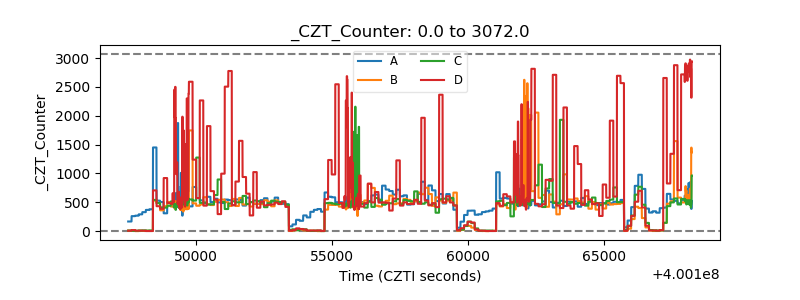 |
| +2.5 Volts monitor |  |
| +5 Volts monitor | 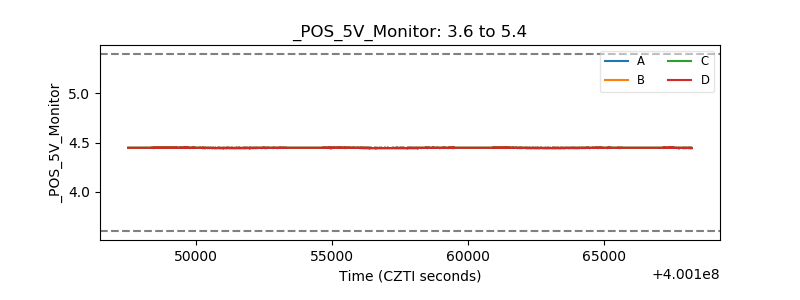 |
| _ROLL_ROT | 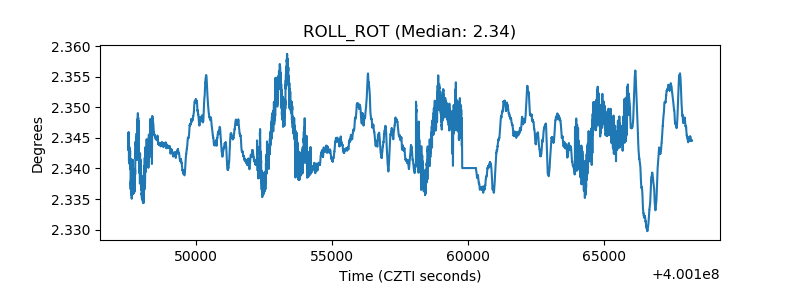 |
| _Roll_DEC | 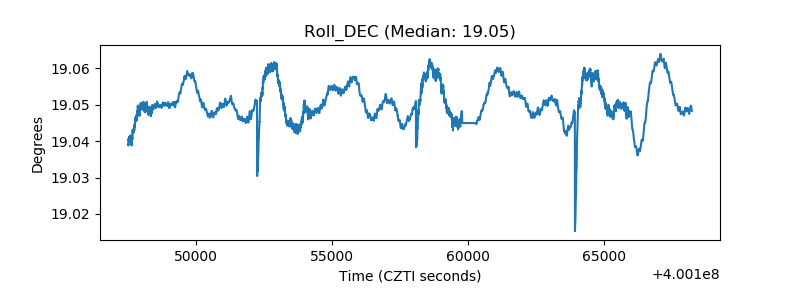 |
| _Roll_RA | 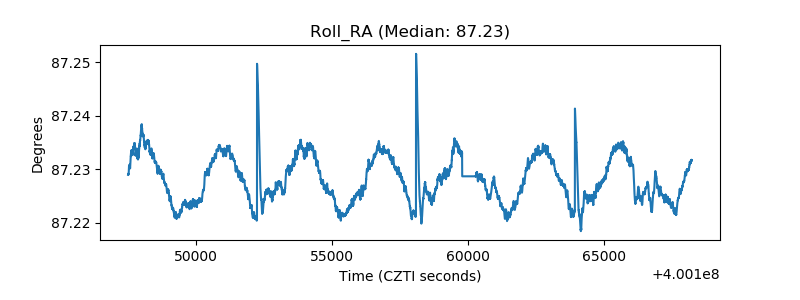 |
| Veto Counter | 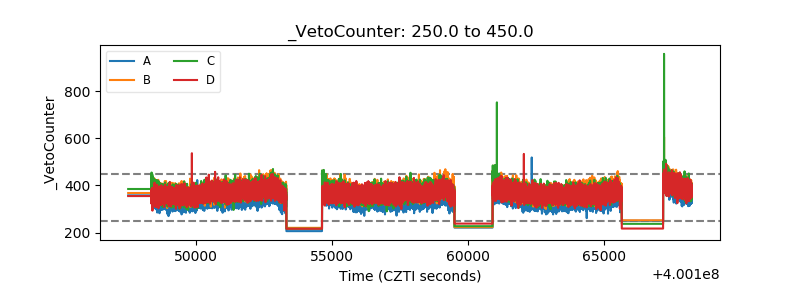 |