| Param | Original file | Final file |
|---|---|---|
| Filename | modeM0/AS1A09_061T01_9000005330_37530cztM0_level2.evt | modeM0/AS1A09_061T01_9000005330_37530cztM0_level2_quad_clean.evt |
| Size (bytes) | 679,233,600 | 50,319,360 |
| Size | 647.8 MB | 48.0 MB |
| Events in quadrant A | 3,078,858 | 308,191 |
| Events in quadrant B | 3,334,910 | 310,982 |
| Events in quadrant C | 3,030,688 | 304,355 |
| Events in quadrant D | 10,747,362 | 207,394 |
| Mode SS | |||
|---|---|---|---|
| Quadrant | BADHDUFLAG | Total packets | Discarded packets |
| A | 0 | 114 | 0 |
| B | 0 | 114 | 0 |
| C | 0 | 114 | 0 |
| D | 0 | 114 | 0 |
| Mode M9 | |||
|---|---|---|---|
| Quadrant | BADHDUFLAG | Total packets | Discarded packets |
| A | 0 | 21 | 0 |
| B | 0 | 21 | 0 |
| C | 0 | 21 | 0 |
| D | 0 | 22 | 0 |
| Mode M0 | |||
|---|---|---|---|
| Quadrant | BADHDUFLAG | Total packets | Discarded packets |
| A | 0 | 12546 | 3 |
| B | 0 | 13299 | 2 |
| C | 0 | 12290 | 2 |
| D | 0 | 35681 | 2 |
| Quadrant | Total seconds | Saturated seconds | Saturation percentage |
|---|---|---|---|
| A | 5599 | 28 | 0.500089% |
| B | 5599 | 145 | 2.589748% |
| C | 5599 | 59 | 1.053760% |
| D | 5599 | 3163 | 56.492231% |
Noise dominated data is calculated using 1-second bins in cleaned event files. If a bin has >2000 counts, and if more than 50% of those come from <1% of pixels, then it is considered to be noise-dominated and hence unusable.
| Quadrant | # 1 sec bins | Bins with >0 counts | Bins with >2000 counts | High rate bins dominated by noise | Noise dominated (total time) | Noise dominated (detector-on time) | Marked lightcurve |
|---|---|---|---|---|---|---|---|
| A | 7240 | 5600 | 16 | 16 | 0.22% | 0.29% | 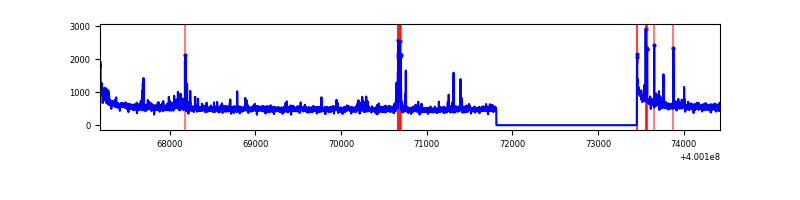 |
| B | 7240 | 5600 | 107 | 107 | 1.48% | 1.91% | 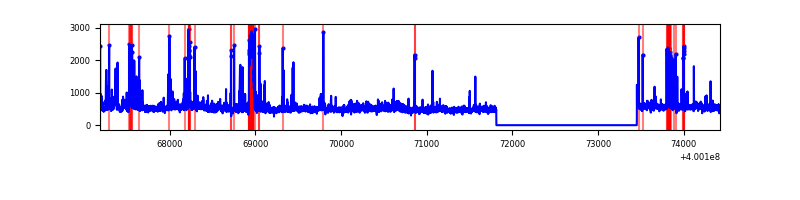 |
| C | 7240 | 5600 | 55 | 55 | 0.76% | 0.98% | 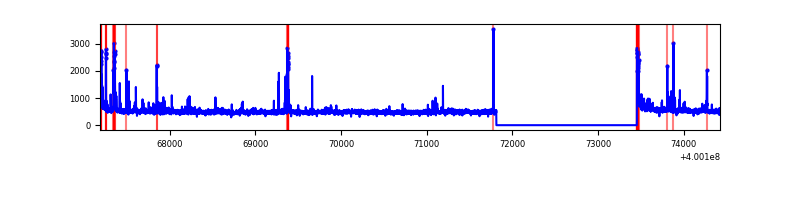 |
| D | 7240 | 5600 | 3141 | 3141 | 43.38% | 56.09% | 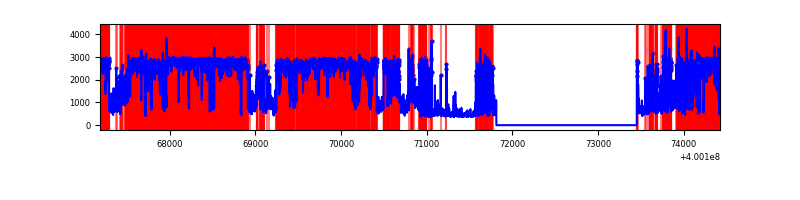 |
Top three noisy pixels from each quadrant. If the there are fewer than three noisy pixels in the level2.evt file, extra rows are filled as -1
| Pixel properties | Quadrant properties | ||||||
|---|---|---|---|---|---|---|---|
| Quadrant | DetID | PixID | Counts | Sigma | Mean | Median | Sigma |
| A | 10 | 83 | 341705 | 2554.26 | 652 | 639 | 133.5 |
| A | 9 | 143 | 101084 | 752.24 | 652 | 639 | 133.5 |
| A | 6 | 10 | 54319 | 402.01 | 652 | 639 | 133.5 |
| B | 5 | 172 | 378882 | 3016.23 | 646 | 629 | 125.4 |
| B | 0 | 213 | 131802 | 1045.99 | 646 | 629 | 125.4 |
| B | 0 | 229 | 65699 | 518.88 | 646 | 629 | 125.4 |
| C | 15 | 214 | 244943 | 1625.72 | 634 | 639 | 150.3 |
| C | 14 | 254 | 188174 | 1247.95 | 634 | 639 | 150.3 |
| C | 0 | 10 | 97008 | 641.29 | 634 | 639 | 150.3 |
| D | 12 | 227 | 7829923 | 74135.26 | 419 | 407 | 105.6 |
| D | 2 | 249 | 664035 | 6283.69 | 419 | 407 | 105.6 |
| D | 12 | 233 | 297531 | 2813.38 | 419 | 407 | 105.6 |
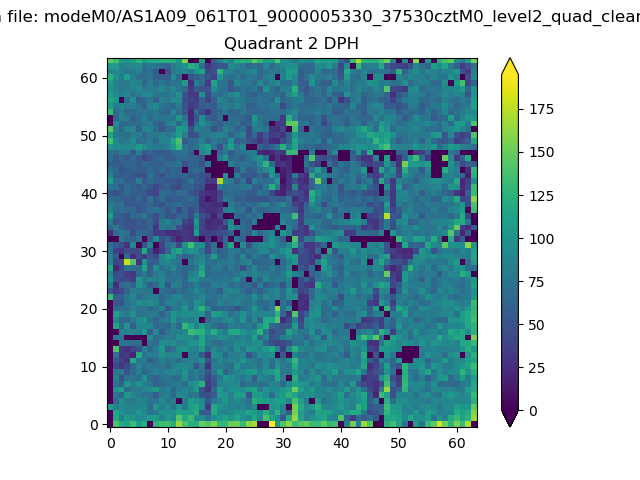
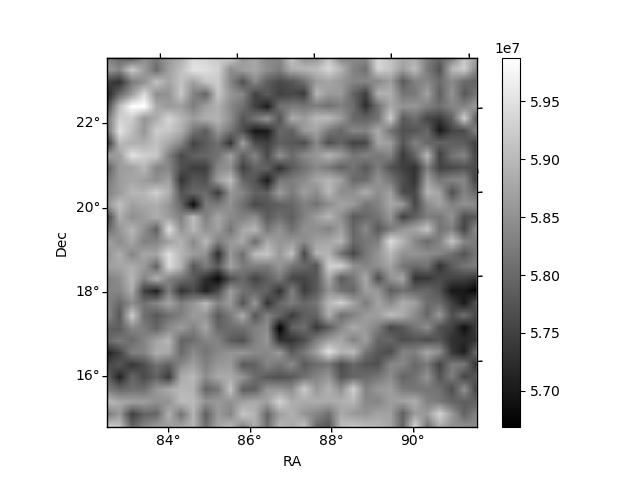
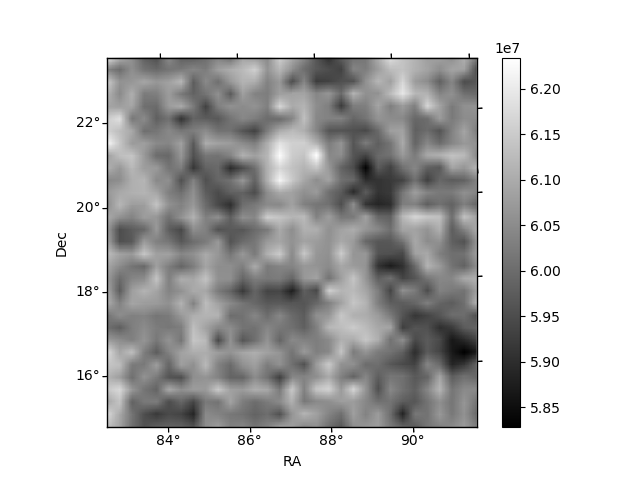
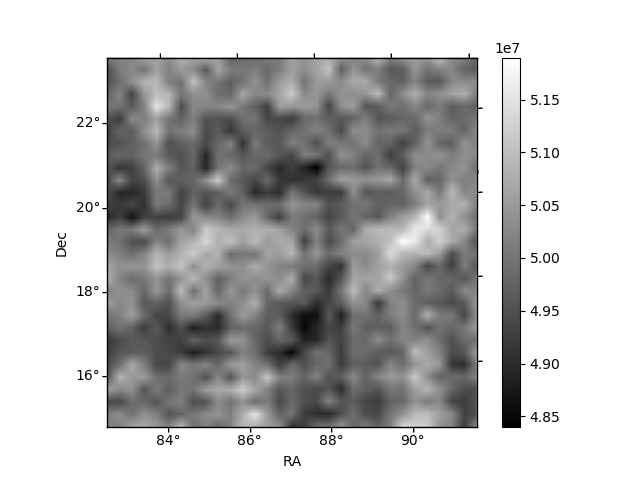
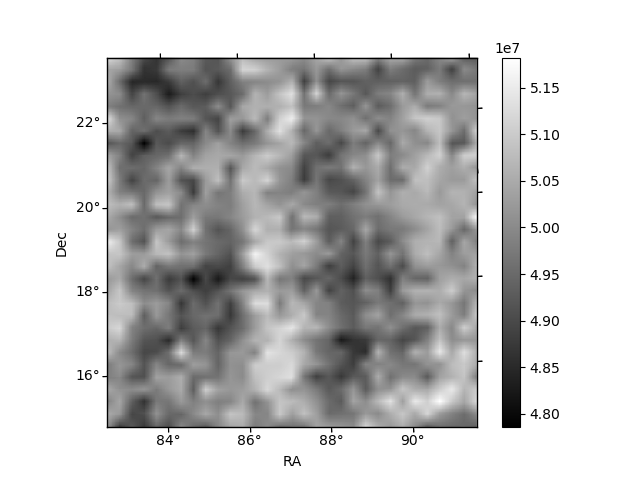
Histogram calculated using DETX and DETY for each event in the final _common_clean file
| Quadrant A | 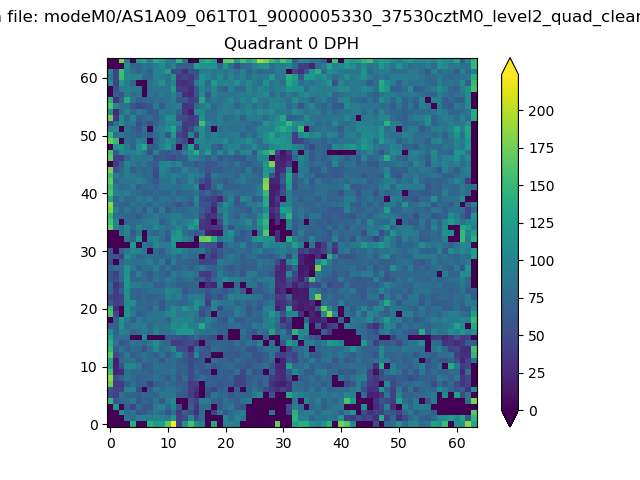 |
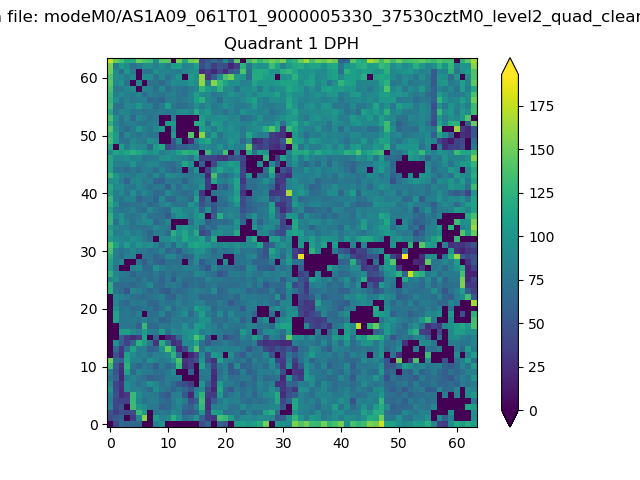 |
Quadrant B |
|---|---|---|---|
| Quadrant D | 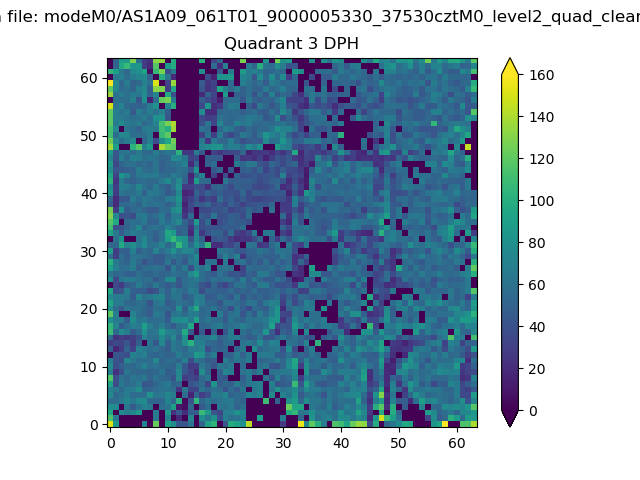 |
 |
Quadrant C |
| Plot type | Count rate plots | Images |
|---|---|---|
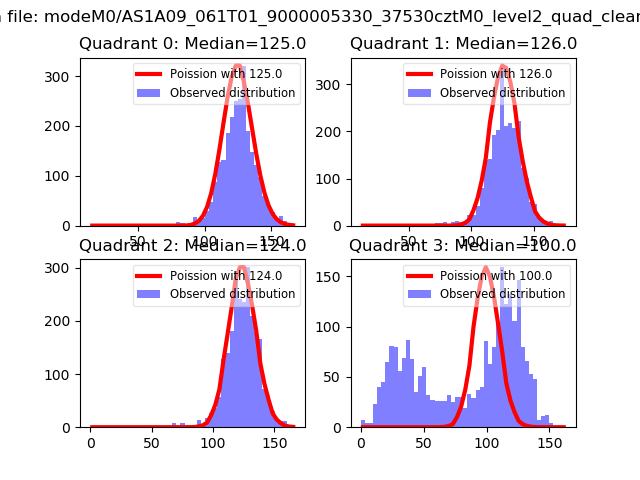
| Comparison with Poisson distribution Blue bars denote a histogram of data divided into 1 sec bins. Red curve is a Poisson curve with rate = median count rate of data. |
 |
 |
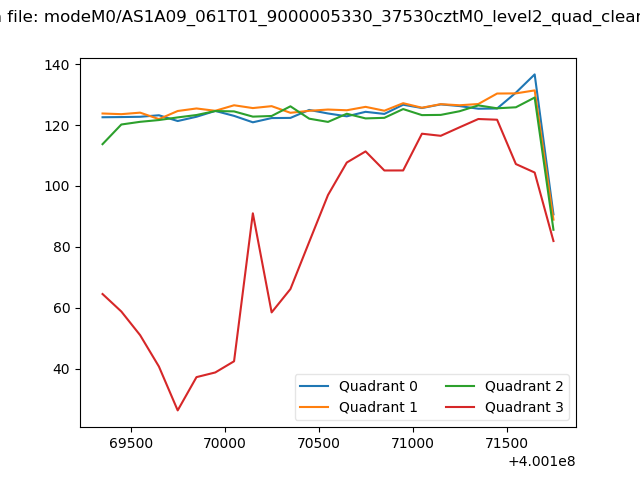
| Quadrant-wise count rates Data is divided into 100 sec bins |
 |
|
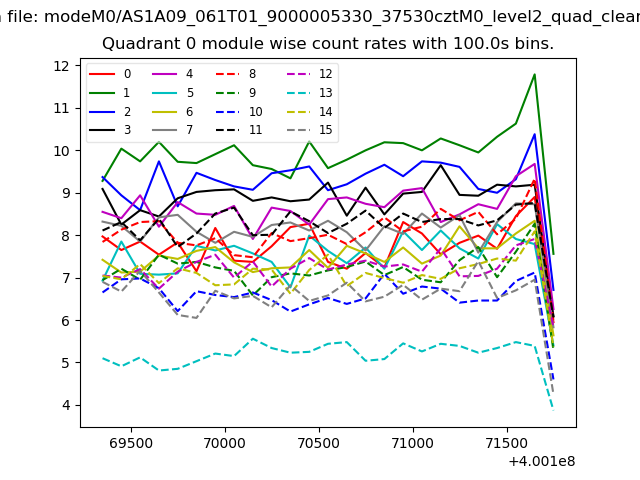
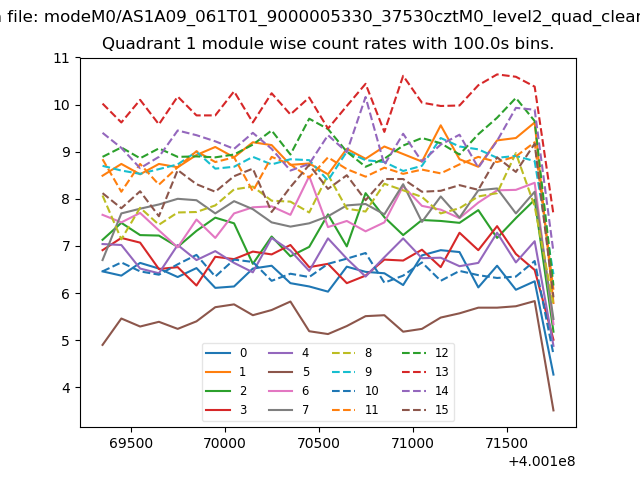
| Module-wise count rates for Quadrant A Data is divided into 100 sec bins |
 |
 |
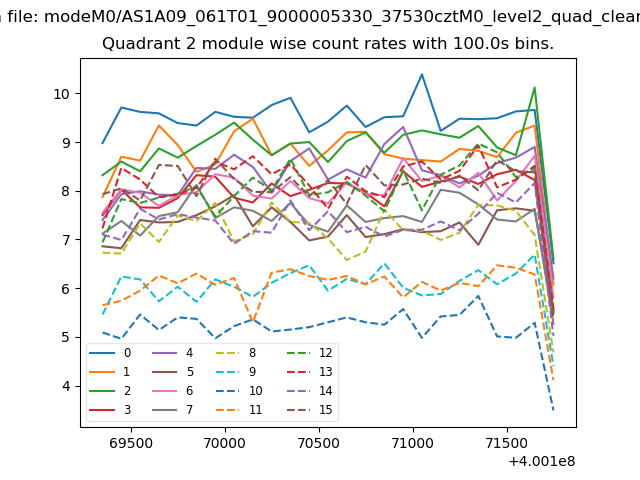
| Module-wise count rates for Quadrant B Data is divided into 100 sec bins |
 |
 |
| Module-wise count rates for Quadrant C Data is divided into 100 sec bins |
 |
 |
| Module-wise count rates for Quadrant D Data is divided into 100 sec bins |
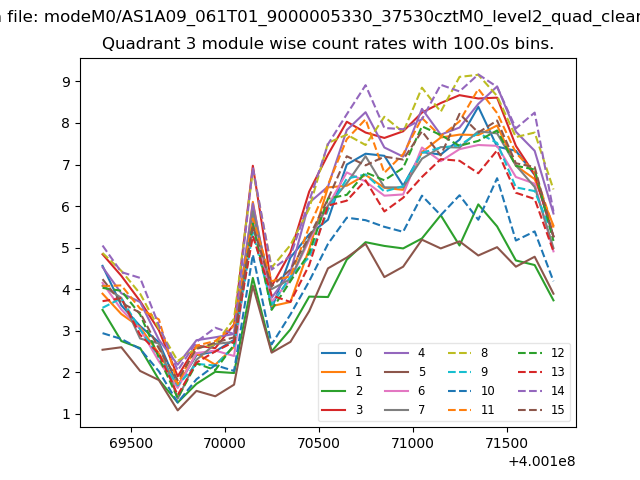 |
 |
| Parameter | Plot |
|---|---|
| CZT HV Monitor | 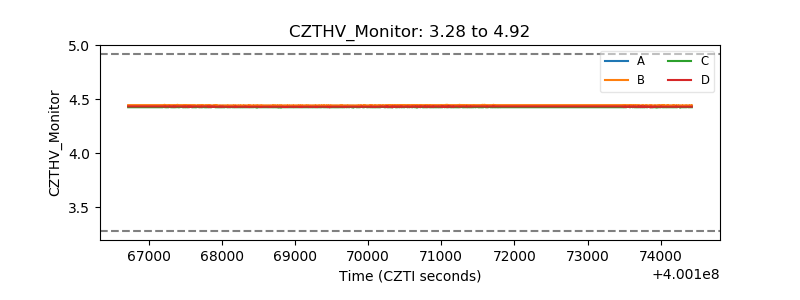 |
| D_VDD | 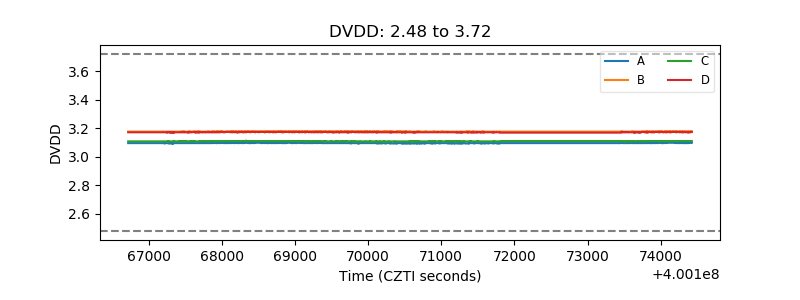 |
| Temperature 1 | 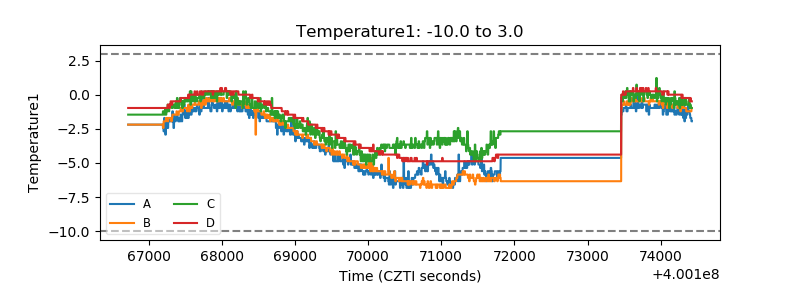 |
| Veto HV Monitor | 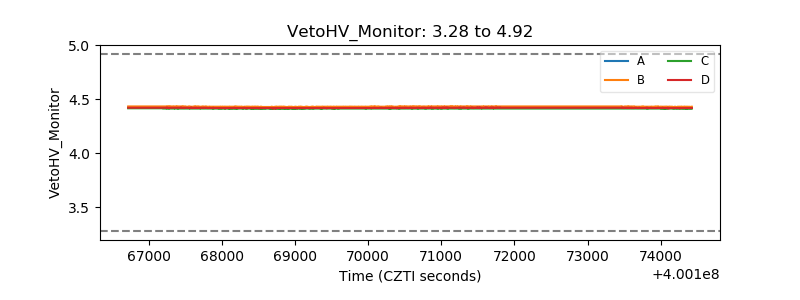 |
| Veto LLD | 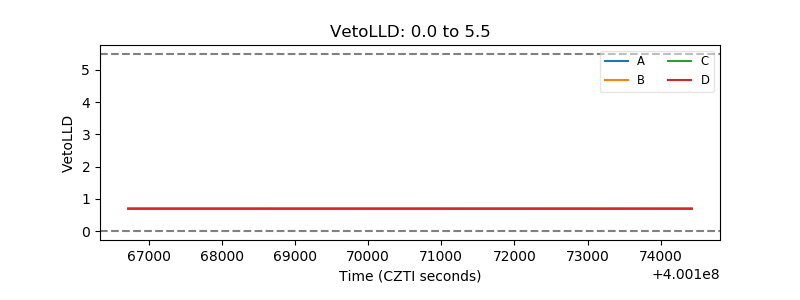 |
| Alpha Counter | 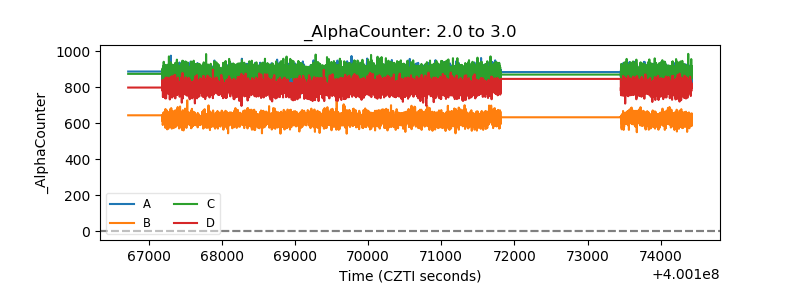 |
| _CPM_Rate | 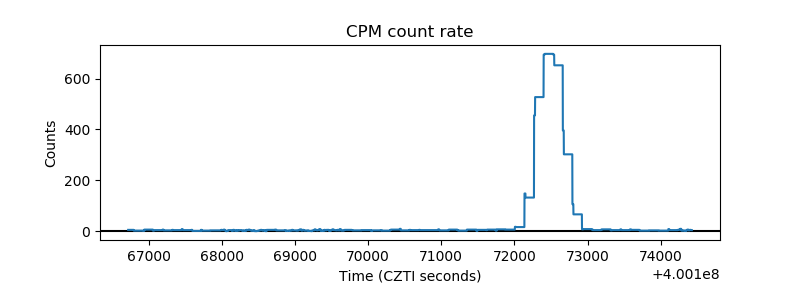 |
| CZT Counter | 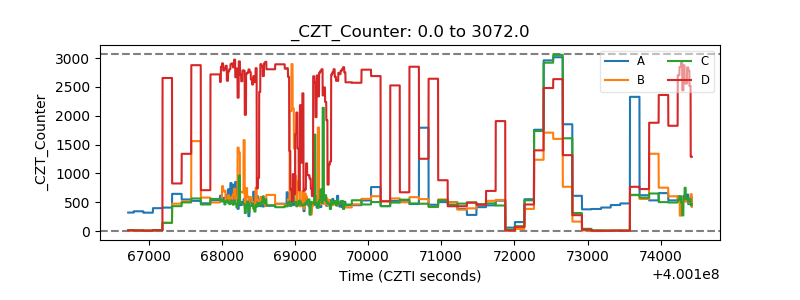 |
| +2.5 Volts monitor |  |
| +5 Volts monitor | 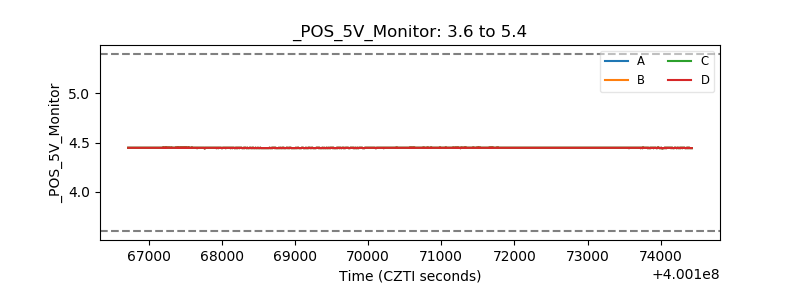 |
| _ROLL_ROT | 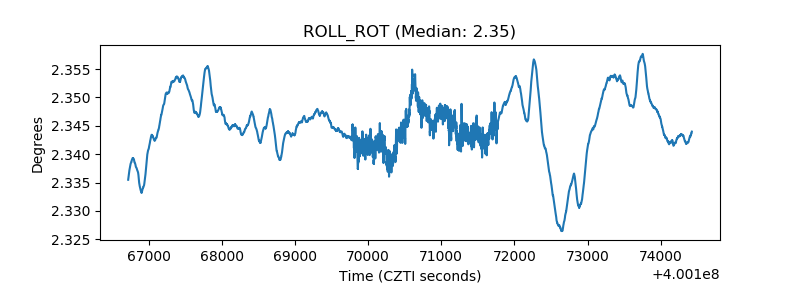 |
| _Roll_DEC | 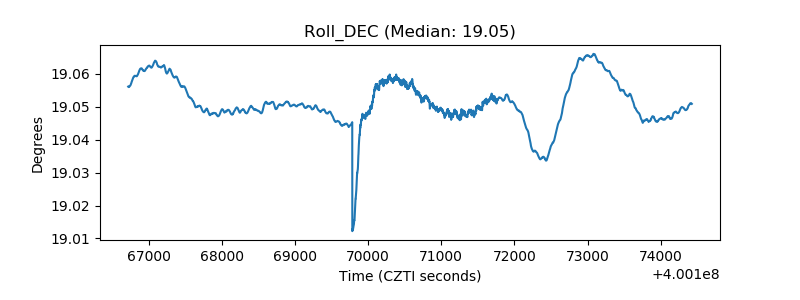 |
| _Roll_RA | 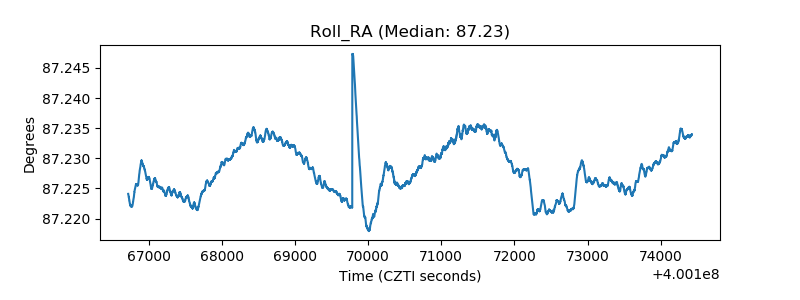 |
| Veto Counter | 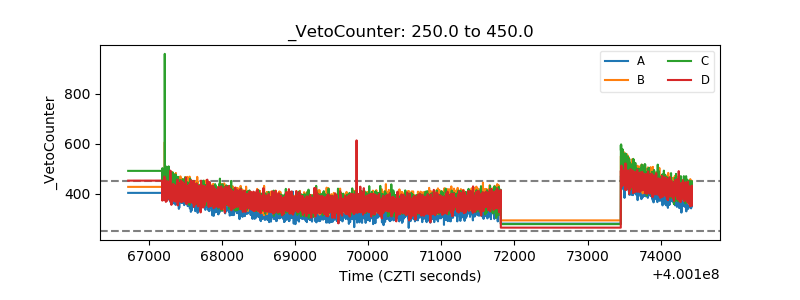 |