| Param | Original file | Final file |
|---|---|---|
| Filename | modeM0/AS1A09_061T01_9000005330_37532cztM0_level2.evt | modeM0/AS1A09_061T01_9000005330_37532cztM0_level2_quad_clean.evt |
| Size (bytes) | 2,924,994,240 | 320,935,680 |
| Size | 2.7 GB | 306.1 MB |
| Events in quadrant A | 17,339,182 | 1,946,285 |
| Events in quadrant B | 17,755,894 | 1,964,188 |
| Events in quadrant C | 17,222,039 | 1,934,652 |
| Events in quadrant D | 34,133,726 | 1,695,750 |
| Mode SS | |||
|---|---|---|---|
| Quadrant | BADHDUFLAG | Total packets | Discarded packets |
| A | 0 | 648 | 0 |
| B | 0 | 648 | 0 |
| C | 0 | 648 | 0 |
| D | 0 | 648 | 0 |
| Mode M9 | |||
|---|---|---|---|
| Quadrant | BADHDUFLAG | Total packets | Discarded packets |
| A | 0 | 94 | 0 |
| B | 0 | 94 | 0 |
| C | 0 | 94 | 0 |
| D | 0 | 94 | 0 |
| Mode M0 | |||
|---|---|---|---|
| Quadrant | BADHDUFLAG | Total packets | Discarded packets |
| A | 0 | 70515 | 10 |
| B | 0 | 72682 | 7 |
| C | 0 | 69889 | 7 |
| D | 0 | 122726 | 7 |
| Quadrant | Total seconds | Saturated seconds | Saturation percentage |
|---|---|---|---|
| A | 31688 | 192 | 0.605908% |
| B | 31688 | 637 | 2.010225% |
| C | 31688 | 252 | 0.795254% |
| D | 31688 | 6590 | 20.796516% |
Noise dominated data is calculated using 1-second bins in cleaned event files. If a bin has >2000 counts, and if more than 50% of those come from <1% of pixels, then it is considered to be noise-dominated and hence unusable.
| Quadrant | # 1 sec bins | Bins with >0 counts | Bins with >2000 counts | High rate bins dominated by noise | Noise dominated (total time) | Noise dominated (detector-on time) | Marked lightcurve |
|---|---|---|---|---|---|---|---|
| A | 44290 | 31695 | 141 | 141 | 0.32% | 0.44% | 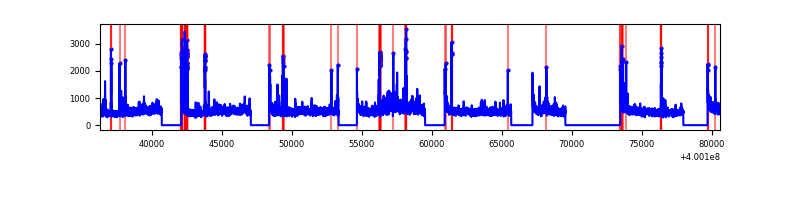 |
| B | 44290 | 31695 | 448 | 448 | 1.01% | 1.41% | 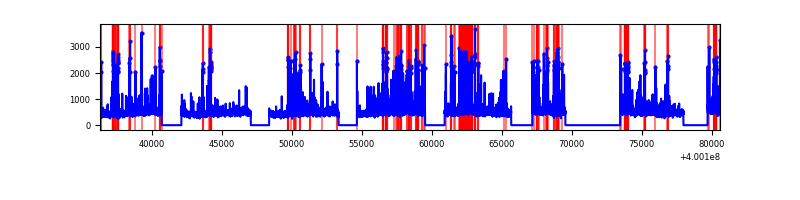 |
| C | 44290 | 31695 | 238 | 238 | 0.54% | 0.75% | 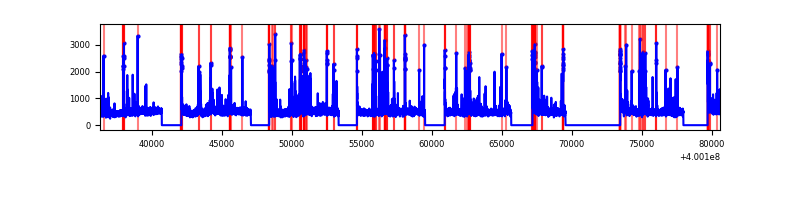 |
| D | 44289 | 31692 | 6487 | 6487 | 14.65% | 20.47% | 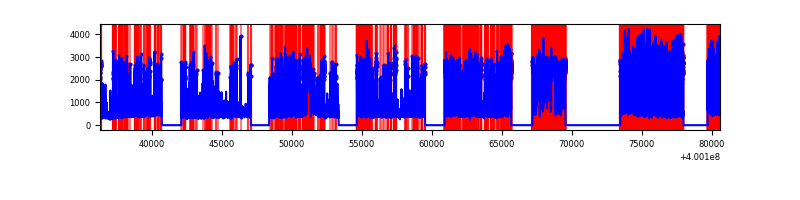 |
Top three noisy pixels from each quadrant. If the there are fewer than three noisy pixels in the level2.evt file, extra rows are filled as -1
| Pixel properties | Quadrant properties | ||||||
|---|---|---|---|---|---|---|---|
| Quadrant | DetID | PixID | Counts | Sigma | Mean | Median | Sigma |
| A | 10 | 83 | 1605657 | 2153.28 | 3664 | 3588 | 744.0 |
| A | 15 | 222 | 535807 | 715.34 | 3664 | 3588 | 744.0 |
| A | 13 | 248 | 395298 | 526.48 | 3664 | 3588 | 744.0 |
| B | 5 | 172 | 1748618 | 2523.77 | 3635 | 3542 | 691.5 |
| B | 0 | 229 | 378110 | 541.71 | 3635 | 3542 | 691.5 |
| B | 0 | 213 | 357515 | 511.92 | 3635 | 3542 | 691.5 |
| C | 15 | 214 | 1362830 | 1624.76 | 3568 | 3587 | 836.6 |
| C | 14 | 254 | 1207228 | 1438.76 | 3568 | 3587 | 836.6 |
| C | 0 | 10 | 299372 | 353.56 | 3568 | 3587 | 836.6 |
| D | 12 | 227 | 12511830 | 15898.7 | 3195 | 3103 | 786.8 |
| D | 12 | 233 | 3753500 | 4766.79 | 3195 | 3103 | 786.8 |
| D | 2 | 249 | 2071288 | 2628.68 | 3195 | 3103 | 786.8 |
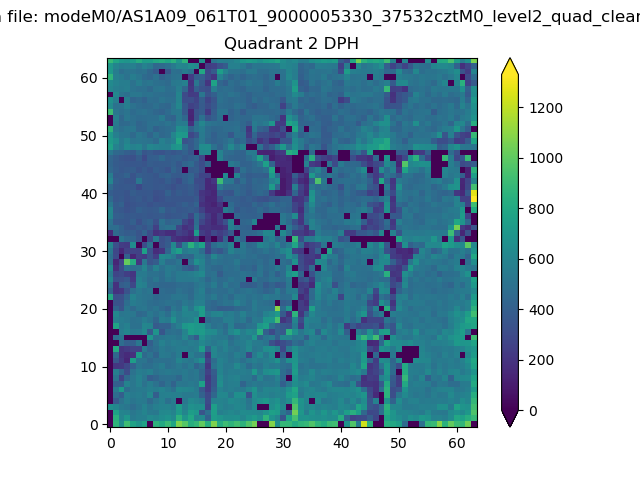
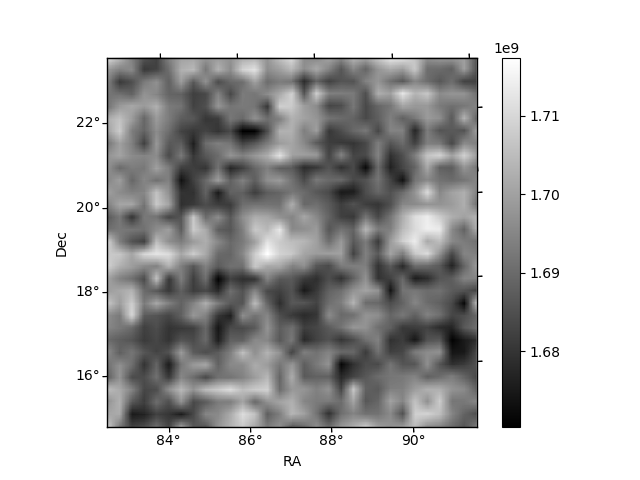
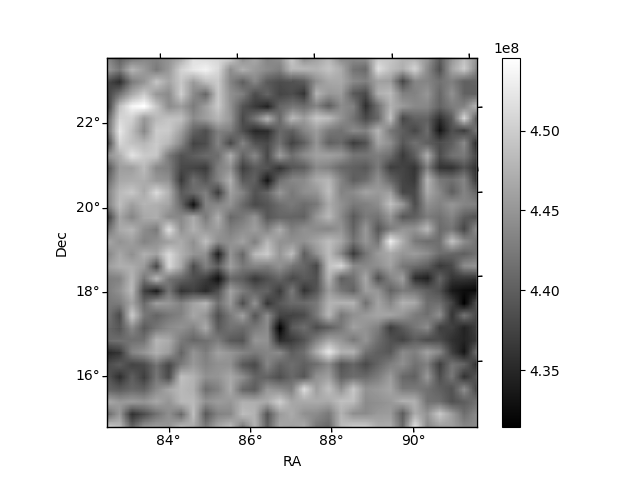
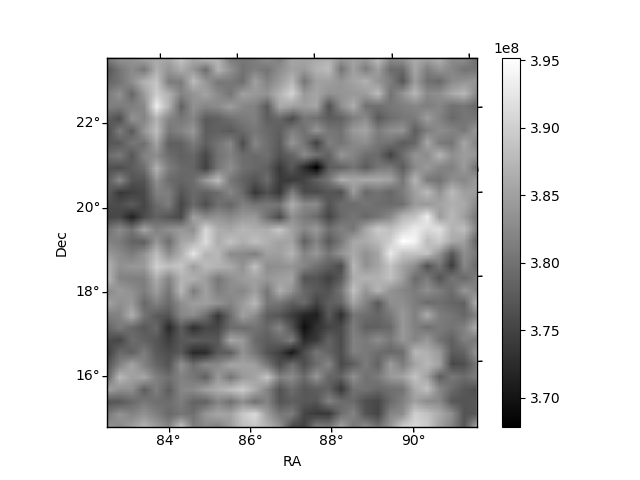
Histogram calculated using DETX and DETY for each event in the final _common_clean file
| Quadrant A | 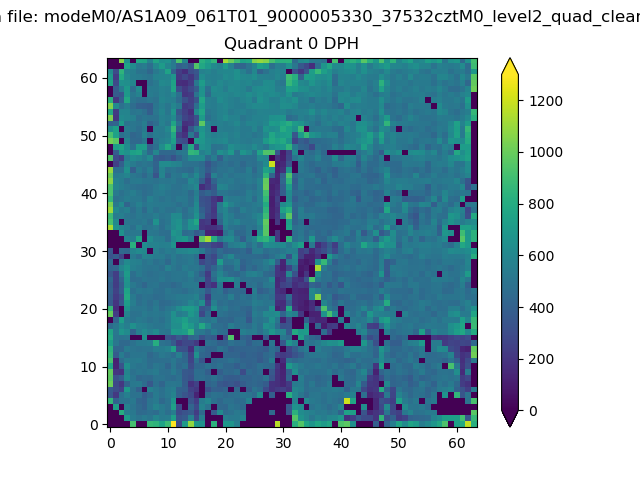 |
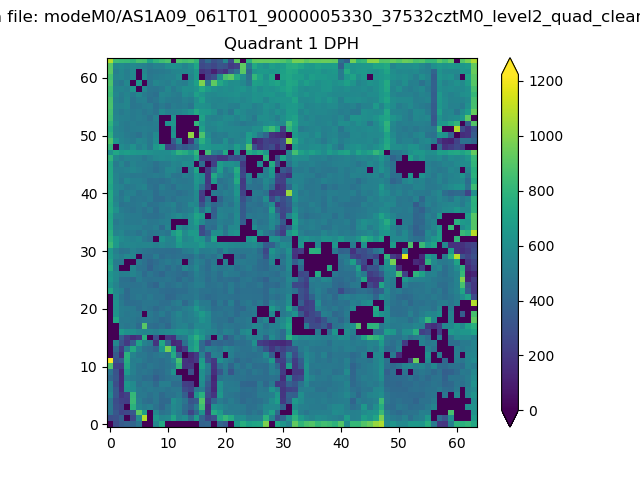 |
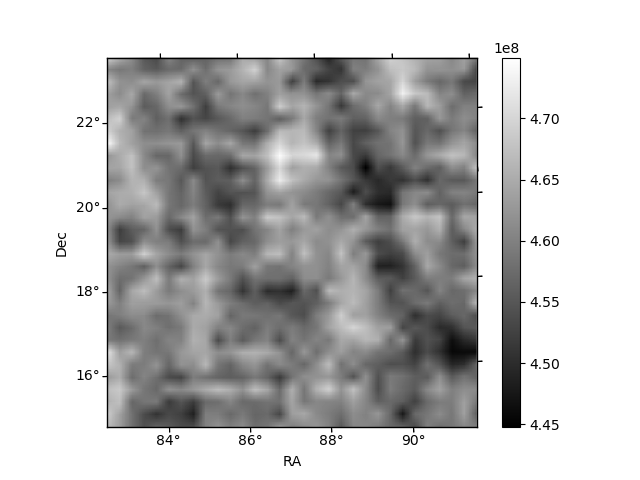
Quadrant B |
|---|---|---|---|
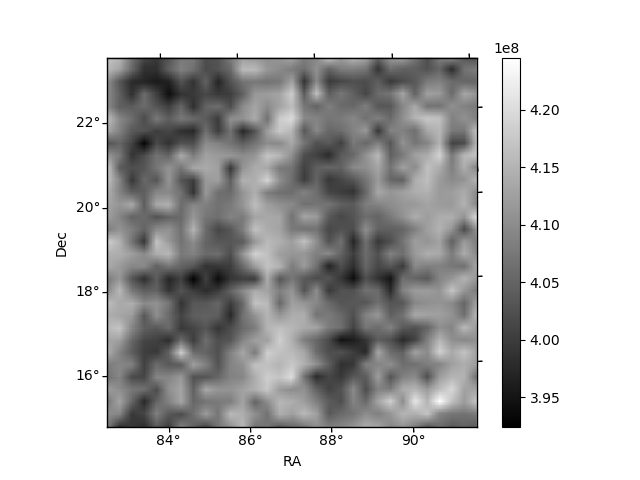
| Quadrant D | 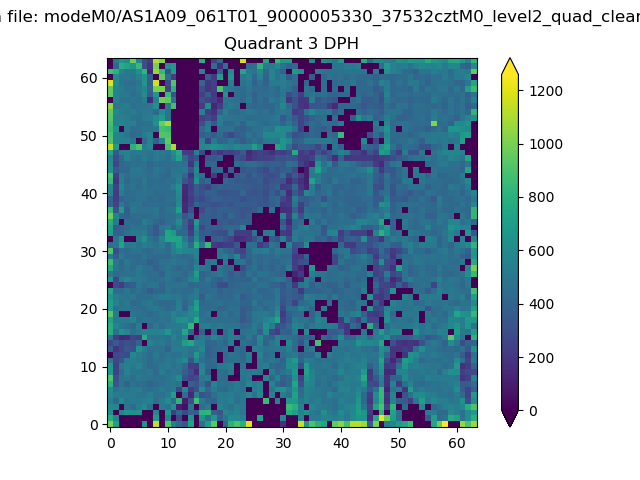 |
 |
Quadrant C |
| Plot type | Count rate plots | Images |
|---|---|---|
| Comparison with Poisson distribution Blue bars denote a histogram of data divided into 1 sec bins. Red curve is a Poisson curve with rate = median count rate of data. |
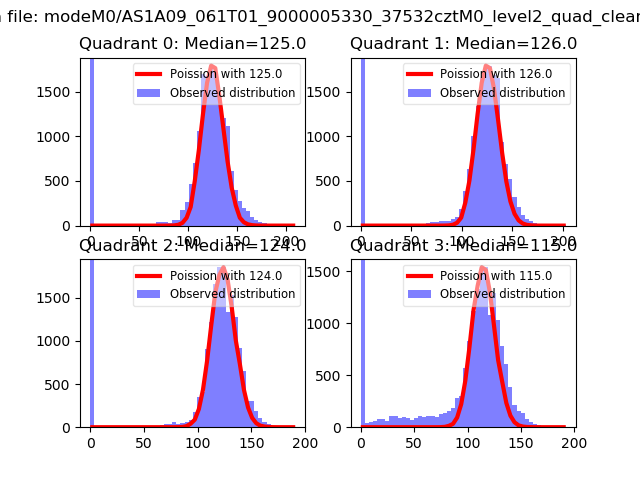 |
 |
| Quadrant-wise count rates Data is divided into 100 sec bins |
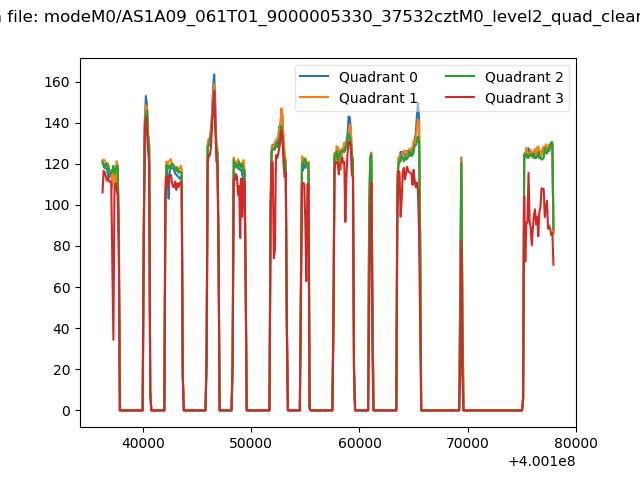 |
|
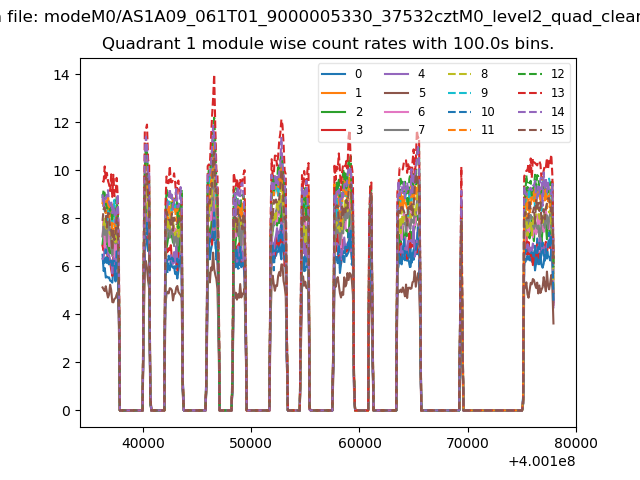
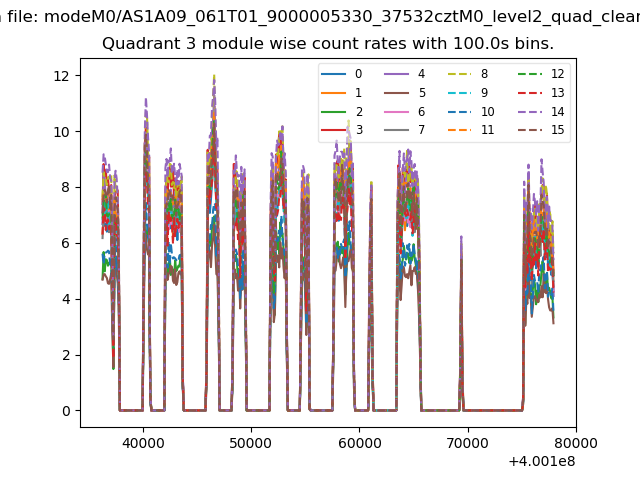
| Module-wise count rates for Quadrant A Data is divided into 100 sec bins |
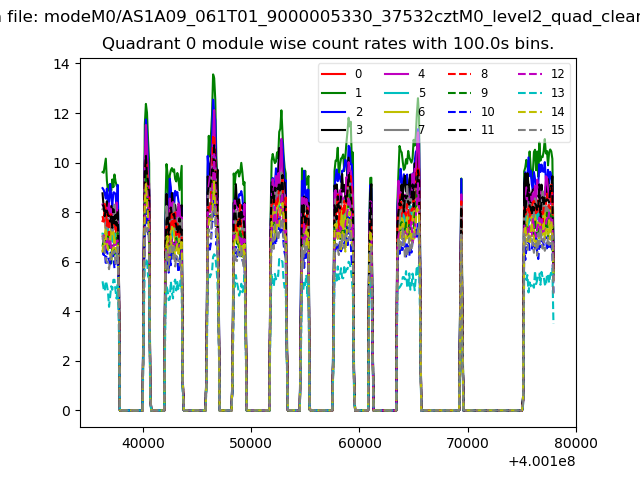 |
 |
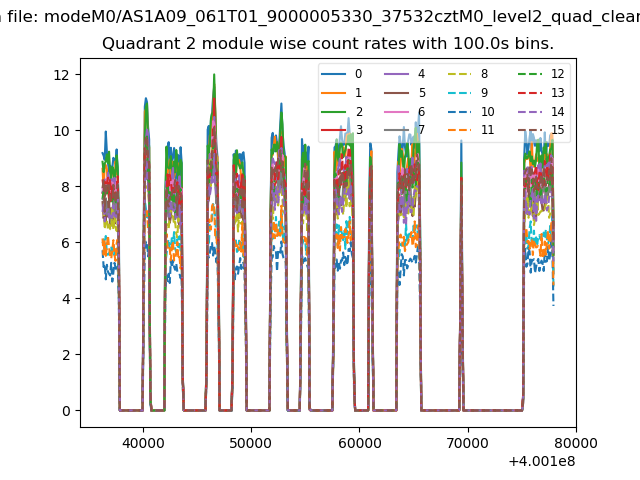
| Module-wise count rates for Quadrant B Data is divided into 100 sec bins |
 |
 |
| Module-wise count rates for Quadrant C Data is divided into 100 sec bins |
 |
 |
| Module-wise count rates for Quadrant D Data is divided into 100 sec bins |
 |
 |
| Parameter | Plot |
|---|---|
| CZT HV Monitor | 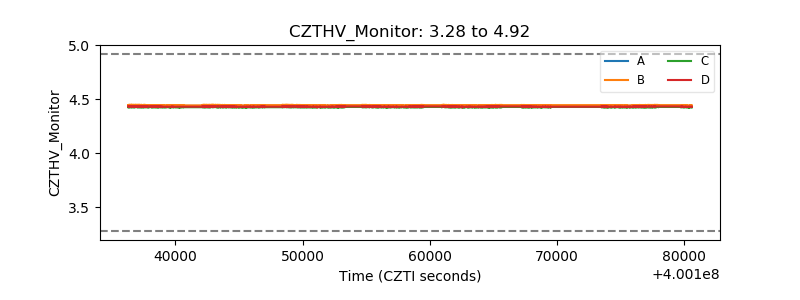 |
| D_VDD | 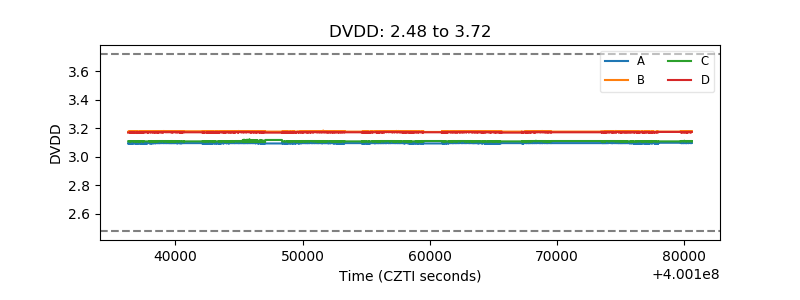 |
| Temperature 1 | 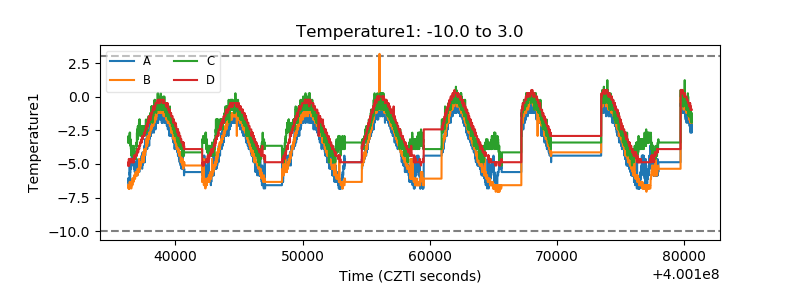 |
| Veto HV Monitor |  |
| Veto LLD | 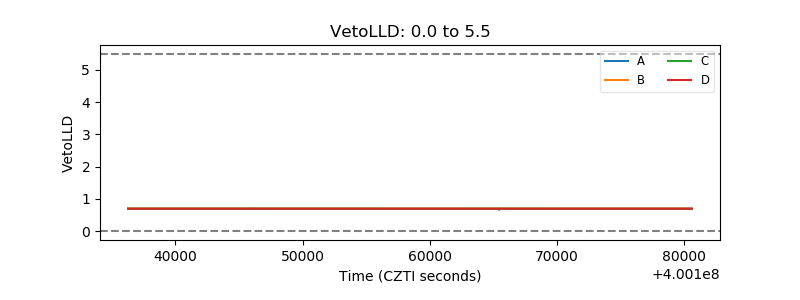 |
| Alpha Counter | 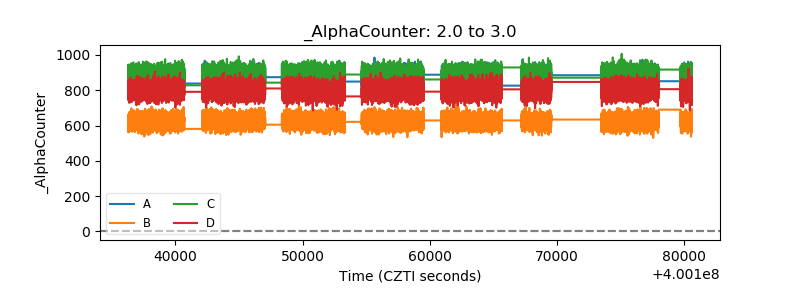 |
| _CPM_Rate | 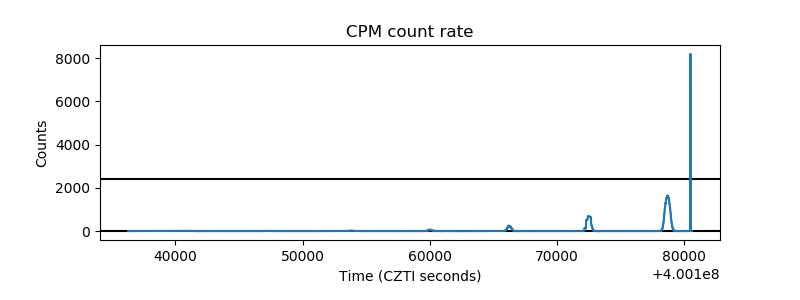 |
| CZT Counter | 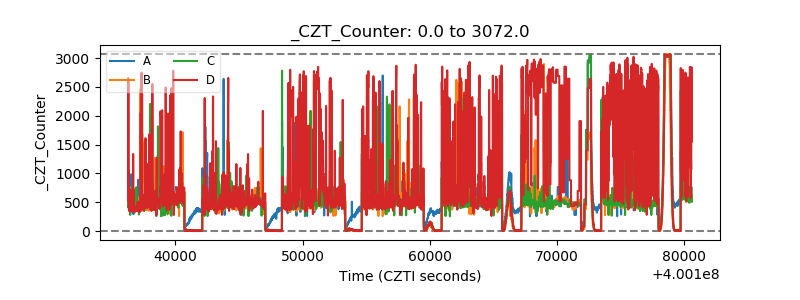 |
| +2.5 Volts monitor |  |
| +5 Volts monitor | 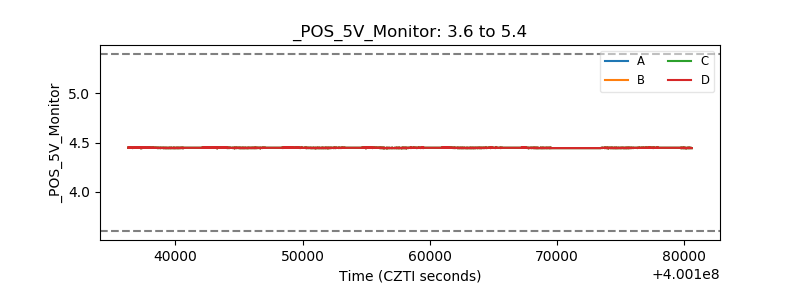 |
| _ROLL_ROT | 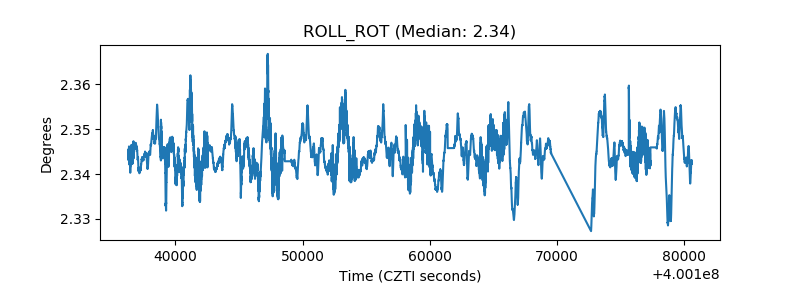 |
| _Roll_DEC | 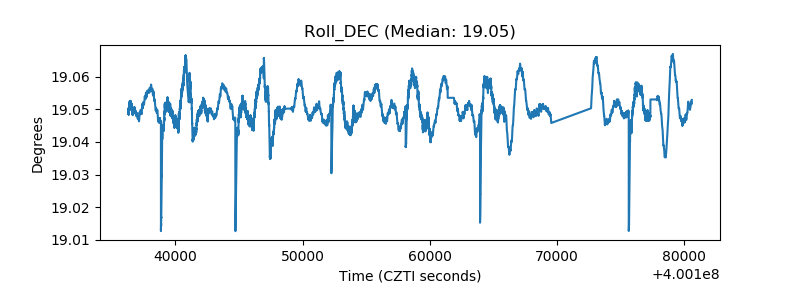 |
| _Roll_RA | 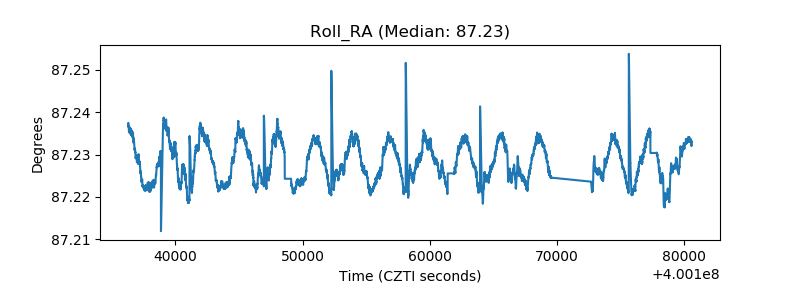 |
| Veto Counter | 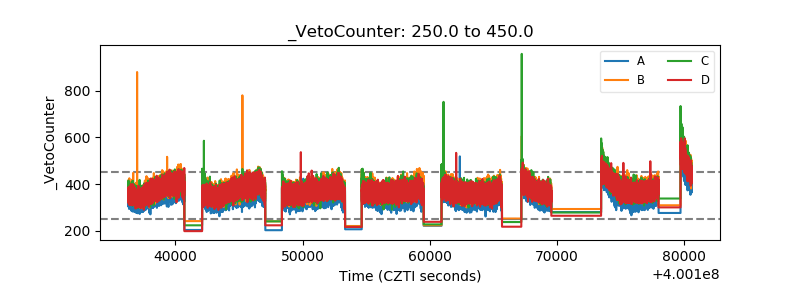 |